Categories
Forex Assets Forex Basic Strategies

Embarrassed By Your Index Trading Skills? Here’s What To Do…

Indexes are popular as they represent the economic activity in certain areas. Therefore it is often the case to see a company stock move inline with the index it belongs to. Some traders turn to trade only indexes instead, it is easier to conduct fundamental analysis based on aggregated performance than to follow what a single company is doing – unless a trader is very familiar with its capital structure, reports, and its services or products.

German traders are very interested in trading their DAX index, what’s more, they are very informed about their economy and even beginner traders have a good knowledge base to start trading the DAX right away. Following our previous series of articles about carrying over our forex trading experience and systems to other markets, this article will be about what we need to adjust to being as good in the index asset category. We will present just some opinions from professional prop traders, following the algorithm structure and ruleset already described before. If you have a system already with good results in forex, there is no reason not to transfer that knowledge and the system to seize opportunities from other markets.

Since each asset category has specialties, indexes require attention to several market aspects, additional work is also a lot of testing. By exploring other markets from forex, the overall capital gain potential is increased to a big extent, just by having 10% from forex, 10 from precious metals, 2% from commodities trading, and an additional 10% from indexes make a difference. Of course, mastering one market before moving to another is the right approach, although people are not prone to get out of the comfort zone. The percentages above are for an average trader who has a proven system and a plan set in place already, it is not an elite benchmark, but it is an elite gain all combined. To compare, elite traders and investors have a 15% return from one market per year, consistently.

Do not be impressed by an expert advisor or signals provider with their presented unrealistic returns as it is almost always extremely high to attract your attention only. After we address the fundamental peculiarities, we will make adjustments to our algorithm or technical analysis.

Trading indexes for individual traders is done through the CFDs. These contracts allowed great freedom in terms of what we can trade, be it precious metals futures, commodities, or indexes. Long and short positions are possible even with stocks over the CFDs. Now, CFDs have leverage and therefore margin, allowing traders to have bigger buying power than what is otherwise possible. Leverage also amplifies the amount traders can lose, going beyond zero. In classic buy and holding strategies, you can lose all of your investment value only if that asset goes to zero, which is not likely, nearly impossible for precious metals. Using CFDs, depending on leverage amount, you can lose all investments if the asset falls in value, even if it is just a 10-15% drop. Money management we carry over from forex will make your trading completely protected from this risk since we are very strict on how much we allocate for each position. Traders should first understand CFD type financial instruments before trading, they bring certain benefits and increased risks compared to traditional stock trading. 

Indexes you are about to trade are volatile compared to forex. Their daily ATR (14) value is very high, much higher than precious metals, and could go to 13000 pips. Consequently, you will also find trading indexes require more capital. The usual amount in your demo account such as 50.000 USD may not be enough, contracts are not the same size as well as the price per one unit. Also, note trading indices carry an increased risk of unexpected trade “glitches”, and by this we mean your positions could be closed by broker adjustments to their products. Such changes are usually announced by email and they are mostly about indices from certain countries where elections or other events are expected to heavily affect their equities market.

Brokers can change the terms during these times as they see fit, mostly it is just the leverage reduction, although, they can completely close the assets from trading. If you happen to have a position in such assets, they are likely to be forcibly closed. Sudden spread widening is also an issue with volatile assets such as indexes, if the volatility spike is extreme it could trigger your Stop Loss levels even though they are properly set in line with your trading plan. Therefore, demo trading for a longer period is a must. 

Indexes price action is very active, you will have a lot of signals and you can even be thrilled how good you are. If you are lured into real money trading with indexes before forward testing your system for a few months, it could cost you. Backtesting will take more effort than with other assets, there will be plenty of signals to mark and measure, and they all have to be compared. Every time you make adjustments, be it another indicator or money management rule, collecting results and comparing them will be the biggest part of your job. Forward testing will discover new issues such as above mentioned volatility spikes and spreads that may cause your successful backtested system to perform much worse in real-time. When this happens, be ready to make a new plan or elements to cut the losers first, then think about pushing for more winning signals without compromise. 

CFDs are somewhat restricted to US citizens. Alternatives to this limitation exist, one of them is trading ETFs instead. There are inverse ETFs that allow shorting whenever you are actually in a long trade, and for certain ETFs, you even have 1:3 leverage. So Exchange Trade Funds are more than enough substitute to CFDs, however, you will need to do research about them, they have specifics we are going to talk about in another article. 

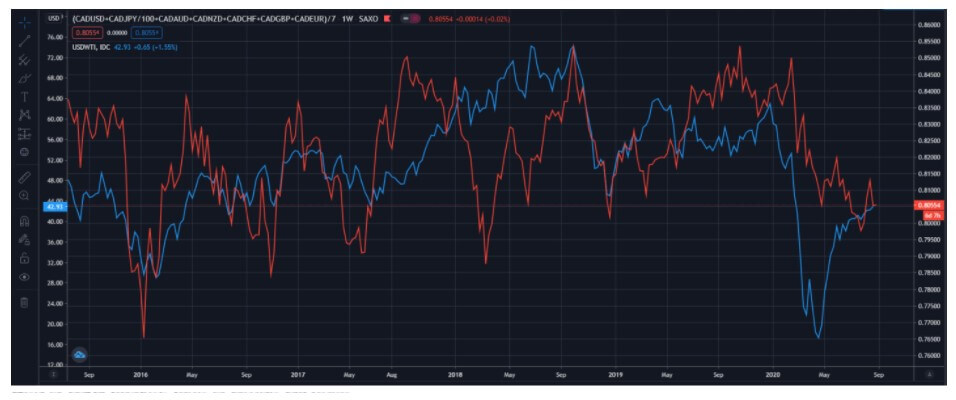
Now let’s get into the technical adjustments and setup for indexes according to technical prop traders’ recommendations. Firstly, you may notice correlations between the markets or indexes. If you are familiar with our opinion about correlations from articles about precious metals and forex trading, indexes are not much different. Correlation comes and goes without any clue why. Let’s take a look at the charts below, the daily timeframe shows very correlated movements between different indexes. 

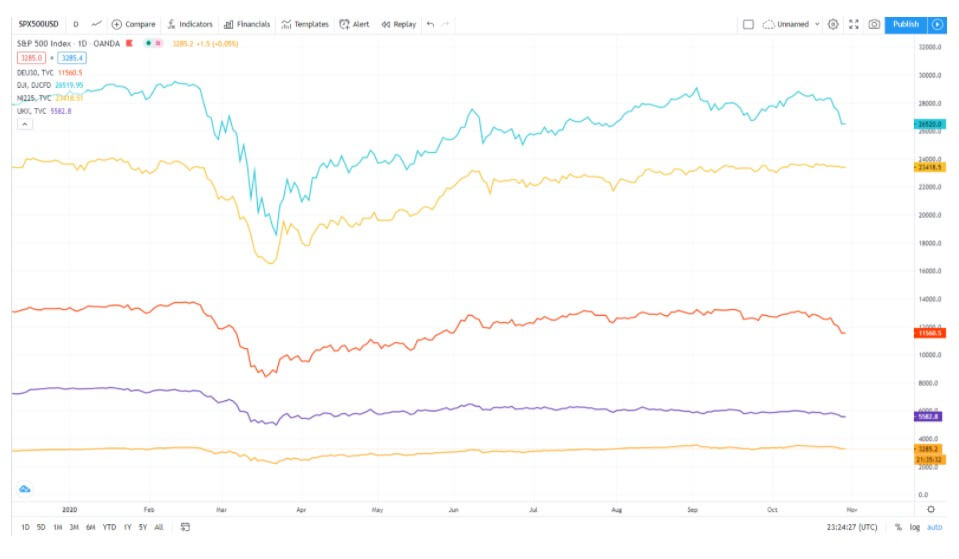
The S&P 500 (sky blue line) has exaggerated price action in this whole year outlook compared with the rest of the most popular indexes. Nikkei also has somewhat uncorrelated moves in certain places but overall positively correlated with the rest. Now, take a look at the weekly timeframe. 

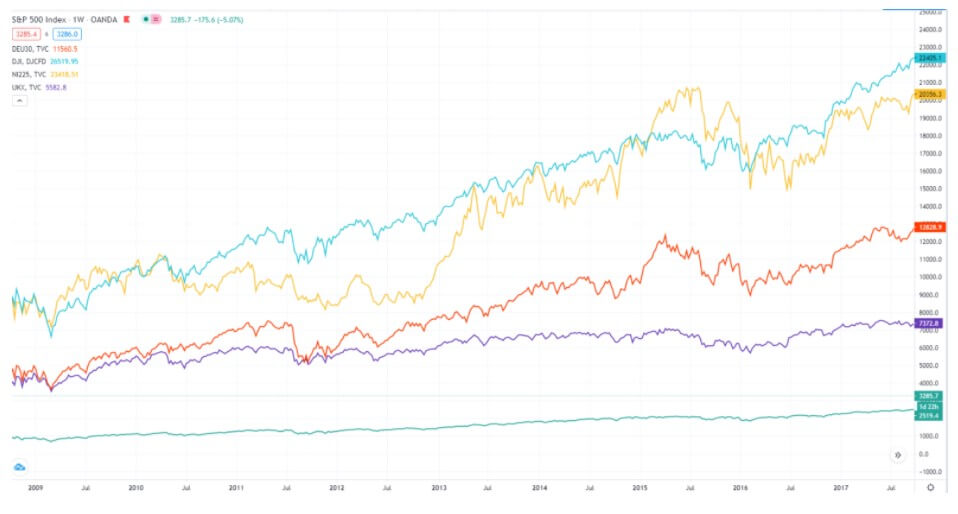
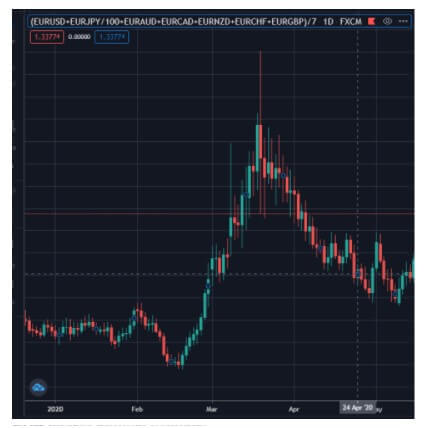
The zoomed out decade period shows completely different charts. At some points, we see a correlation, and then it is gone. Nikkei 225 (yellow line) is drastically different but all come into positive correlation during the COVID-19. 

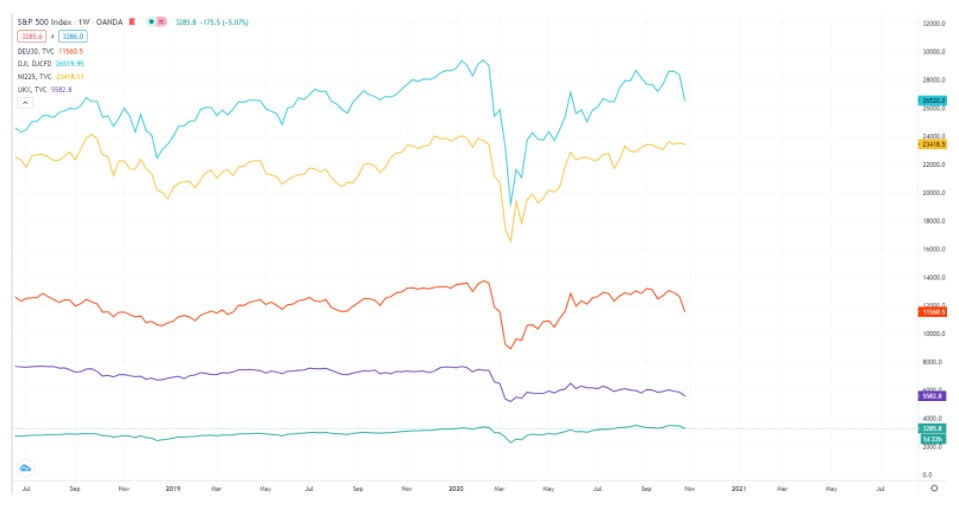
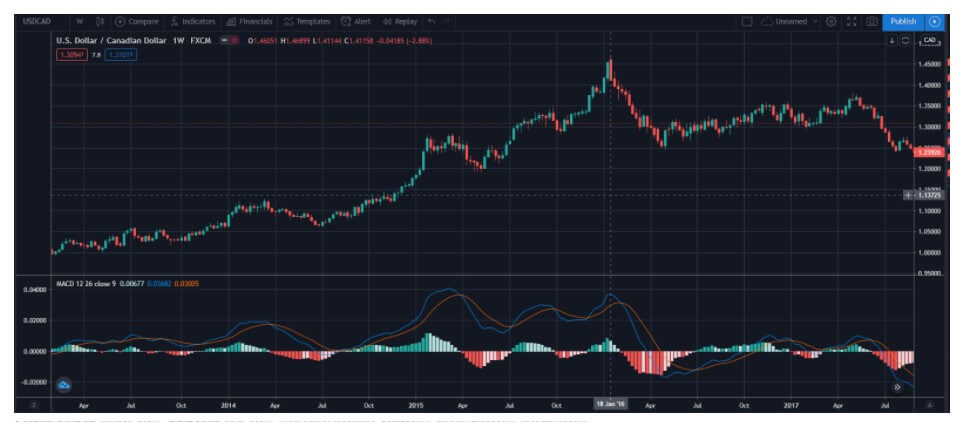
Nikkei 225 remains flat on this latest 2020 weekly time frame chart, even with a mild bullish sentiment in the last two months while S&P 500, DAX, and Dow Jones Industrial are starting to slope down. It is hard to use any correlation info to the actual trading, it is not consistent and traders know consistency is a must. Some might notice a tighter correlation between US-based indexes since they are measured in the same country. The most uncorrelated index is the Nikkei 225. Now, similarly to precious metals trading, you do not need to trade various indexes for diversification purposes, it is redundant as indexes can move in and out of sync. It is recommended to trade only two indexes, regardless if there is a correlation or not. As our prop traders say, less is more in this case, you do not get any special advantage by having positions in more than two. If you have a signal on two indexes, one from the US and the other from the EU, trade them both only if they are not correlated on a daily chart. If they are correlated, trade the one with smoother price action. By comparing the DAX and CAC you can notice DAX is more smooth, so it is an easy choice. 

Note indexes have different uptime, they close at different times too. So the daily chart, the easy-going trading routine only at the session end could be a bit shaken if you expand to trade indexes. Your trading routine would also need some adjustment if your lifestyle allows it. Know you will be in constant action, indexes move all the time because traders, institutions, and investors need to be active, their jobs demand it and their investors require gains. 

If you keep your trading scope to 4 indexes, 2 from the US and 2 from the EU, you may want to explore Asian markets, the Hang Seng index. This Hong Kong (HK50) index has very attractive price action for trend traders that developed systems according to our recommendations and structure. HK50 rarely has flat periods for more than a few days. HK 50 has many fundamental drivers and still, apart from elections events, you can ignore them all! If you stick to the daily and higher timeframes, just do what your system tells you, no need to look at the event calendars. Non-Farm payroll might affect an index from the US, but the trend will prevail with only one or two candles in the correction way after the event. Indexes have such drivers they do not react too much and the memory does not hold for long. 

On top of the HK50, you may go even further to the Australian index, also symbolized as AUS200 or ASX 200. This index has its specific price action and this is a good thing. It is not moving as the US and the EU indexes, therefore you can also pick one from other geographic markets. India 50 is another example of alternative markets you can trade when you need something uncorrelated. Just know the ATR values with these are extreme, in one day you can find candles that moved 7000 pips in one day. Make sure your money management is sound before trying. Some brokers do not offer less popular indexes so you may not find Taiwan MSCI and other alternatives. Make sure you find a good combination and limit your scope, keep it simple. Pick 3 or 4 different indexes, a couple from the US and EU, and one or two from Asia or Oceania. 

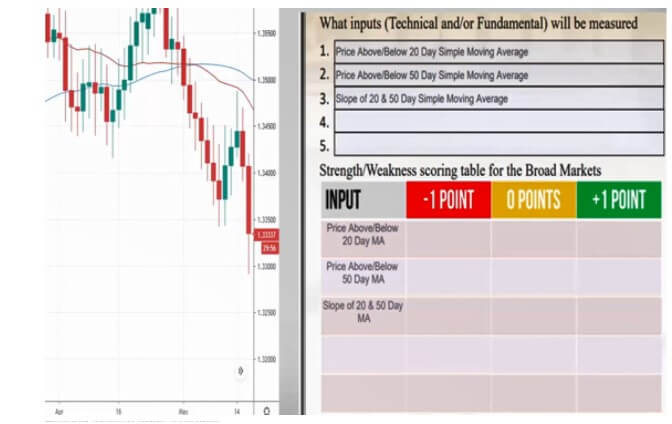
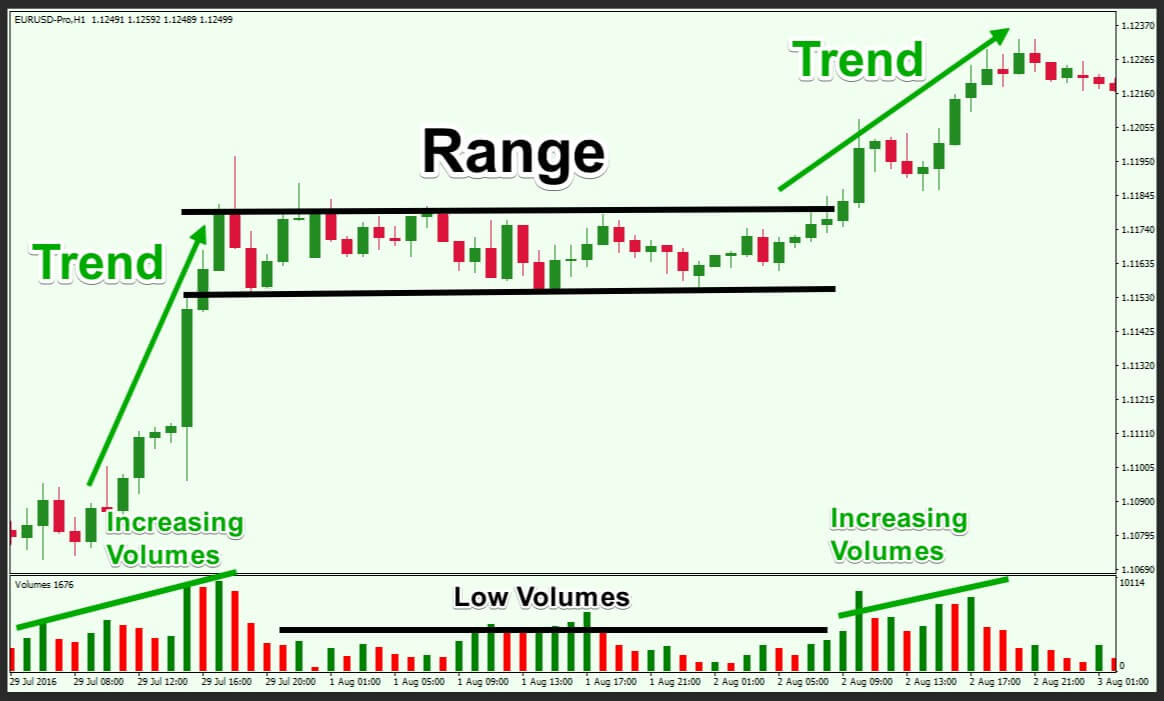
Finally, let’s see what you need to change with your technical algorithm. It should have 6 components as we have discussed before. Indexes move relentlessly, therefore the volume indicator is not needed here. Even when there is no general direction, it is short-lived. Choppy price action like with certain currency pairs is not going to be present with indexes, expect a lot of strong trends. As a result, you do not need any volume measures, trade indexes like you would Oil. To remind you, implement adequate confirmation indicators to indexes, as well as exit indicators, and eliminate the baseline element too. What you end up having is two confirmation indicators and one exit adequate for indexes, ATR (14) indicator if you need to calculate position sizes, Stop Loss and Take profit levels, nothing else. 

In conclusion, indexes are up for grabs since you know about forex trading. Carrying over that trading style to other markets is an easy process, yet you still have to do a lot of testing. The exact recommended levels for risk management can be modified if you feel you would have better results otherwise, make sure you know what you are doing, ATR values are extremely high here. If you are from the US, know there are many ways you can trade Indexes even if you do not have access to CFDs. Lastly, know you are going to apply your trading knowledge and quickly master new markets with it. You have a higher goal now and that is to add on consistent returns wherever you can, be it forex, precious metals, oil, or indexes.

Categories
Forex Assets Forex Basic Strategies

Apply These Secret Techniques to Improve Your Platinum Trading

Whenever you see marketing product bundling schemes they are commonly named by precious metals, starting from “silver package” up to gold and platinum as the top, most expensive offer. However, platinum is not the most expensive metal you can trade on the market, it is cheaper than gold and palladium. The price of an asset is not important to traders, they look into other important factors such as volatility, supply and demand, fundamentals, and policies.

We will approach palladium trading the same way we have described in previous articles. Note traders should be familiar with the system we use, although the analysis and opinion presented here can be useful for everyone interested in widening their opportunities and skills from forex to the precious metals market. All the adjustments we have made to our technical trading system for precious metals is already described, therefore, we will focus on the specifics of platinum. 

Platinum crossed paths with gold in 2011, to the point platinum is currently trading at $860 and gold at $1900 per troy ounce, it took only 9 years for gold to double. Before platinum was a more expensive metal. This shift has more to do with demand than with the supply of platinum. South Africa is the place where platinum is mined but actually, platinum can be considered as a by-product of gold, nickel, and some other metals mining process. It is like a metal that comes along with them, not primarily the goal of the mine opening, except in South Africa. The total platinum supply is extremely scarce compared to gold and silver, by far. A total of 8 million ounces are currently mined out from the earth, gold has 6 billion, and silver 3.5. If you are interested in investing in platinum, you will be a minority investor by choice. 

When we turn to demand, platinum is used in the industry, automotive, dental, medical appliances, and jewelry for making white gold alloy, even though pure platinum jewelry is not common. The primary platinum supply and projection for the next few years is in the picture below. 

As with gold and silver, platinum is also having a decreasing supply projection, creating a bullish sentiment. However, there is a twist to it. Platinum at the moment cannot be your ultimate hedge asset as gold and silver can be, despite its scarcity and decreasing supply. The fact that offsets platinum ability to be a metal to go in an economic crisis is the demand for it. In the picture below we can see the composition of platinum demand by sectors and the total demand.

Note the actual investing part of the demand, it was not present before 2007. Since inception as an investment metal platinum is not seen as the metal traders would choose, although long term investments are now held. Also, demand levels remain the same more or less, the automotive industry can be a factor, we have an increasing need for electric cars that also require platinum yet that also counters the need to make catalysts for combustion engines. Platinum is not bearish nor bullish here. It is extremely unlikely platinum is about to become a metal of choice before silver or gold, therefore the price does not move up or down dramatically as silver and gold. Can platinum be a hedge against other precious metals? Probably, diversification is an investor’s friend. Is it good to hold it long term? It is hard to know, there are no trends that could increase its demand.

The demand is the major factor of platinum price, supply is low and mining platinum is hardly going to get up, thus even a small demand increase will amplify the price move because of scarcity. If this ever happens because of the industry shift or a different perception of platinum, its price will catch up with silver and gold very quickly. An interesting fact about platinum is that there was almost no physical coins and bars to buy, gold and silver were dominant. Only in the last decade, you could see platinum coins and bars offered for investors, today they are not a rarity. Does this mean platinum needs more time before it is perceived as a good alternative to gold is yet to see. So the sentiment is neutral to bullish, we haven’t seen anything with platinum in the last decade as we have with gold and silver. 

Now, by looking at the technical analysis, gold, silver, and platinum charts have nothing in common. However, they could move in tandem or positive correlation. 

Gold (orange line), silver (gray line), and platinum (blue line) manifest similar patterns but platinum did it in its own way. The dips are more extreme and the tops are flatter. If we trade on a daily chart, you may not see the same price action. In the long term, you can with moderate precision tells platinum will follow gold and silver. A similar phenomenon is with cryptocurrencies. Still, platinum does not have a positive correlation on a daily and any other time frame where we invest for short-term trades. This is a great feature.

We do not have to worry about what gold and silver are doing. Platinum has its own vibe where it will move but will follow the major precious metals trend when zoomed out. Take any trend from gold or silver for the last month and you will see entry points are completely different and there might even be a counter-trend not present on the gold or silver chart. Go to the weekly chart and observe the same thing. Having a variation in the precious metals asset range benefits you so you can trade one when the other is consolidating and vice versa. Days, when the USD is driving the bus, will be manifested with positively correlated moves across all metals against the USD. Luckily, metals have their own way and they drive the bus most of the time. 

If you remember that we manage risk differently for gold and silver when we have the same trade signals not too far between, platinum does not need this measure. Trade full position sizes regardless of what gold and silver are doing. In some cases, you will even have opposite trend trades. Taking about pros, gold has its smooth movements, silver has its dramatic trends and platinum does not really care what the others are doing, you can trade it without fear even when signals are conflicting. According to some technical traders, platinum is performing better than the other two metals using the same system. So platinum may be an easy-going but faster performer, consequently, you will need to cope with somewhat erratic trends, they can appear out of nowhere and end suddenly. 

Wrapping it all up, platinum has unattached movements with the other precious metals but will correct at some point when we zoom out to see the bigger picture. Does this mean you can use this and buy or sell at a better price? Not really, you may often find platinum went the opposite way and trigger your stop loss before it is corrected. If you are an investor you could wait out for the correction, however, the price may not be any better. You may find it was simply better to trade platinum without any regard for correlations.

When the USD starts moving hard, you will see a positive correlation just by sheer dominance of the USD move, but metals are independent movers. Be aware of the interest rate events for the USD. A change will likely impact precious metals in the same direction. Your forex knowledge of how to manage trades before news events can be carried over here without any changes. Just be sure to follow fundamental changes for platinum and all other precious metals, especially if you are investing and applying a buy and hold (for a long time) strategy. The major shift from forex trading is this fundamental information, still, we use the same technical trading system. 


Categories
Forex Basic Strategies

When Is the Best Time to Use Trend Following Strategies? (The Answer May Shock You)

Trend following strategies are some of the most popular strategies around today, they have grown in popularity due to the increase in social media presence of some of the larger and most successful traders, these traders often use some form of trend following strategy that shows off large profitable trades. Something that a lot of newer traders want to be able to aim for.

There are also a large number of timeframes available to trade ranging from a one minute chart all the way up to a monthly chart where each candlestick is an entire month. So the question that we will be answering is which of these time frames would be best for a trend following strategy in order to try and emulate the trades and results of some of the most successful traders.

In order to answer that question, we first need to understand exactly what we mean by a chart timeframe. To put things simply, when you are looking at a chart, the candlestick chart, for instance, each candlestick will correspond to the timeframe of the chart, so on the one minute chart, a new candlestick will be made each minute on the 5-minute chart a new candlestick will be created every 5 minutes and so on all the way up to the monthly chart where a new candle will be created at the start of each month.

Each of these timeframes offers a lot of advantages and disadvantages depending on the strategy that you are using, and many strategies will require you to use multiple timeframes for the same strategy. The time frames are generally divided up into three different categories, the short-term timeframes which include the lowest timeframes for a minute up to several minutes. The medium-term timeframes work from around 10 minutes up to around an hour, and the long term trading time frames are often seen as an hour up. So let’s get into which ones will be best for a trend following strategy.

When looking at trend traders, a short term timeframe would last up to a week, a medium-term timeframe would last up to a few months and a long term timeframe could last up to a few years. Trend traders are looking for large movements that can last a long time, weeks to months at a time, so generally, they are looking for longer-term trades and long term timeframes.

If you were to try and trade a trend on a  small time frame, let’s take 5 minutes as an example, what information would you actually be able to see? Pretty much nothing that would relate to a trend, you would see the past hours movements which could simply be an up and down cycle, but if you can only see the past hour or so, then it may look like an upwards or downwards movement, but in reality, the markets could even be moving sideways, these lower time frames simply do not give you the scope to see what is actually going on long term in the markets.

Trend trading is one of the longer trading strategies in terms of the amount of time that you hold on to trades for and so one of the strategies where you need the higher timeframe on the charts too. Trading h trend basically means that you are looking for the overall movement of the markets and then try to trade along with the trend, coming out of your trade as the markets decide to reverse. Trend trading takes a lot of technical analysis to do properly, however, there is also an underlying issue of fundamentals to take into account.

Having said that, simply watching just the long term timeframes may not be enough for trend traders to be successful, you need to have a knowledge of all time frames in order to get the most information out of the markets as you can. Seeing a trend on the monthly chart is great, this is giving a good indication of the markets movements, however in order to work out the best point of interest, you may need to take a look at some of the lower time frames in order to work out what is happening on a more micro level. 

You also need to consider your own strategy, what size of trades are you putting on? If you are planning on trading the trend, then generally the trades will be smaller but held for much longer. If you try putting on large trades in order to follow the trend, you will be putting a lot of capital at risk on each trade. Remember, you are looking for huge movements in the markets, not just a little up or down, the larger the trade you put on the more risk you are putting too. So when using the higher time frames, ensure that you are scaling down your trade sizes too in order to ensure that your account will be able to handle holding on to those trades for extended periods of time, potentially weeks to months or even years.

So ultimately there isn’t a single best timeframe for trend trading, you will need to get a good understanding of a number of different timeframes. However, getting to grips with the longer time frames such as weekly and monthly will give you a much better overview of the current trends within the market compared to the smaller faster-paced timeframes. Do not be afraid to use the lower time frames to help with your conformations, just don’t use them as the basis for your entire trade.

Categories
Forex Basic Strategies

What Are the Best Forex Strategies of All Time?

It is not every day that you come across a strategy that has been used for many years, or at least not one that can be considered as a successful one. More often than not, a strategy will work for a short amount of time, maybe days, weeks, or months, but at some point in time, that strategy will stop working. Maybe the market conditions have changed, or maybe it was just luck to begin with. Whatever the reason, there is a good chance that without any changes or adaptations, a strategy will begin to struggle.

There are however a number of strategies, that at least a form of them has survived the dangers of time, they have been successfully used over a long period of time, years, in fact, there will need to be some adaptations as things change, but the principle behind them will remain the same. So let’s take a look at what some of these long-lasting strategies are, maybe one of them could be the right thing for you.

Support and Resistance Strategies

Support and resistance trading is one of the most widely used trading styles and strategies due to its simplicity and its ability to work in ranging markets, a condition that a lot of other strategies don’t work in. The strategy is pretty simple, you are looking at the support and resistance levels, they act as a block for the price, the market will be moving higher and lower between these markers, so as soon as it hits the lower support leave you will place a buy trade and as soon as it hits the higher resistance level you will place a sell trade. It is also one of the simplest strategies to chart, you can draw the lines based on previous prices and there are plenty of different indicators out there that will automatically do it for you too. 

The support and resistance levels can also be used to work out the current sentiment and trader preferences within the markets, as well as show you when to enter or not enter the markets. Having a good visual representation of when the markets change position and where it is reversing and bouncing between will give you a good idea of what the markets may do in order to help you analyse other potential strategies too.

Trend Trading Strategies

This is quite a simple strategy in the fact that you are there to trade the market trends, when the price is moving up you will buy and when the price is trading down you will sell, some people only like to buy and some only like to sell. The strategy simply requires you to identify which direction the market is moving in and then trade that same direction. The RSI indicator is a form of trend trading that has been used for a long time and will continue to be used for a long time to come. It’s very simple. When the RSI reaches above 70 or below 30 then it may represent a potential reversal. You will then set some take profit and stop losses at the support and resistance levels in order to close out the trades, this strategy can be incredibly rewarding and very simple to do, as long as the market conditions suit it though.

Fibonacci Trading Strategies

You may well have heard of Fibonacci at some point in your trading career, it is a well-known strategy and is based on a famous mathematician from Italy. This strategy is often seen as a medium to long-term strategy and it is used as a way of following the support and resistance levels that are repeating themselves. Markets are often trending and the Fibonacci style of trading does well in these sorts of trending markets. The trading system works by trading long (to buy) when the price retraces at the Fibonacci support levels when the markets are on the way up, and when the price retraces on a Fibonacci resistance level when the markets are going downwards. It can be a very reliable and profitable strategy, but it can take a bit of time to get used to.

Scalping Trading Strategies

Scalping is a type of trading that is growing in popularity, the idea of scalping is that you are looking for smaller trades, and lots of them in order to make your profits. The strategy aims to make little bits of profits from small changes in the price, both up or down. You are able to increase your profits by simply trading more and increasing the number of trades the account is taking. The lower the timeframe the more trades you will need to win, the higher the timeframe the less you will need to win in order to remain profitable. Successful scalpers will have much higher winning ratios of trades, the one benefit to scalping is that it can be profitable in ranging markets as well as trending ones, so if you get the hang of it, you will potentially be able to make money whatever the markets are doing.

Candlestick Trading Strategies

If you look at the person next to you, they will most likely have their charts set to candlestick mode, this is afterall by far the most popular style of trading chart. There are of course other styles of charts, but these candlestick charts offer a lot more ways to analyse the markets when compared to the others. Candlesticks basically show the price movement over a certain period of time, from a small time frame like 1 minute all the way up to monthly candles. They can be analysed to look at price movements, potential reversals, trends, and breakouts, they can be seen to demonstrate and indicate many different trading phenomena. Learning what the different candles mean can be extremely valuable to a trader and can be an opportunity to make a lot of profits if you are able to successfully read them.

So those are some of the different trading styles that you are able to use and that have withstood the test of time. All five of them have been used for many years and will continue to be used for many more to come, so if you are looking for a strategy that you can keep going for a long time, one of these five would be a good place for you to start.

Categories
Forex Basic Strategies

Check Out These Amazing Strategies for Students Trading with Low Capital

Let’s get one thing straight right off the bat, it is a pretty hard thing to be a trader and a student at the same time, you will be jumping to and from your studies and trading, and there is a good chance that one of them will start to take over the other, there are also plenty of different strategies available to trade, but some of them are not quite as easy to do when you have other commitments taking up a lot of your time. So we are going to be looking at some of the strategies that could work for you.

Of course, these same strategies can also be used if you are a full-time worker, as the shared responsibilities remain the same, the difference with a student is that you often also have a lower amount of capital available to trade, and so that is what we are going to be taking into consideration too.

As a student, you are probably strapped for cash, most of that is going on your rent, your foot, and your tuition, so if you are thinking of being a forex trader, then you are going to need a strategy that does not take a lot of money to do. This will throw a lot of strategies out of the window including things like swing trading, position trading, and trend trading. These strategies require you to hold on to trades for a long period of time and so would need the capital in order to do that, probably a little bit more than what you have at your disposal.

So what strategies can you use? Well the main two would be day trading and scalping, scalping takes the least amount of capital and also each trade takes the least amount of time, the problem with scalping is that you will most likely need to be there at the computer screen when reading. As a student, you most likely do not have as much time as you would like as you have your studies to do. So the scalping strategy, while cheap to use will require you to be there, taking you away from your studies, and you do not want to sacrifice your grades and results for trading.

So this leaves us with day trading, trades generally take between a few hours and a day in order to complete and these sorts of strategies will ensure that you close out the trades at the end of the day so as not to hold them overnight. This strategy does not require you to have a huge balance due to only holding them for the day, and the length of them means that you do not need to sit in front of the computer which is perfect as a student trader.

Probably the biggest issue that comes with being a student is not your time, but the amount of money that you have, being a student is expensive with the tuition fees and living costs, it doesn’t leave you with much. So you really need to make a decision before you even start trading, can you actually afford to trade? It’s a big question, if you are using money that you would have otherwise spent on food, then do not trade, if it is money that you would have just thrown away on a night out then go for it, ensure that you are only using money that you can afford to use. A lot of students jump into trading in the hope that they can make a quick buck or make enough to pay for their course, this is not always a realistic goal, get into it for the experience and any profits are simply a bonus.

Having said that, no strategy is good for a student if you do not have the right risk management plans in place. Risk management is there to protect you and your account and is even more important when you are thinking about trading with a lack of time and a lack of capital. This will include things like stop losses, take profits, a proper risk to reward ratio, and proper entry and exit requirements for your trade. When you start out trading you should have worked out what these are, however going in as a student will mean that you will need to be stricter and to adhere to them at all times, you may even need to adjust them to better suit the amount of time that you have and also the balance that you have.

You will find people all over the internet simply telling you that you should not be trading at the same time as being a student, but this is not the case at all. There is the opportunity for anyone to be a trader, all you need to do is to adapt the way that you trade to better meet your own personal requirements. Use proper risk management and choose a strategy that works for you. All of them could work, but it will be based on your current circumstances of time and money available. So do not be disheartened, as student trading may be a little slower and the gains a little lower, but you are learning and the markets are not going anywhere, so do not rush, take your time and build that foundation for being a successful trader.

Categories
Forex Basic Strategies

The Secrets Behind Successfully Playing the Percentages Game

The devil is in the details, they say, so sometimes it’s important to take a step back and look at the big picture – something that is surely as true in forex trading as it is in other aspects of your life. It just might be these details that allow you to succeed in profiting while playing the percentages game.

It doesn’t matter what kind of trader you are, whether you love Fibonacci or Japanese candlestick patterns or if you have concocted your own system; it doesn’t matter if you trade on the one-minute chart or the daily chart; it doesn’t even matter if you’re a chart watcher or if you log in for fifteen minutes every couple of days – in all these scenarios there is one rule that applies to everyone. And that rule is that you will win some trades and lose others.

High-Percentage Trading

So, if you’re smart enough to take a step back and look at the big picture, you will realize that the name of the game is minimizing your losses (and not just bad trades but how much you lose when you do lose) and maximizing your gains (making sure that when you do win, you win big enough to reliably and consistently make money from trading). Sure, that sounds simple enough doesn’t it? But let’s put it like this, say you make ten trades over a given period, and out of those ten, you win on six and lose four. Well, you’re winning more often than you’re losing but are your wins outweighing your losses? But how do you get that down to three losses out of ten and how do you make sure your losses are small while maximizing your wins? If you can work that out, it’ll set you apart from the hundreds of thousands or even millions of unsuccessful traders out there – that’s what sets the pros apart from the amateurs.

But here’s the catch. Every time you go into a trade, you are convinced it’s a good one. Even if you’ve done your homework, put in the research, done the technical analysis or even if you just have a great feeling about this one – you never know in advance which trades are going to be the losers. If you did, you wouldn’t enter them and you’d probably be a millionaire almost overnight. Let’s put it like this, if you ask any trader out there right now if they can win every trade they enter, they’re going to answer that, of course, you can’t. Nobody wins every trade. But then if you ask the same trader how they feel about the trade they’re currently in, they’ll tell you they’re sure this one will be a winner.

Beginner Woes

We’ve all been there when we started out. We’ve watched video tutorials, learned about a few basic indicators, picked out a strategy online and we think we’ve learned so much. But a little knowledge is a dangerous thing. In forex trading, it can be deadly. We jump in and we inevitably get burned. We didn’t understand risk, we didn’t understand how to manage our money, we probably didn’t even understand some elemental basics, like how you can get burned when the price gaps below your stop. We probably got caught up in our own emotions or the adrenaline kick of trading and we got humbled by our losses.

The forex markets are open 24 hours a day for five and a half days per week – that gives you a lot of time to show how little you know and how many mistakes you can make. In short, it’s a lot of time to make an idiot of yourself. You can easily start trading out of boredom. Lots of people become hooked on the adrenaline of trading and end up entering bad trades. Adrenaline is deadly for forex traders. You need to be in control of those impulses and watch out for those times when your brain is calling out for stimulus. Introverts have the opposite problem – they will spend all their time second-guessing every move. Probably to the point that they will miss a bunch of good trades (which doesn’t, by the way, guarantee that the trades they eventually enter will be winners).

There are so many common mistakes people make that it is worth listing a few of the main ones because some of you reading this will still be making them:

  • Trading without a plan and without knowing or assessing the risks before you enter a trade;
  • Breaking the rules of your plan (be careful with this one because, at the moment, your brain will be able to come up with any one of a million justifications that will seem sensible and rational at the time);
  • Getting attached to or over-focusing on one particular currency pair – sometimes when you think you’ve found a winning combination you stick with it well past its use-by date;
  • Staking more and more on the next trade in the hope that it will win big enough to recover your past mistakes;
  • Failing to incorporate lessons learned into your trading and repeating past mistakes.

Trading by the Numbers

And that’s the crux of high percentage trading. Every component of your system needs to be well designed so that every trade is well planned out to minimize the number of losing trades and, when those trades do crop up, to minimize how much they set you back. The flipside is that you are also working to ensure that when you do win, the wins are handsome enough to outweigh the winners. And this needs to be deliberate and systematic enough that you can rely on it almost automatically so that it overrules your own psychological and emotional state.

If you want to improve the winning percentage of your trades and apply a high-percentage trading strategy, there is really only one approach. You have to design your trading system in such a way to eliminate the mistakes and traps amateur traders fall into.

So, how do you do that?

You could do a survey of successful, experienced traders out there and ask them what are their top five strategies for improving the percentages of their trading. And you would get a bunch of different answers out there – from the psychological and philosophical to the technical and procedural. But every last one of them would have on their list some version of the below components. Every successful trading system will incorporate these four things to ensure it maximizes its wins and cuts back on losses: timing (when to trade and when not to); currency pair selection (knowing which pair to trade, when and why); trade management; and risk management. If your system incorporates these four things and does so in a rigorous, well-planned, thoroughly tested manner, you are well on your way to avoiding the pitfalls that burn so many amateur traders.

Timing

Planning your trades to coincide with those times when there are energy and movement in the market (and, conversely, avoiding those times when the market is flat) is one of the key skills in forex trading but also one of the most difficult to master.

It can’t be repeated enough that knowing when not to trade is just as important as knowing when to trade – also known as you can’t lose if you don’t play. When the market lacks strength and momentum for reliable trends to emerge, it is too random for consistent trading. In short, it is too unpredictable and you will get caught out without even knowing why it happened. Using a set of skills and tools that you have thoroughly tested in advance and that you know inside out is key to identifying those times when volume and volatility are on your side. And when they are not.

Even in a regular 24-hour cycle, there will be times when it is a good idea to trade and times when it is a bad idea. The world is a global place now and forex trading is a global activity. People who are just starting out are simply not tuned into this and think that the 24-hour cycle means that they can trade whenever is convenient for them. If you want to rise above that, at the very least you need to have these facts buried somewhere in your trading brain so that everything you do is done with an awareness of that. Because at certain times there will be a higher volume of trading and volume means liquidity.

With a higher level of liquidity, the market will be less erratic and more predictable. So you need to know which times of the day are better for volume and liquidity because those times will be your sweet spots for trading. The best of these are the overlaps between the sessions and, of those, the best one is easily the overlap between the European Session and the American session. That is usually the time of day at which the markets are most liquid because European markets are still open and American markets are just coming online.

Conversely, there are also times during a 24-hour cycle when it is a bad idea to trade. Think of these times as areas to avoid – almost at all costs – because the volume of trading will turn them into choppy and unpredictable nightmares. These times are the early and late Asian session, as well as the Sunday night session.

Of course, you’ve got to remember that these are low energy periods on an ordinary day. This could change if there is a significant news event that crops up during the run-in to these periods that turn up the volume on them because everybody jumps in to take advantage of the news that’s just been announced.

Which brings us neatly to the other critical item on your timing checklist: the news cycle. You need to get on top of the regular news cycle for the currencies you’re trading. This needs to become part of your trading day and part of your research and analysis. You can’t possibly account for unexpected news events – that’s why they’re unexpected – but you do need to be dialed into when the regular news events come around and have a good sense of how they’re going to affect the currency pairs you’re looking at.

These regular news events include announcements by central banks, national GDP reports, and other economic announcements by governments and the major financial institutions. The good thing with these kinds of news events is that there is a regularity to them, which means that you can go in and cross-reference past events with price movements. This is a useful activity to invest some time into because it will give you a better sense of how these announcements impact the markets so you can be better prepared for the next time they come around.

The best way to keep track of upcoming news events of this kind is to have a calendar set up with alerts giving you plenty of notice for each event. If you do this, you can update and modify this calendar as you incorporate new events and new currency pairs, which means it will evolve over time and become a better and better guide to timing your trading. The other thing to remember is that news events will affect the relationship between currency pairs, so if you are looking at, say, CAD vs. NZD, you need to be on top of the news events affecting both of these currencies. And in addition to that, you should probably keep an eye on USD and EUR news too because some of the bigger news events might ripple out to affect other currencies.

The final piece of the timing puzzle is a combination of discipline and psychology. If you know in advance that you are prone to idle chart-gazing, you might be one of those people who’s going to want to avoid being logged into your system during times when you know liquidity will be low. The danger you are trying to evade here is the temptation to trade out of pure boredom. You know it happens and it can happen to you. You stare at the screen, watching those little candlesticks take shape and your brain starts to convince you that a particular trade might be a good idea. This is the absolute worst thing you can do – as you well know – so a good way to cut down the chance of it happening at all is to help yourself exert some self-control by avoiding those times of day when you know trading volumes are going to be low.

Choosing Your Targets

Once you have organized your timing, built up a calendar of regular news events, worked it around your lifestyle and schedule, you are ready to start picking out what pairs to trade at any given time. Trading the correct pair of currencies at the correct time is a key way to improve your win/loss ratios. It can’t be overstated that the best pair to trade is where one currency is going up the most and the other is going down the most. If you’re focusing on a currency pair where both currencies are static, you’re doing it so wrong it is now time to go all the way back to the drawing board.

So part of your trading routine has to be identifying the relative strength and weakness of currency pairs during a given trading window. How often you go through this process is down to you and should be tailored to your specific trading style but we recommend that you go through this analysis at a minimum of twice a week. This will give you a watchlist of currencies to zero in on during the trading window and you can even set alerts for possible entry points.

The only thing you can base this on, ultimately, is how the currencies have performed over the recent period. There are no crystal balls so you will have to stay on top of the recent performance of the currencies you are trading and evaluate their relative strengths and weaknesses. One way of doing this is to look at currency baskets and apply that approach to your trading. You will need to be aware, however, of how these baskets are weighted because that will also affect the information they’re giving you. The most famous currency basket is, of course, the dollar index (USDX), which combines six of the majors and rates them against the dollar. But, you do need to know that the USDX is very heavily euro-weighted, with the other currencies very much taking a backseat. So, USD vs. CHF movements, for example, will not really affect the USDX since the Swiss franc is only weighted in at three and a half percent (the euro, by contrast, makes up around 58 percent of the index).

Once you have identified the currencies that you are confident will be relatively strongest and weakest during the trading window, you will have generated a watchlist to focus on. Combined with your trading schedule and news event calendar, you have now narrowed the field to a few currency pairs, and the times at which trading them will be optimal. This is already so many steps beyond how amateur traders approach trading and frees you up to concentrate your system on finding the right setup for these pairs.

Chart Setup

This is where the fun begins. You’ve invested your time into identifying when to trade those pairs that you have determined are going to be the strongest and weakest in relative terms, now it is time to put your technical analysis skills to work. Boiled down to its most fundamental meaning, technical analysis is the set of tools, indicators, and procedures you have developed to help you identify a trade entry point. This is the part most inexperienced traders jump straight into, completely ignoring everything else we’ve been discussing here. The area where beginners and amateurs tend to flounder is that they ignore the rules of their own setup.

A setup is, after all, basically a checklist of conditions that have to be met before you (and the system you have developed) say it is ok to trade. The reason you have a checklist in the first place is that you want to cut down on all those things that are going to lead you time and again into losing trades: guesswork, emotional responses, rash decisions. If you can eliminate these and instead follow a system that you have tested and tweaked over time and that you are confident will churn out a positive ratio of wins vs. losses, then you are well on your way to becoming a successful trader.

Conversely, you need to be able to stay in those trades that are going your way for as long as possible in order to make sure you are getting as much out of them as you can. This is trade management and it is crucial to your success as a trader.

Now, one way people maximize their profit while keeping their losses low is to use an automatic trailing stop that tracks behind the price by a set number of pips. This is a legitimate technique but you should also be aware of its drawbacks. The main one of which is that while the trailing stop will track the price as it trends in one direction, it will never track it in the other, which makes this whole approach vulnerable to pullbacks and could see you knocked out of a trade before it matures.

An alternative approach is to peg your stop/loss to an indicator that is going to see you through to the end of a whole price movement. For example, you could enter a trade and have your stop fixed at X pips from the trade entry point. You would then only move it up once the price has gone up X number of pips so that your new stop is at the break-even point. From here you could peg your stop to the parabolic SAR so that you move it up every time your indicator generates a new dot on your chart. If you’re in a reliable price trend, this method will see you through it to the point at which the SAR hits the price, which is the most likely endpoint for that movement.

Risk

Assessing whether the risk you are taking with a trade against the potential rewards you can reap is the final key component of high-percentage trading. You need to have a definitive plan in place to cut losing trades quickly and for an acceptable loss, while maximizing the profit you take from winners to ensure that your gains outweigh your losses. In short, if the rewards do not justify the risks, don’t trade.

But remember, staying out of those bad trades is just part of the equation. Go back to the ten trades we discussed earlier on in this article. Each time you trade you are only getting into those trades you think will work out for you, where you think you’ve done your homework to the best of your abilities and where you think you did everything right. But, as we know by now, some of them will fail and, going in, you have no idea which ones. So you need to have a plan in place to get your capital out on time and having lost as little of it as possible. 

Position sizing should also be something for which you have worked out and systematized to the point where you have a way of calculating the stake on each trade based on clear and detailed criteria. This is key to managing risk and is going to have an impact not only on each individual trade but on your whole portfolio.

One technique you can introduce to your approach to position sizing is scaling in. This is where you split your trade entry into stages, only committing part of your capital at each stage. Say, for example, you have a trade entry signal on a given currency pair. Rather than committing all of your capital in one go and hoping your stop doesn’t get blown out of the water, you could commit one-third of the amount you intended to risk on this trade and see how it performs. If it performs as predicted, you can then begin committing the remaining two thirds in separate installments. You can even go in with a slightly looser stop/loss order on that initial third, given that you are risking a smaller amount. This gives you a bit more leeway to see how the movement is going to pan out without your stop/loss getting crushed in a nasty pullback.

Whether you choose to scale in your trades or deploy any other position sizing technique, the name of the game here is to make sure you have a deliberate, well-planned approach to managing how you commit capital to your trades. Because risk management is not only about eliminating those trades you do lose, it’s also about making those losses acceptable.

Evolution

So the last thing to say is that you should never rest on your laurels. Yes, all of the components of high-percentage training that we talked about here are supremely important and yes you should incorporate them all into your system if you want to improve your trading outcomes. But even once you’ve done that you can’t expect to just sit back and reap the rewards. You need to use this as a springboard from which you will embark on a journey of constant progress. You will need to focus on your trading system and on yourself because that’s the key to evolving and becoming a better trader in the long-term.

So take this opportunity to build a trading system that incorporates all of the elements that were outlined here, build on it, develop it, research new tools, techniques, and indicators. Test them out individually and test out how they work when integrated into your system as a whole. Make sure that you test the historical validity of your system and all of its components but also plug it into a demo account and take it through a run of forward testing. As well as being the only way to ensure that everything works as you intended it to, testing can also do wonders for your confidence when entering into trades because you can feel that whatever the outcome, you have procedures in place to either minimize the loss or maximize win.

Categories
Forex Basic Strategies

The Sharpe Ratio Strategy That Very Few Traders Actually Know About

When we analyze and evaluate the performance of a financial asset or trading system, we usually focus on the profits that it produces over a period of time and forget about a no less important question: what is its associated risk? Undoubtedly we want to have a winning trading system, which generates profits, but we must not forget the star parameter: risk. As you know, there are enough ratios to measure our trading strategies, but in this article, we will discuss the Sharpe ratio at length. 

Ratio or Sharpe Coefficient

The Sharpe ratio was developed by Nobel laureate William Sharpe and is one of the most widely used ratios for evaluating and comparing financial assets or trading systems. To do this, it analyzes the return on an investment taking into account the risk of that investment, which allows us to determine if the profitability of our trading strategy is due to a really good system or, on the contrary, we have taken a lot of risks.

The calculation of the Sharpe ratio is quite simple and is defined as the annualised return of the trading system (fund, portfolio, etc.) minus the risk-free return and divided by standard deviation or standard deviation. The formula is as follows:

  • Sharpe ratio = (rp – rf) / σp

Where:

  • rp: average return on the financial asset.
  • rf: average return on a risk-free portfolio (risk-free return).
  • σp: standard deviation of portfolio profitability.

In case you have any doubt about these three parameters, here is a simple way:

The average return on the asset: is the expected return on the asset in the selected period, which can be a year, a month, or a day.

Risk-free yield: these are the short-term public debt obligations (bonds, treasury bills, etc.) of a geographical area similar to that of the asset we wish to assess. This is the minimum return an investor can obtain in the market.

Standard deviation. In short, the standard or standard deviation measures as soon as returns deviate from their average.

Interpreting the Sharpe Ratio

As I have already mentioned in other posts, the most important thing when we use statistical metrics to evaluate a trading strategy is the correct interpretation and understanding of the values obtained. Basically, the value of this ratio can be classified into three possible scenarios:

Ideally, the value of the Sharpe ratio should be equal to or greater than 1. The higher the Sharpe ratio, the better the return relative to the risk assumed when making the investment.

If the value is between 0 and 1, the strategy is not optimal, but it could be used.

If the Sharpe ratio is less than 0, we should not use the strategy or portfolio we are evaluating. The negative Sharpe ratio means that the risk-free asset is more profitable than the risk-bearing asset.

In addition to interpreting the numerical value of this ratio, the Sharpe coefficient allows us to:

  • Compare the risk-benefit ratio between different investment opportunities.
  • Select the most attractive strategy from the point of view of risk, with the same performance.

Disadvantages or Limitations of the Sharpe Ratio

As I told you before, there are no perfect metrics and each has its limitations. In this sense, the Sharpe ratio is no exception and among the main disadvantages you can mention are the following:

  • Does not distinguish between consecutive losses and intermittent losses.
  • The Sharpe ratio does not depend on the order of the sample and it is not the same to lose 10 consecutive times as alternately.

So that you understand better, I will explain with an example:

Suppose we evaluate two strategies during a year, both strategies had 6 months of profits and 6 months of losses. Strategy A had alternating gains while strategy B had 6 months of losses and then 6 months of gain, as shown below.

If we analyze both systems, we see that the two have the same mean benefit and the same standard deviation, therefore, the same simplified Sharpe ratio. But if we look at the cumulative profit graph, it’s not hard to realize that strategy A has a more regular or stable cumulative profit curve than strategy B, I would therefore choose to select strategy A over strategy B despite having the same Sharpe coefficient.

Another weakness of using the Sharpe ratio is that when we use the standard deviation of profitability to calculate risk, there is no difference between bullish or bearish volatility. The volatility of a trading strategy allows us to measure or predict the performance of that strategy. So the more volatility the expected returns will be more inconsistent.

Sharpe’s ratio is very useful only when compared to another trading or investment strategy. Let’s look at an example for you to understand me better: Suppose we evaluate a strategy or portfolio and the Sharpe ratio is equal to 1, this value is pretty good. We now evaluate a second portfolio and its Sharpe ratio is equal to 3.5. Although the first strategy has a good Sharpe ratio, the second strategy has a better ratio and this makes it more attractive to choose some of them on equal terms

Simplified Sharpe Ratio

Many times instead of using the Sharpe ratio, according to the formula I described above, it is common to use a simpler version known as the simplified Sharpe ratio. The formula for its calculation is as follows:

Simplified Sharpe ratio = mathematical hope/ standard deviation.

Because Mathematical Hope can be interpreted as the mean profit (net profit / total number of operations), then we can rewrite the formula as follows:

Simplified Sharpe Ratio = Average Benefit / Standard Deviation

Example of an evaluation of a strategy using the Sharpe ratio:

Suppose we have an investment strategy A, which has an annual return of 16% with a standard deviation of 9%. In addition, We have another investment strategy B with an annual return of 9% and a standard deviation of 3%. The risk-free return benchmark for these strategies will be Treasury bonds that have a return of 1%.

If we look only at the returns, it is very easy to see that strategy A is better than strategy B. However, we do not know the risks we have taken in strategy A to get that return. That is why we need to adjust profitability to risk and thus determine which strategy actually achieved the best return. We did this using the Sharpe ratio.

Let’s calculate the Sharpe ratio for strategy A:

Sharpe ratio = (rp – rf) / σp = (16 – 1) / 9 = 1.67

Let’s calculate the Sharpe ratio for strategy A:

Sharpe ratio = (rp – rf) / σp = (9 – 1) / 3 = 2.67

If we analyze the results, we realize that, according to the Sharpe ratio, the strategy that achieved the best return according to the risk assumed, was strategy B. For this reason, We must not always let ourselves be dazzled by the performance of a strategy; we must look at it from different points of view.

Conclusion: Is it Useful?

Finally, we can say that the Sharpe ratio can be used when we want to know the risk assumed when executing a certain strategy or investment, indicating whether the return obtained is due to an excess of risk. To get to the point, it allows us to compare the effectiveness of strategies.

If we are evaluating two trading strategies, the one with the highest Sharpe ratio is the best because it has a lower risk associated. The value of the Sharpe ratio of a strategy in itself is not so important, what matters is its comparison with the value of the ratio of other strategies.

As I have mentioned in other posts, I do not recommend that you base your trading decisions on the results of a single indicator or metric and the Sharpe ratio is no exception, do not use it alone. I personally consider that the Sharpe ratio is nowhere near the best trading measures you can take into account. For example, if you apply a system with lower stop loss and take profit compared to larger ones, the ratio will benefit the former, even if the latter has better statistics.

In addition, the issue of not taking into account positive volatility is a big point against. Having the same weight in positive and negative positions is a great limitation. We need realistic measures and a good X-ray of our trading. Which ones?

And one more thing, when comparing different strategies or portfolios keep in mind that these portfolios belong to exactly the same category, not make sense to compare radically different portfolios where it is more than evident the risks associated with each portfolio or strategy.

Categories
Forex Basic Strategies

FX Strategy Selection Is Everything: Here’s How to Choose Wisely…

Are you a new trader that’s still trying to figure out which strategy will work best for you? Or perhaps you’ve been trying something that just isn’t working well and you’re looking for a strategy that works better with your own personal trading style. Below, we will outline some of the most popular trading strategies, along with their pros and cons to help inspire any trader that needs to switch up their strategy. In this article, we will talk about the following strategies:

  • Price action trading
  • Range trading
  • Trend trading
  • Position trading
  • Day trading
  • Scalping
  • Swing Trading

First, you’ll need to understand that each strategy is unique in its own way. Some strategies require more of a time investment, while others won’t require as much time in front of your computer. You’ll also find more trading opportunities and different risk to reward ratios, depending on the strategy you choose. 

Price Action Trading

Traders that use this strategy typically look at historical price data on charts in order to form more technical trading strategies. In some cases, traders look at fundamentals like economic events, but they usually stick with historical data. The technique can be used alone or in combination with indicators. Traders use Fibonacci retracement, candle wicks, indicators, trend identification, and oscillators in order to define support/resistance levels for entry and exit points when using this strategy. One of the benefits of using this strategy is that it can be incorporated over short, medium, or long-term time periods, and several other options on our list fit within this category. 

Range Trading

Range trading traditionally uses technical analysis in order to define support and resistance levels that inform traders where to enter and exit trades. Traders often use oscillators in combination with this strategy, with RSI, CCI, and stochastics being the most popular choices. This is yet another method that can work with any time frame, but it does require a lengthy time investment per trade. There are some things to look out for, as the strategy is most successful when the market is calm with no detectable trend and it is very important to have a strong risk-management plan in case breakouts occur. On the bright side, there are many trading opportunities and there is a good risk-to-reward ratio with range trading.

Trend Trading

Trend trading is considered a simpler trading strategy with the goal of making profits by exploiting the market’s directional momentum. Traders using this strategy calculate their entry points using oscillators, while exit points are based on the risk to reward ratio. Multiple timeframes can be used, although this strategy most commonly used medium to long-term timeframes. 

Position Trading 

Position trading mainly focuses on fundamental factors and especially economic circumstances without paying attention to minor market fluctuations. This is a long-term strategy that judges entry and exit points based on technical analysis and other strategies. 

Day Trading

This popular strategy involves opening and closing one or more trades within the same trading day, making it a short-term strategy in which trades are opened from minutes to hours within the same day. Traders use different means to determine entry and exit points when using this strategy.

Scalping

Scalpers try to profit from small price changes by placing multiple positions per day. This short-term strategy prefers more liquid forex pairs because they generally come with tighter spreads. Scalpers define entry and exit points by defining the trend, often in addition to using indicators and oscillators.

Swing Trading 

Swing traders hold positions anywhere from a few hours to a few days while attempting to profit from trending markets and range bound. Traders typically favor long-term trends as they provide more of an opportunity to capitalize. Once again, indicators and oscillators are primarily used to calculate entry and exit points.

Categories
Forex Basic Strategies

This Momentum Strategy Is Nothing Short of Amazing

Momentum is hard to catch. It’s like when you want to go to a party, you arrive and you see a queue of people to get in, you think the party must be great and you pay a pretty expensive entrance to get through. Then you come in, you order a drink and three minutes later the music stops and the party’s over. And there you are, looking silly, seeing how many have had a very “good time” but finding that you’ve missed it.

With a momentum strategy, if you don’t manage it well, it’s pretty much the same. You enter the market with expensive prices and a stop-loss that is far away so that a few candles after the supposed trend is over. Then, in this article we will analyze this type of strategies, to be able to adjust our radar better and thus take advantage of the party as long as possible.

What Is a Momentum Strategy?

A momentum strategy is part of the set of trend strategies. Following a momentum strategy is basically investing (taking long positions) in those financial assets that are showing a clear increase in their price. Those assets that are strongly bullish are bought in hopes that this bullish fortress will continue. In momentum strategies, the strength of movement is the key.

When to Choose a Momentum Strategy

The theory is that all assets have their momentum, you just have to know how to catch it in time. Following the simile of the party, in a city there are several discotheques, but curiously there are only some that – for various reasons- are fashionable and is where there are more people. The fashionable discos take turns, the one that was fashionable last summer, this one is no longer fashionable, but maybe it will be fashionable again in three years. The idea is to be able to find out what the reasons are that make a disco fashionable, or that a financial asset begins to rise so that they can enter in time.

Similarly, going back to the world of investment, we can see that momentum is not a permanent effect. Its duration is limited in time. This forces us to evaluate and alternate the elements of a momentum portfolio on a regular basis.

Absolute Momentum and Relative Momentum

If you analyze the momentum you can distinguish two situations. On the one hand, we have the impulse of the asset for itself ( time-series momentum), and on the opposite side, the impulse of the asset with respect to other values ( relative momentum).

Time-Series Momentum: Autocorrelation in Time Series

The autocorrelation level in an asset tells us if its past and future profitability are correlated. Put simply: the idea is that today’s profitability is related to yesterday’s profitability. In this case, if the degree of autocorrelation is high, it can be interpreted that we can estimate future performance.

Cross-Sectional Momentum or Relative Momentum

In this case, what counts is the profitability plus when we compare different assets. The idea is that those shares or assets that have a higher relative return continue to maintain this advantage over time.

One type of momentum is independent of the other. We can find that an asset shows a positive relative momentum (it is stronger than the others), but nevertheless has an absolute negative momentum (it is in a bearish trend). Conversely, you can also give an asset a positive absolute momentum but still have a negative relative momentum as there are other assets that are rising even further.

How to Measure Momentum?

Do not confuse a momentum strategy with the Momentum indicator. You can use the Momentum indicator to follow a momentum strategy, but you can also use other indicators of technical analysis (such as RSI, ROC, moving averages, etc.) or directly the price analysis.

The Momentum Indicator

This indicator simply shows the price difference between the current candle and the N candle days ago. The value of the Momentum indicator is expressed in absolute terms ( how many € or USD of difference in the quotation). If you prefer to express this difference in relative terms, then use the ROC ( Rate of Change).

The graphical representation of the Momentum indicator is an oscillator that fluctuates around a 0-neutral line. In technical analysis, attention is often paid to the oscillator crossings with line 0 and to the divergences between the Momentum oscillator and the price.

Momentum Strategy Values

In general, a momentum strategy will have good results in assets showing trend behavior. For example raw materials, some currencies, low capitalization stocks… According to some studies, the momentum has a longer duration and impact on those actions with lower capitalization and a lower BTM ratio ( book to market).

One way to know if an asset has a trending behavior, and then it might be a good idea to apply a momentum strategy, is to do the test that is detailed in this entry “Tendencial or antitendential system Which one to choose? “

Advantages and Disadvantages of a Momentum Strategy

Momentum is not a permanent effect. It’s not some kind of “buy and hold” strategy. We have to assess the assets on a recurring basis and if necessary modify the items we have in the portfolio.

  • Consequence 1: It is a strategy that needs regular attention.
  • Consequence 2: Attention to commissions according to the broker you work with.

In the case of following a momentum strategy with actions, the key is in diversification and in managing the risk of each position (as an example you can see this Momentum System for trading with actions). You don’t have stable returns. Investing in momentum is a long-term strategy. In some years it works and in others, it doesn’t.

Examples of Momentum Strategies

A simple example is to use the RSI – relative strength index – to signal inputs and outputs. Now we see that the purchase is made at the time the RSI is greater than 70 and the position is closed when the RSI is less than 30.

This other strategy applies the logic of momentum to commodity futures, rebalancing the portfolio of futures once a month: Momentum Effect in Commodities. Use momentum indicator crosses: Purchase order when the momentum indicator cuts up the 0 line and sale when the indicator cuts down. Strategies of “Dual momentum” where the absolute moment is combined with the relative one.

How? in this case it is started by using a relative momentum strategy while avoiding assets with negative absolute return (comparing the difference in return of the asset with respect to short-term bonds).

Categories
Forex Basic Strategies

Apply These Special Techniques to Trade Reverse Splits

In the financial markets and in the stock market, there are different ways in which companies can manipulate their stock prices, including the reverse split of shares. Manipulation is not always bad. Sometimes, a company has legitimate reasons to change the price of its shares. But that’s not the case when what we’re dealing with is a reverse split in the world of penny stocks.

In fact, for me, it is not excessively important if a company manipulates their actions. Splits aren’t always bad, it depends on the company and why it’s doing it. However, I think it is wise to know well what a reverse split means does and why most penny stocks do it. So, let’s dig deeper into the reverse split of actions. We’ll look at some examples and look at whether they’re good or bad.

What is a Reverse Split?

A reverse split happens at the moment that a company decreases its share amount at the same time that increases the price of the same. A company cannot magically increase the price of its shares, this phenomenon is due to reverse split. Therefore, you have to “get rid” of the stocks to increase their price. As you see, they are simple mathematics.

It seems harder than it really is. Technically, the company doesn’t dispose of the stock, it just combines the existing stock. I’ll tell you what it means later. What does a reverse split mean for an investor? We need to keep in mind that traders and investors have different approaches to seeing markets.

Investors hold equity positions for an extended period of time, usually to obtain a slow and steady profit. Traders, on the other hand, enter and exit the positions of relatively fast action, for potentially faster profits. I have no mania for investors, but investing in the fraudulent stock companies I usually operate in is a very risky gamble.

I make this claim because many times, split is mainly applied to penny stocks. A large company with a price of $100 per share will normally not split: the price of its shares is probably already good. Technically, a reverse split means nothing to an investor: consider the keyword “technically”. I’ll talk about whether a reverse split is good or bad for a company’s shareholders in a short time, but first I wish to clarify something else.

Reverse split basically means nothing to an investor because the value of their position in the company does not change. It simply means owning fewer shares at a higher price. Is a reverse split good or bad for shareholders? Just because a reverse split is not significant to an investor doesn’t mean it’s a good thing. In fact, it’s usually bad news. That may sound confusing, so I’ll look at it. I’ve seen toxic companies do reverse splits for over 20 years. And it usually doesn’t end well.

Why? The reasons for the split must be analysed or divided. A large and reputable company with a stock price of $100 per share is probably financially stable. But a penny stock at a price of 50 cents a share probably isn’t as financially stable. In fact, the company may need to raise money through public offerings. But penny stock bids are often toxic and almost always end horribly badly.

Institutional investors do not want to invest in a company with a low share price with tons of negotiable shares, making it difficult for their investment to make money. Therefore, a company can make a reverse split to look more attractive to potential investors. It reduces the number of shares and increases the price, which greatly facilitates public offers. Public offers dilute the company’s shares and make the company less valuable over time. Reverse splits can be a way for a scam company to hide how toxic it is, usually, is a bad sign for the average shareholder.

How does a reverse split work? Let’s look at a super basic example:

Let’s say Company A has a share worth $100. Since the price of your stock is $100 and you only have one share, the company is worth $100. The total value of a company is usually based on the price of its shares and the stock count. This is known as market capitalization, about which you can read more here.

We have Company B with 10 shares, each stock with a price of $10. That company also has a value of $100. Therefore, the two companies have the same economic value., but their stock prices are different. If Company B wants to increase the price of its shares, it could do a reverse split. But this does not increase the value of the company.

It simply means that the company’s share price is higher. So, if Company B wants the price of its stock to be $100 per share, it would merge the existing 10 shares into a single share now worth $100. Of course, a company cannot simply split up. It has to be managed by its investors who have to approve the split.

Impact on the Reverse Split Market

I’m gonna say it again. A reverse split does not affect the valuation of the company. There is no technical impact on the market for a reverse split of shares in terms of the value of the company. By this, we do not mean that affects shareholders in a long term. The market impact of a stock reverse split is that it reduces the number of marketable shares of the company by combining multiple shares into one. This allows a company that decides to do a reverse split only with the intention of doing something nice skewed things.

Companies that do reverse splits have more capacity to participate in toxic financing, which can be extremely bad for shareholders. Again, this is only if the company decides to participate in toxic financing such as offers in the market. The fact that a company carries out a reverse split of shares does not necessarily mean that it will get involved in toxic financing. But from what I’ve seen in the last 20 years, a lot of them do. But unless the company becomes involved in toxic financing, there is no real impact on the market of a reverse split of shares.

Why Companies Do Reverse Splits

The inverse spits are fundamentally a remedy designed for companies to increase the price of their shares and try to attract investors. Sometimes it’s a way for companies to remain listed on a larger stock exchange.

This is another reason why reverse divisions can be bad news for shareholders. But really, if a company is doing a division to stay on the list, it already had clear problems before the division.

An example. A requirement to stay on Nasdaq’s list is that the price of the company’s shares must be above $1. In a letter from the SEC to Accentia Biopharma, (NASDAQ: ABPI) on the price of its shares in 2008: 

“Market Rule 4310(c)(8)(E) states that Nasdaq may, at its discretion, require an issuer to maintain a price of at least $1.00 per share for a period exceeding ten business days in a sequential manner but normally not more than 20 business days in a row, before determining that the issuer has demonstrated a capacity to maintain long-term compliance”

This is part of the warning that the SEC issued to ABPI about keeping the price of its shares above $1 per share. If ABPI did not comply, it would be removed from Nasdaq. It was finally removed from the list. When companies receive such letters, they usually do a reverse split in order to comply with the requirement.

Do you see why reverse divisions are usually bad news for long-term investors? It may indicate the long-term failure of a company to consistently meet the quotation requirements of a major market, which is not good.

Calculator of a Reverse Split

So, you know a little bit more about reverse splits and what they mean, now I want to help you understand and show you what the calculus for the price of recent reverse split shares. It’s actually quite simple. When a company announces that it will do a reverse split, it also has to announce what that division number will be. Here is another theoretical example. The same concept applies to a real action that makes this type of division and we will cover some real examples later.

Let’s say Company A announces a reverse split of 1:10.

This means that 10 shares held by a shareholder-owned before the split, they will now have one.

Now, suppose Company A had a 50-cent share price before the split. To find out the share price after the split, simply multiply the share price by 10. In this case, an inverse division of 1:10 would mean that Company A would then be traded at $5 per share.

Most stock prices will not be so simple: the price obviously will not always be a round number. In addition, each division is different. Some companies only do a reverse split 1:2, while others can do 1:30 or even 1:50.

In any case, just take the last number of the ratio and multiply it by the share price to find the price per share after the split of the company.

Examples of a Reverse Split

Let’s look at some real examples…

Many penny stocks do a reverse split at some point. Not all but many do.

Pro tip: Know how to calculate a reverse split.

Reverse share divisions can influence stock prices after the split.

Again, the division does not change the value of the company, but it may highlight any reasons of interest to the company. The main question right now would be, how can we find information about reverse splits or other relevant news in the stock world? Use a filter like StocksToTrade. Its new Breaking News feature alerts operators to the latest news, such as reverse splits.

Now, let’s look at some examples of reverse splits.

XpresSpa Group, Inc (NASDAQ: XPSA)

The reverse split of this action took place on June 11, 2020. I completely don’t know why XSPA made the decision to make a stock reverse split, and I won’t waste my time researching right now. If the action leaves good news and comes into play, that’s what I really care about.

Sonnet BioTherapeutics Holdings, Inc. (NASDAQ: SONN)

This reverse split of shares occurred on April 2, 2020. It was actually a 1:26 split: 26 actions of action before division became an action after division. That’s a pretty big jump. Think how a few days after the reverse split, the shares had a giant volume and had a massive move of around $16. This is quite common with the reverse split but does not mean that it always happens.

Remember, many fraudulent companies use reverse split as a way to participate in toxic funding. That usually means they will increase the price of their shares to raise money. That is usually clear from the candle on the daily chart. In the case of SONN, it peaked at over $16 the day news came out, before falling below $10. It would not be strange if SONN had released many of his actions in that movement.

Cyclacel Pharmaceuticals, Inc. (NASDAQ: CYCC)

This action was split on April 15, 2020, only a few days before its massive execution to approximately $19 per share. But like SONN, CYCC seems to have been involved in some toxic funding. Watch carefully the candle that corresponds to the day of its execution. The great wick shows how high it arrived before falling to new lows in the day.

Most likely, CYCC had shares it wanted to release, so it released a juicy press release to generate some enthusiasm. This is an added reason why you should not believe the hype that some news has.

It’s okay to operate on these moves, don’t get me wrong. But many of these companies launch news to raise their short-term stock prices. That is why it is advisable to get in and out of these operations quickly.

Categories
Forex Basic Strategies

The Secret Formula for Successful Trend Trading

Why do trends work? The momentum-or inertia of prices to move in the same previous direction beyond what we might expect from a random path-is the oldest, most intense, persistent, and ubiquitous investment factor of all the discoveries and analyses to date.

Why do trends work? It is the oldest, most intense, persistent, and ubiquitous investment factor of all discovered. However, empirical evidence alone does not guarantee that this or that anomaly will continue to manifest in the future. As we saw earlier here, in emerging phenomena produced by human actions such as economics and markets, empirical evidence is never enough and we need to know and understand why things happen. We then ask ourselves a few key questions:

  • Why does this phenomenon occur in all markets and at all times?
  • Why does this phenomenon occur in all markets and at all times?
  • And most importantly when it is actually used to invest our money: will inertial prices continue to show in the future?

Understanding how and why price inertia is generated is essential because if the reasons behind it are inevitable, then inertia will also inevitably persist in the future and we can use it as a tool to invest. The good news is that there are at least three reasons for this inertia to occur, to last, and ultimately to be an inevitable phenomenon such as the existence of economic cycles:

Why Do Trends Work? Structural Reasons for the Collective Investment Industry

Most institutional investors responsible for funds or investment portfolios have to comply by law with pre-established market risk limits in their prospectuses. This forces them to reduce their exposure to those assets whose risk (usually measured by their volatility and/or VaR) is growing. I mean, to sell when volatility goes up. By complying with the legislation, their sales help the formation and continuity of bearish trends. On the contrary, a decrease in risk (a drop in volatility) leads them to buy more, in turn fueling the upward trends in assets that are rising in price.

But it is not only the regulatory control of risk that feeds trends. The professional managers, on a personal level, are prisoners of the benchmark that their funds try to overcome (without hardy success, as the works of Pablo Fernández and the SPIVA reports demonstrate), so they cannot “stay out” of the bullish movements. If you don’t buy the assets that are coming up and sell them when they go down (even if you don’t know why or disagree with the reasons for the move), you run the risk of walking away from your benchmark and getting fired. The fear of losing their jobs translates into feeding, to a greater or lesser degree according to their independence to the benchmark, bullish and bearish tendencies when they appear. As I have repeated on other occasions, the professional managers of large firms do not manage the money of their clients, but their professional survival.

The professional managers of large companies do not manage the money of their clients, but their professional survival. In addition, when a fund is surpassing its benchmark, it draws the attention of media and investors and attracts new subscriptions, which have to be invested in those assets in which the fund is already invested, further fueling previous upward trends. The same is true of those funds that are falling in the ranking behind the benchmark: they suffer refunds that force them to sell and thus feed the bearish tendencies.

In short, there are strong incentives for institutional actors to do what others do. That is, it is the very idiosyncrasy of the management industry (investment and pension funds, large insurers, etc.), coupled with the incentives of their own professionals, This obliges the major players who provide the bulk of the volume to the markets to align with the trends and to feed them inevitably. There are strong incentives for institutional actors to do what others do.

As we see, both legislation and the incentive structure in the industry should change radically so that this reason would lose influence on price formation and its inertia.

Why Do Trends Work? Macroeconomic Reasons

Regardless of the structural reasons for the industry we have just seen, the existence of economic cycles causes some assets to behave better or worse than others for long periods of time.

Each state of the cycle or combination of states-expansion, recession, inflation, and deflation-generates different underlying dynamics in the economy, causing some types of assets to revalue more than others in different periods. Depending on the time of the cycle in which the economy is polarized, there are therefore trends of several years usually called bullish or bearish markets (secular bull/bear markets). For example, during periods of economic expansion, which can last from one to twelve years (we have 10 years with the current one), the stock market as an asset is revalued more than the rest of the assets (as a manifestation derived from the economic boom itself), unlike during economic recessions. These secular trends are also unavoidable and exploited by some inertia strategies that focus on the long term of economic cycles.

In order for this phenomenon to cease to occur, economic cycles should die out, which is impossible due to the inevitable emergence and spread of imbalances throughout the economy, or at least the connection between the behaviour of certain assets and the phase of the cycle should disappear. However, it is precisely through objective observation of the prices of certain assets that we can measure with some precision the stage of the cycle in which the economy finds itself.

Why Do Trends Work? Behavioral Reasons (Biological and Evolutionary)

Why do trends work? The pervasiveness of fear and greed in financial markets is evident to anyone with a modicum of investment experience, as ultimately markets are made by people.

Everything that is developing in the world, at any time, resemble precedent. This depends on the fact that being works of men, always having the same passions, by necessity they must produce the same effects. -Machiavelli, Speeches (Book III, Chapter 43)

The human being is gregarious and fickle by nature. What costs you the most, especially when it comes to investing, is to be consistent and faithful to your principles and strategies. At the moment when the price of a certain asset begins to rise significantly, it becomes the topic of fashion, narratives are built to justify it and attract the attention of investors. Regardless of whether the reasons for such revaluation are more or less justified, new investors join the movement by buying in the hope that it will continue. This contributes to nourishing the upward trend in a virtuous circle of growing and widespread greed transformed into buying pressure.

This self-fulfilling prophecy also works in reverse. When a price falls steadily, doubts, negative narratives and fear of losses spread quickly among investors like a virus, producing a vicious circle of sales fed back by a growing fear that may eventually turn into selling panic. These phenomena alone, regardless of whether asset increases or decreases are rationally, structurally, or economically justified, are capable of providing sufficient inertia to prices and building trends on different time scales.

This is so today and it was already four centuries ago in Amsterdam that narrated the Cordovan José de la Vega in his book “Confusion of confusions”. In its pages, describing the regulars of the Dutch stock market of that time, we observe exactly the same type of behavior that we see today in real-time through our mobiles. Nothing has changed in four centuries, and it is unlikely that our nature will change in the next 400 years. We observe exactly the same type of behavior that we see today in real-time through our mobiles.

In fact, trends are a ubiquitous phenomenon, which is systematically found in all historical price series that have been found, going back up to 800 years in the past. Regardless of the time and more importantly, culture-trends can be observed in both the formation of the prices of rice in medieval Japan and in our contemporary stock exchanges. The same pattern of the tulip bubble in the early 17th century Holland is repeated in the bubble of the South Seas of England in the following century or the real estate bubble in Spain in the early 2000s. As if it were a melody underlying the music of the markets, inertia in prices appears in each and every culture that has developed free markets.

Trends are a ubiquitous phenomenon, systematically found in all historical price series.

The Stubbornness of Human Nature

The question we, as traders, must ask ourselves is: Will inertia strategies continue to work in the future? We can answer this question with another: what is the factor common to all markets, assets, and historical epochs? The answer is ourselves; the human being. What is the factor common to all markets, assets, and historical epochs? The answer is ourselves; the human being.

Markets are the product of human action and are therefore inevitably conditioned by their nature. As long as humans continue to negotiate freely in the markets, we will do so thanks to an organ that we cannot detach or dispense with: our brain and its nature. An extraordinary and unique tool in the Universe, but full of biases, fallacies, and emotions that interfere with its rational functioning.

Convex strategies using inertia will continue to work in the future because the human being born today has the same brain as the human being who traveled the steppes 50,000 years ago. Biological evolution has not had time to adapt to rapid cultural and biological evolution. We continue to come into the world today equipped with a brain prepared for a world that has ceased to exist. Our biological heritage will carry potential energy future trends that will inevitably continue to form in the future.

Why do trends work? Without being aware of it, it is ultimately our biological heritage that loads potential energy future trends that will inevitably continue to form in the future, thanks to the particularities of that «kilo and a half of gray matter» that we all transport into the skull. In any case, it is really surprising how certain incentives and biases to the human being can emerge and be identified through phenomena as complex and chaotic as financial markets.

The most important reason why inertia will continue to permeate the markets-and it will therefore be profitable and prudent to continue to take advantage of it when it comes to investing is that it is impossible to want to change the human condition overnight and its biological heritage of millions of years, as the medieval Japanese quote says at the beginning of this article. To become the perfectly rational machines that economic orthodoxy dreams of and produce that perfect random path in price formation in markets, we should lose our human nature; stop being human. Something that doesn’t seem feasible can happen soon.

Notes:

[1] Why do trends work? Investment factors are anomalies or deviations in the price behaviour of financial assets that, in theory, should not exist if they follow a perfectly random path. Although more than 600 factors have already been identified, the five most significant are a) Value, b) low-volatility stocks, c) high-growth or growth stocks, d) small-size stocks relative to the rest of the market, and finally, e) “inertia” of prices to continue their previous trend beyond the theoretical random trajectory proposed by academic orthodoxy. 

[2] Why do trends work? The investment industry uses price inertia (the “momentum”, also known as “Trend following” or “CTA strategies”) to seek or increase investment returns. In the case of momentum, it usually refers to investments that are limited to capturing only bullish trends (long-only), being able to be applied as absolute momentum (when only the inertia of the asset being measured is taken into account) or relative momentum (when comparing the relative momentum of an asset with others to decide which/is overponderar). The trend-following/CTAs or trend tracking is similar, but is open to capturing both bullish and bearish trends, in multiple markets, and in different time windows.

Why do trends work? We must remember that the different modalities of what I generally call “Funds or inertia strategies”-although implemented in sometimes very different and sophisticated ways-respond to the same underlying phenomenon that is dealt with here. Little known to the novice investor, there are currently more than $400 billion ($400 billion Anglo-Saxon) managed on the basis of this same common phenomenon. As with all investment factors, we must always remember that not by focusing on a factor «theoretically usable», a better return is guaranteed.

[3] Why do trends work? Let us remember something obvious but with profound consequences in the formation of market prices: people do not like to lose money at any time or under any circumstances. This is so even if temporarily losing is part of a larger and more profitable plan over a longer period of time. Let us recall, for example, the case of Peter Lynch’s Magellan fund, which, although it achieved an annualised return of 27% in the 13 years it was in operation, none of its investors achieved such a return and a large majority lost money by investing in that fund! (by always subscribing and repaying at the worst times and not allowing the strategy to converge to its long-term profitability).

Why do trends work? Although we understand it rationally, any temporary loss or potential produces a great suffering; a real pain that our emotional brain never fully comprehends. Inertia strategies, even if they work, require taking on inevitable and numerous losses along the way-sometimes for several years. It is inevitable and consubstantial to any convex strategy. But when it comes to starting to lose money, most people prefer to abstain and choose a type of strategy that best suits the biased emotional response of their steppe brain, rather than accepting the unpredictable and volatile nature of markets.

Categories
Forex Basic Strategies

How to Build a Scoring System

Scoring system is a tool some professional traders use for decision making for their trades. A lot of factors are accounted for in the system eventually producing a score for a particular asset. Based on these scores traders know where opportunities are, effectively cutting down false signals of any trading system you may have developed. The Scoring system should tell you the best currency pairs to search for strong, emerging trends. And we all know by now that trend following is scientifically proven as the most probable method for a winning trade. Of course, some market environments ask for a strategy switch but the Scoring system is all about guiding you to fertile lands. 

Prop firms like to use hunting analogies for this system. Hunters first need to do some research before they start hunting for a game. They first need to know where to go, which location for finding the game is most probable. What weapons to carry, what time of day is good, how to spot trails, and so on. Once the hunter is positioned he will find a bunch of other animals that are not particularly interesting. A hunter/trader will need to wait patiently for the game to show up. It comes down to pull the trigger only when we assess the conditions, the signal, and put our capital at risk for that high probability trade.

The Scoring system will need some input. Giving a particular currency a score of -1 or +1 will have to depend on some analysis, be in indicators, or some other fundamental factor you think is relevant for your trading or asset (trading session, for example). Once you have your symbol picks and analysis set, the final scores for each asset are compared, thus giving you an overview of where to place your trades. Now, you should have a trading system in place for trade entry confirmation, exit, and so on, Scoring system is just a first step so you do not search for signals at the wrong place/asset. 

The Scoring system should rank your trading assets or currencies as weak, neutral, and strong. Sometimes, you will not have particularly weak or strong currencies. The scoring system is there to tell you that even if you have a signal from your trading system, that currency pair does not contain weak and strong currency but maybe ranging ones. This is not a high percentage trade, you may easily find out that the signal was a false breakout or just a temporary move. What a trader wants to find is a strong currency against a weak one and vice versa. Pairing these currencies carries the best opportunity and minimized risk it is a false signal you have found in your trading system. 

Now, once you know where to look, how do you find weak and strong currencies? While some traders think your trading system should have enough filters so you know the right currency pairs to trade even without the Scoring system, prop firms usually have a Scoring system using currency baskets as well. This may mean less trading frequency as an additional element is used but high-quality decisions are what differentiates pros from others. Currency baskets or Indexes give us chart representation of how strong a currency is compared to other major 7 currencies. Currency baskets are easily built on tradingview.com but there are also indicators built for Metatrader platforms, although they are not that common. Some brokers may offer Dollar or Euro Index symbols but other currencies like the AUD or GBP Indexes are not offered. It is important to know when we build the baskets, equal weight should be accounted for each currency. EUR basket formula below should give you an idea of how to make for the other 7 major currencies. 

Note that in some cases you will need to enter non-standard pairs like NZD/EUR to have a correct ratio for the index calculation and also pay attention to the JPY decimals as they are not as other currencies with 4 or 5 decimal presentation.

Prop firms advice to look at the bigger picture. Let’s say you are on the battlefield with thousands of participants, if you are a single soldier, you cannot see planes, warships, or artillery far away from your sight but they have an immense contribution to the battle outcome. As a trader, you need to see these factors by looking at two steps higher time frames from your target timeframe. If your system is giving a signal on a 1-hour timeframe, take a look at the daily. By doing this to each currency basket, for example, you may see your signal might be just an emerging correction of a larger trend and thus your probabilities of a winning trade are reduced since you are going against a major trend on a higher timeframe. Again, since the trend following method is considered the best, you want to have your trades aligned with the major trend direction. As a general view, a daily time frame gives you long term trends, 4H is intermediate and 1H is a short time overview of trends. Of course, you can find trends in every timeframe, but it is imperative your trades belong to a higher timeframe trend direction. When all timeframes, your target timeframe, and two steps higher are aligned, your odds are increased. 

This is a simple guide on how to find the best trades. On some occasions, you may find a one-time frame is not aligned with the other two, and it does not mean you should not take the trade. Reversal patterns are most successful in the intermediate time frame, for example. At this point, if you have a system in place for reversal strategies, you may look out for a major trend continuation setup on 4H when your target hourly time frame and long term timeframe are aligned. It is likely the 4H timeframe will also get aligned to the major trend and a trader can take this trade even if it is not strictly by the rules. There are also exceptions on the target timeframe but prop firms emphasize all timeframes alignment conditions on the bullish or bearish trend for the best trade setups.

Trader’s patience is tested at this point. Waiting for all timeframe alignment means fewer trades and less exciting trading. Know that forex changes and this alignment is not going to happen, you may feel you missed your shot. Fear of missing out is another enemy of profitable trading in tandem with impatience. As with hunting, the best game is usually not in plain sight the moment we are in position. The experience will always remind us and motivate us to wait, alas experience requires trial and error many times. To sum up, small major trend continuation trades are the best practice according to professionals. 

The Scoring system will have a set of measures based on which scores are made. If you are new to trading, start with simple measures and score range. Experienced traders already have a system they are accustomed to. Once you implement a scoring system, forget about all other info. Let’s say you have a signal on your MACD and the price is above your MAs. All is set up for a trade entry but you find out about a news report on Bloomberg tv that puts doubt in your decision. Waiting out might seem to be the right choice here but know there will always be some info for and against your decision. Put aside your thinking and feelings and just go with your system. When you set a +1 point if your MACD signals a long trade, +1 for MAs and +1 for other studies like Price Action pattern, agree you are looking at a bullish currency trend. Find a weak basket and look for that currency pair. Nothing else matters, keep it simple. 

Now, here is an example of how to build a Scoring system. Start with a set of indicators or fundamental analysis you will measure. Each will give you a bullish or bearish score you can mark in your table. 

Daily charts are considered as the best to start from to gauge trends. Start the scoring from this point. Applying this on a currency basket you determine which currency is weak, neutral, or strong against other major 7. Whatever you may think about this currency or political opinion about the country using it, is irrelevant. Know that you can win a trade even when your favorite team, company, or political party is losing. You may love your iPhone but know Apple Inc stocks are not always bullish, the score might be giving you -3 points. Separating your opinion from your trades will only provide you with more pips from your trading. Your Scoring could have more points and more inputs, it is up to the trader how many factors are accounted for. Setting up your rules based on scores is also subjective but know the point is to trade the strongest against the weak and vice versa. Testing your rules and the Scoring and trading system synergy is a must. Confirming your systems work can only be done by putting them in demo practice after backtesting. 

The Scoring system makes finding the best trades easy. Interestingly few traders actually do it. It may be because basket or currency indexes are not a common sight. Making one in the TradingView platform is possible but we have found out the formula is not easily found. Most new traders to this free platform do not even know they can customize the chart presentation with different formulas, let alone create a basket currency formula. Metatrader platform is known as customizable with thousands of free indicators, yet index currency calculation indicators are not numerous. Some forums mention basket trading yet the topics are not extensively developed. So a trader without the tips found in this article may even just rely on this, non-basket trading setup which is generating more false signals. Traders without the Scoring system will more often than not trade currency pairs without strong or longer trends, regretting they had not taken that other cross currency. It may be somewhat hidden knowledge, but traders that try new things, who are curious, not conservative, will find about this sooner or later. This points to another key trait a trader needs to have a relentless hunt to improve the system. 

To wrap up, the Scoring system is there to point you in the right market. Choose your timeframe, align the trend with 2 higher time frames, and look for continuation setups. If you are new you may not know your preferred time frame. This decision will have to be made according to your personality, needs, risk tolerance, and other factors. Try completing the trader personality test to know your pros and cons. Create your inputs for the scoring and sum up what currency is strong, neutral, and weak. Go trade the crosses with the biggest score differential. Now your trading system is put to work, combining the Scoring system result with your set of entry, exit, position management, and ranging filter indicators creates high probability trading setups. All you need to do is follow this checklist. Following simple rules seem to be, interestingly, the hardest thing to do.

Categories
Forex Basic Strategies

How To Trade A Ranging Market

One of the toughest things to do in forex is to remain profitable, the thing that is even tougher than this is to remain profitable within a ranging market, some people absolutely love a ranging market while other people hate it, it can all come down to the strategy that you are using and also the type of trader that you are.

A ranging market is basically when the markets are going sideways, there are little movements up and down but it stays between a high and low price range, the unfortunate thing is that it is very easy to make mistakes during this type of market and a lot of traders do a lot damage to their accounts when the markets are in this sort of situation. This is far more preventable in traders who have learned to trade during a trend, either a bull or bear trend when the markets continue in an upwards or downwards direction.

Having said that it is a dangerous time to trade, there are certainly ways to trade within it, and it is still possible to make a profit within these ranging markets. In fact, some people are able to profit more from a ranging market than they can from a trending one, so we are going to e looking at different ways in which people can and do profit from a ranging market, trading in this sort of environment can be quite exciting, so let’s take a look at the ways that you can do it.

Support and Resistance

When you are thinking of trading in a ranging market. The first thing that you should be considering are the support and resistance levels that the market is currently adhering to, you may not actually be trading these levels but knowing where they are will give you a good idea of the current market conditions and how it is performing, it will also show you the potential levels that the markets could reach if the current ranging of the markets were to break.

The first thing that you need to do however is to identify that the markets are actually ranging, one of the main things to look for is that the sideways markets have quite a distance between the support and resistance levels. If the support and resistance levels are actually quite close together then this would be considered as a choppy market and they hold a lot more risk and so it may not actually be worth trading in this condition, so ensure that the support and resistance levels are a little further apart. Trading a choppy market has a form of gambling within it and will not have a very good risk to reward ratio level making it a dangerous time to trade.

There are of course a few different types of ranging markets, these include a perfect range which is when the range reaches the support and resistance levels a number of times, the price will be going up and down in a very predictable pattern, when drawing out the support and resistance levels it should create a very clear rectangle. The next type of range is a ranging market with a pattern, this kind of range often appears to have some kind of direction, there may be a number of lower highs and lower lows which could be suggesting that an onward trend is forming, or the opposite for an upward trend emerging. The thirst type of the ranging market is a range without a pattern, this sort of ranging market is a little less predictable with the prices going up and down with no clear pattern or reason.

By being able to identify the type of ranging market that is occurring will allow you to make a much more informed decision when it comes to the sort of trades that you are going to put on. It would be far better and easier to make predictions in a market where there are patterns forming than it would in a completely random one. When ranging with a pattern can also indicate that the markets are going to potentially move into a trend and can give you an idea of the possible direction of that trend, you will want to avoid trading in choppy markets or a ranging market without a trend as this can be a much more dangerous market to be active in. A ranging market can also occur in the middle of a trend, so it is important that you manage to identify the overall trend direction too.

Trading Support and Resistance

So let’s assume that you are going to be trading in these ranging markets, one of the most simple trading methods is simply to trade the support and resistance levels. So we have marked out our support and resistance levels, we then wait for the price to hit either the support or resistance level, when it hits the resistance level when we want to sell and when it hits the support level we want to buy. Some people suggest that you should only buy or sell once the levels have been breached rather than just hit, trading this method is very simple and is a safer option as there are fewer things that can go wrong. It is important to remember to put on your stop losses a little below or above the levels in order to help protect your account from a potential breakout.

Channel Patterns

You can also trade with channel patterns, these are somewhat similar to trading with support and resistance levels in the way that it is a similar type of trading, we will just be setting our levels a little differently. Channel patterns are something that are offered and available on most charting software tools and packages, you can use them to make the highs and the lows of the markets. You will then work the same way, selling on the highs and buying on the lows, these sorts of patterns can also be used with a trending market and not just a ranging one.

Trading False Breakouts

False Breakouts, otherwise known as fakeouts, are another way of trading these ranging markets. The way that these are normally observed is by a pin bar candlestick that sticks out of the support or resistance levels. It is known as a false breakout due to the fact that instead of then breaking out the market will then continue back into its range. For those that trade breakouts this is a form of trap that can get them stung but for ranging markets they are pretty nice as they can present you with a great opportunity for a buy or a sell.

Bollinger Bands

Bollinger bands are often used to try and work out just how volatile the market share is, the top band will tell you how high the price has reached which the lower band will tell you how low it has been. If the bands are too close together then again this will indicate that the markets are choppy and so it may not be worth trading in this condition. If the bands are quite far apart this can also mean that you should not trade, due to the markets being a little too volatile. You can probably work out how to trade these bands, when the price reaches the lowest band you should buy and sell when it reaches the higher one. It is often a good idea to use Bollinger Bands in a pairing with another indicator such as support and resistance levels.

So those are some of the available trading patterns and systems that you can use in order to trade during ranging markets, it should be pointed out that this is not for everyone. If the markets that you are currently trading in are suddenly ranging, then try looking into new markets, just don’t go crazy and start trading exotic pairs that you have absolutely no idea about, they could be a little more volatile than what you are used to.

Of course, if you are a trend trader or a longer-term trader then it may be the best idea to simply not trade at all, the risk to reward ratio in this sort of trading is often a lot lower than you may be used to, you will be risking more for less, so if this is not the sort of trading you are used to or interested in then the best things for you to do may be to simply not trade at all. There is of course no harm in taking a little break from trading when there is nothing available for you to trade, do not try to force it in order to simply have something to do.

So to sum things up, when thinking about trading in a ranging market you should be looking for the support and resistance levels, you should be looking for patterns and you should be considering how volatile the markets are at the time of your trading. If things fall into place and you want to try it, start small and then build your trading up. It is a difficult time to trade but if you manage to get good at it, it will be another weapon in our trading arsenal and will allow you to trade and be profitable no matter what the trading conditions are like.

Categories
Forex Basic Strategies

The “Set It and Forget It” Forex Strategy

Is there such a thing as set and forget strategies? We would like to think that there should be some trading strategies that can work this way, but these should be used with caution and minimal understanding of the market, at least. When we talk about such strategies, the first thing you should know immediately is that they are made to be used with small leverage. After all, the last thing you would want is to be leveraged up to 200 times, perform an operation and then withdraw hoping that there will be some sort of backlash against you, as it could be too costly.

In the investment world, a set and forget strategy is the idea that you can buy or sell something and just retire. This is similar to what a trader shareholder does, buying a share in a company like Walmart while assuming that there will be dividends and that the company will continue to exist. There are no worries about a margin call. They simply buy shares and keep them. This is not the same as in the Forex market, as leverage and volatility make long-term retention a much more dangerous idea. Most retail brokers are speculators, so they tend to focus on short-term strategies.

One of the exceptions was the old carry trade, but that strategy no longer exists for the most part because retail brokers have broken the differentials between paired interest rates. Not so long ago people would just buy something like AUD/JPY at the end of the day interest rate, implying that at the end of the day they received very little payment, but much larger funds were getting advantage of this at the same time, raising those pairs. The financial crisis eliminated many accounts while that kind of trade was dismantled. Unfortunately, many retail brokers face margin calls after months and years of reliability.

Investment and Lack of Leverage

One of the questions you should know about setting up and forgetting strategies is that they are more suitable for investors and less suitable for speculators. This doesn’t mean you can’t use it to speculate, it’s just that you need an appropriate amount of capital.

When you make the decision to invest you assume that the price of a financial asset will be valued over the long term. The average investor is not worried about a 1% decrease in the value of an asset he owns. For example, if you bought a share of Microsoft and it lost 1% today you wouldn’t be surprised or worried. You are probably expecting to own such stock for several weeks, perhaps months or years. You know that in the long run, Microsoft will probably appreciate, or at least pay dividends. Maybe I’d have an emergency stop on the market, but that could be 10 or 15% below the current price. This is because you’re only risking 10 or 15% because there’s no leverage.

Reduce Leverage for these Strategies

Just as you wouldn’t use leverage for long-term trading of financial assets, you don’t need to use it in other long-term trading strategies. It’s true that leverage can make you extremely rich, but the most likely thing that could happen is that you would have a pullback that would cause a margin call, or a pullback later that would make you nervous enough to leave the trade, making it impossible to retain in the long run.

A perfect example would be to use the moving stocking crossing system. Although there are shorter-term versions of this, one of the most common ways to trade with this system is to use an exponential moving average of 50 days and one of 200 days. If the 50-day pass above the 200 day pass you must keep the asset in your possession. In the same way, if the 50-day pass below the 200-day, you should sell it. There will be traders in the market any minute, coming and going as moving socks cross each other. We need not say that it needs a trend to make this happen effectively. The side markets are very difficult when it comes to moving average crossing systems.

In the world of Rex, the way to avoid this potential danger is to take a position with little leverage. For example, if you have 1000 dollars in margin, the size of your position could be something like 5000 units. That’s 5-to-1 leverage. We understand that doesn’t sound like much, but it also gives you the ability to stay in that trade for weeks, months, and even years if the system allows it. Beyond that, if you have losses, and you will eventually have them, these will be small.

Another example of a “set and forget strategy” is to use a longer-term Fibonacci backlash based system. In the example below, you can see that we have the same graph that I used for a moving stocking crossing system. This time, you can see there’s a blue arrow in 50% of Fibonacci’s recoil. Most of the time, the longer-term traders will take 50% back from Fibonacci from a high swing as a sign that they must buy, and use the next Fibonacci recoil level, less than 61.8% in this case, as their stop loss. This case ended in a 230 pips stop loss, but you expect the market to return to its higher values at least. That would be a goal of 700 pips. Obviously, this works in the end.

A stop loss of 230 pips frightens many traders but in the end that depends on the size of the position. I guess the biggest lesson of all is that your position really matters. You will not get rich this way, however, you can create your account without stress. With such strategies, it is necessary to review the charts only once a day. Obviously, there are many other strategies but these are two of the most basic and popular.

Alternatives to Leverage

There are a couple of alternatives if you need to use leverage. One, of course, is to resort to the options market. You can go to the options market and sell against the SPY, for example. This shows that you believe the market goes up and automatically creates leverage. In fact, you can buy calls, there are millions of ways to go for options through your broker or your futures platform.

However, if you are selling and buying FX spot, the only way we know how to use leverage and a set and forget strategy, in this case, is to simply put your stop loss and profit target in order and shut down the computer. It’s possible, even if it’s hard. One of my favorite trades was the short sales of the USD/SGD pair. I went on holiday forgetting that I shortened the market, but I had a stop loss put there. When I came back, I had grown 800 pips.

In a way, all trading strategies must be set and forget, for this is stop loss. If you’re very nervous about a position, chances are you have too much leverage. Think of it this way, you’re gonna be a lot more afraid of losing 1000 USD than you are of losing 10 USD.

Categories
Beginners Forex Education Forex Basic Strategies

A Millennial Mental Tactic Applied to Forex Trading

Based on reading the book Sun Tzu for Success, written by Gerald Michaelson, whose original title is “Sun Tzu for Success”, we have extracted some of the main concepts indicated there and we have adapted and focused them towards an optimal preparation and performance of the trader who enters the dangerous sands of the financial markets.

Regarding Sun Tzu, we know that he was a legendary Chinese general and mercenary who lived around 512 B.C. Author of the book The Art of War, a famous Chinese book that talks about military strategy and tactics.

If we start our story with the description of the book in its original version and adapting it to the trading battle scenario, we have selected from among several guidelines and rules mentioned in the book, four basic principles that can be useful in creating a winning attitude for traders who day by day are faced with the unique battles that foster financial markets.

In this article, the analogy of the trading scenario with the battle is not meant to imply in any way that trading or the market itself is the enemy we must fight, no! As will be seen throughout this brief approach, the enemy to be fought in battle is everything that represents an obstacle to our success in trading, all without exception, even if we have to include ourselves as another obstacle.

Get to Know Yourself

Know your enemy and know yourself, and you can fight a hundred battles without danger of being defeated. If you don’t know your enemy and you don’t know yourself, you can rest assured that you will be defeated in every battle.

Self-perception is the golden key to success. Each of us is perceived as three distinct people:

* What we think we are;

* What others think we are;

* What we really are.

The most important of the three is “who we really are.” This search for personal identity can even represent the search for a lifetime. In this way, the sum of the information we can get from what others think of us about our way of trading alongside our own self-perception is vital to getting to know ourselves. We should not rule out that the enemy we must fight in battle is ourselves, that is, a part of us that prevents us from achieving success in trading.

Identify Your Personality

There are many ways to classify personality, but roughly we could make a classification into two groups: people who make their decisions based on logic and reasoning, and people who base their decisions on emotions.

Evidently, almost no human being conforms 100% to one of these two categories, however, in daily life and particularly when trading, we can appreciate if one of these ways of acting in each of us predominates. On the other hand, an intelligent mind will use each of these ways of making decisions according to the case in hand.

There will be decisions that require more emotional than rational inclination and vice versa. However, if we stop to look at our present and past ways of acting, we can see that just as there is a trend in the markets, in our personality there is also a tendency to act in a predominantly rational or emotional way.

However, if we are dealing with a trading platform, we must be sure that we are acting properly in this case, that is to say in a logical and rational way. If we are not doing it and we realize it then this is not a problem precisely because we have realized it, if instead we do it but we do not realize it (or we do not want to realize it) Then we’re in trouble, and sooner or later we’ll get the bill.

The key to this lesson is that self-knowledge is the foundation of success. Let us always remember that transforming oneself is much healthier than trying to transform others. An Ancient Chinese philosopher, Lao Tzu, reveals an important truth when he states:

“He who knows others is wise. He who knows himself is enlightened.”

So, the more you know about yourself, about how you do trading the more you can evolve on the path to becoming a successful trader. Always listen to what they say about you in your environment, even though you don’t like everything they say, think it’s information, it’s knowledge about yourself and you have to treasure it for your own evolution as a trader.

Recognize the Battlefield

This issue has to do with the information. The more information we have about the market or markets with which jobs we will be better prepared for the battle. Trading is not an easy task and undertaking an operation with little or no training or information is like attending the center of a melee battlefield between two sides completely naked. Therefore, the trader must:

  • Finding out about interest markets
  • Read books and watch specialized videos
  • Learn and value the experiences of people who have won
  • Learning and valuing the experiences of people who have lost
  • Attend specialized courses
  • Learn about and test new trading programs and platforms
  • Have suitable and modern hardware to avoid technical obstacles
  • Research new and potential strategies that work in the markets
  • Keep up to date, find out and compare commissions, guarantees, tax aspects, etc.

Nothing should be neglected, no detail. Everything is important, including of course the information of who we are, as we may be the worst enemy capable of sabotaging our best strategy.

Develop Good Strategies

With all the information gathered in the above steps that are equivalent to having a good knowledge of yourself and the battlefield in the markets of interest, design strategies that are adapted both to the markets in which you intend to operate, as well as the characteristics of his personality.

If you are a person who has very little control over your emotional states, is easily altered, and tends to overreact to sudden changes in your environment, it may not be convenient for you to trade in intraday or Forex markets in reduced time frames, being perhaps a good recommendation to adjust the time frame to your reaction times. Keep in mind that when you put a good strategy to work in real-time, it will expose its benefits or not, depending on whether or not we are able to accept and implement your recommendations. To prevent us from entering into a future conflict with our strategy, it is important that it be “compatible” with our way of seeing or interpreting the markets in which we operate. In short, develop good strategies based on solid information and prepare yourself for the battlefield.

Execute the Action

Once you have already developed and tested your or your strategies, take action (enter the market) safely and decisively without neglecting the continuous exercise of discipline and self-knowledge, because during this new phase you will discover new things about yourself that will serve to optimize your overall strategy.

Take the initiative of the action: In every battle, the one who strikes first is the one who has the advantage. Taking a determined and clear attitude when launching your strategy reflects that you are clear about everything that may have been outlined in your trading plan. It is not at any point to act viscerally guided under irrational impulses but quite the contrary, it is to strictly follow the tactics and strategies for which you have previously trained. Now, in this plane of action, it must be certain.

Develop a spirit based on offense: This pattern in trading is more focused on maintaining a simple anticipatory attitude to any eventuality, represents the implementation of anticipatory control, not letting anything escape, not leaving room for improvisation. It is a process in which you can optimize on the fly but always stick to the script (your trading plan). If you have done your homework well then you should not be making any substantive changes to your strategy at this time, if you do it it would be better to step back and abandon the battle in time.

Keep on the move: The idea of this topic is to maintain a permanent alert, this is where you put into practice your main faculties as a human being, develop a high level of attention and focus and a power of recovery or dynamic memory, in such a way that your mind controls absolutely every detail to ensure success. This is the heart of the battle and will be the prelude to success.

Categories
Forex Basic Strategies

Design, Approach, and the Selection of Trading Strategies

In quantitative trading, there is a typology of systems that is practically impossible, but only two general approaches to constructing them: The analytical and the statistical. Both will face the processes of optimization and selection of strategies in a very different way, affecting even the way in which the results of a backtest are interpreted and evaluated.

APPROACHES TO SYSTEM DESIGN

The analytical approach, also known as the “scientific approach” or “Quant approach”, investigates the processes underlying market dynamics. It analyzes in-depth its large-scale structure and microstructure, trying to find inefficiencies or alpha-generating sources. For example, it conducts studies on:

  • The sensitivity to news and the speed with which markets absorb their impact.
  • The specific causes of some seasonal phenomena observed in commodity markets.
  • Interest rates and their impact on different asset classes.
  • The way high-frequency trading alters the microstructure of a market.
  • The effect of the monetary mass on the expansive and contractive phases.
  • The “size factor”, the “moment” and the dynamics of reversion to the mean.

As a result of these often interdisciplinary and highly complex studies, researchers formulate hypotheses and construct models that they will later try to validate statistically. In this approach, the backtest aims at the historical analysis of the detected inefficiencies and their potential to generate alpha in a consistent manner.

The next step will be the construction of the strategy itself: Operating rules are formulated that reinforce or filter out this inefficiency. Some will be parameterizable and others will not. Therefore, the risk of over-optimization is not completely eliminated. However, the big difference with conventional systems construction is that researchers know in advance that there is a useable inefficiency and More importantly, they have an explanatory model that links it to processes that affect markets and modulate their behaviour.

The statistical approach does not pursue knowledge of market dynamics nor does it make previous assumptions about the processes that lead to inefficiencies. Search directly into historical data patterns, cycles, correlations, trends, reversion movements, etc. that can be captured by system rules to generate alpha. The rules can be crafted by manually combining the resources of technical analysis based on previous experiences or using advanced techniques of data mining and machine learning (ML).

Here, backtesting occupies a central place, since it allows us to distill the strategy in a recursive process of trial and error in which an infinite number of rules and alternative systems are tested. Optimization arises from the progressive adjustment of rules and parameters to the historical data series and is calculated by the increase in the value of ratio or set of criteria (Sharpe, Profit Factor, SQN, Sortino, Omega, Min. DD, R 2, etc.) used as an adjustment function.

The big problem with this way of looking at things is that we will never be able to know with certainty whether the results we obtain have a real basis in inefficiencies present in price formations or arise by chance, as a result of over-adjustment of parametric rules and values to historical data. On the other hand, ignore the processes involved in the generation of alpha, converts the system into a kind of black box that will have the psychological effect of making the trader quickly lose confidence in their strategy as soon as the actual operating results start to be adverse.

Obtaining data mining systems need not lead to over-optimised or worse quality strategies than in the analytical approach. In our opinion, the keys to this procedure are:

-Starting from a logic or general architecture consistent with the type of movements you want to capture. This will lead us not to improvise, testing dozens of filters and indicators almost randomly.

-Rigorously delimit the in-sample (IS) and out-sample (OS) regions of the historical, ensuring at each stage of the design and evaluation processes that there is no “data leak” or contamination of the OS region.

Do not fall into the temptation to reoptimize the parameters or modify again and again the rules when we get poor results in the OS.

Keep the strategy as simple as possible. Overly complex systems are authentic suboptimizing machines. The reason is that they consume too many degrees of freedom, so to avoid an over-adjustment to the price series we would need a huge historical one that surely we do not have.

Even taking all these precautions, there is a risk of structural over-optimisation induced by the way such strategies are constructed and which is virtually impossible to eliminate. Takes different shapes depending on whether the strategy construction is manual or automatic:

In the case of craft construction, and even if regions IS and OS are strictly limited, the developer has inside information about the type of logic and operating rules that are working best now and ends up using them in their new developments. Markets may not have memory, but the trader does and cannot become amnesiac when designing a strategy. Perhaps you will be honest and try your best not to pollute the OS with preconceived ideas and previous experiences. But believe me, it’s practically impossible.

In the case of ML the problem is the extremely high number of degrees of freedom with which the machine works. A typical genetic programming platform, such as SrategyQuant or Adaptrade Builder, has a huge amount of indicators, logic-mathematical rules, and input and output subsystems. Combining all these rules, many of which include optimizable parameters, the genetic algorithm builds and evaluates thousands of alternative strategies on the same market. The fact that two or more regions of history (training, validation, and evaluation) are perfectly limited does not prevent many of the top-ranking strategies from operating in the OS by chance, instead of demonstrating some capacity for generalization in future scenarios.

OPTIMISATION AND SELECTION OF STRATEGIES

If we start from a simple dictionary definition, optimization in mathematics and computing is a “method calculate the values of the variables involved in a system or process so that the result is the best possible”. In systems trading, an optimization problem consists in selecting a set of operating rules and adjusting their variables in such a way that when applied to a historical series of quotes they maximize (or minimize) a certain objective function.

Depending on the approach, the concept of optimization takes on different meanings. In the analytical approach it is optimized to:

  • Adjust the parameters of a previously built model to the objectives and characteristics of a standard inverter.
  • Calibrate the sensitivity of filters that maximize detected inefficiency or minimize noise.
  • Adhere to the operating rules to the time interval in which inefficiency is observed.
  • Test the effectiveness of rules in different market regimes.

In general, this is a “soft optimization” since the alpha-generating process is known prior to the formulation of the system. In contrast, in the approach based on data mining, optimization is the engine of strategy building. It is optimized for:

  • Select the entry and exit rules.
  • Determine the set of indicators and filters that best fit the data set.
  • Select the robust zones or parametric ranges of the variables.
  • Set the optimal value of stops loss and profit targets.
  • Select the best operating schedule.
  • Adjust the monetary management algorithm to an optimal level in terms of R/R.
  • Calculate the activation weights in a neural network.

In the ML world, the historical data set used as IS, and the testing or evaluation period (testing set) to the off-sample or OS data is called the training period (training set). Configurations that are subject to evaluation are called “trials”. And this number of possible trials depends on the complexity of the system to be evaluated. With more rules and parameters, more configurations, lesser degrees of freedom, and greater ability to adjust to the IS series. In other words: The more we adjust and the better the system works on the IS side, the less capacity to generalize, and the worse performance on the OS side.

In a realistic backtest the average results obtained should be in line with those of actual operation. But this hardly ever happens, because during the construction and evaluation process many developers make one of the following five types of errors:

ERROR I: Naïve evaluation. The same data is used to build and evaluate the strategy. The whole series is IS and the results obtained are considered good -perhaps with some cosmetic corrections. It is surprising to find this error even in academic papers published in prestigious media. In our opinion, any backtest that does not explain in detail how it was obtained is suspicious of this error. And here it is not worth putting the typical warning that it is “hypothetical data”: They are not hypothetical, they are unreal! And the whole industry knows, except the unsuspecting investor.

ERROR II: Data contamination. Due to the poor design of the evaluation protocol, data are sometimes used in the OS that has already been used in the IS. This usually happens for two reasons:

The IS-OS sections have not been correctly delimited in the evaluation phase. For example, when performing a walk-forward or cross-validation. Information from the OS has been used to re-optimise, or worse, to change the rules of the strategy when the results are considered too poor.

ERROR III: Historical too short. There is not enough history to train the strategy in the most common regime changes in the markets. In this case, what we will be building are “short-sighted” systems, with a very limited or no capacity to adapt to changes.

ERROR IV: Degrees of freedom. The strategy is so complex that it consumes too many degrees of freedom (GL). Such a problem can be solved by simplifying the rules or increasing the size of the IS.

In a simple system, it is easy to calculate the GL and the minimum IS needed. But what about genetic programming platforms? How do we calculate the GL consumed by an iterative process that combines hundreds of rules and logical operators to generate and evaluate thousands of alternative strategies per minute in the IS?

ERROR V: Low statistical significance. This usually happens when we evaluate strategies that generate a very small number of operations per period analyzed. With very few operations the statistical reliability decreases and the risk of over-optimization skyrockets.

We can approximate the minimum amount needed for a standard error that is acceptable to us, but it is impossible to establish a general criterion. Among other things because the amount of operations is not evenly distributed in the different periods. For example, when we work with volatility filters we find years in which a high number of operations are generated and others in which there is hardly any activity. Does this mean that we will reject the system because some OS cuts, obtained by making a walk-forward of n periods, have low statistical reliability? Obviously not. The system works according to its logic. So what we could do is review the evaluation model to compensate for this contingency.

Another example would be the typical Long-Term system applied in time frames of weeks or months and that does at most ten operations per year. In these cases the strategy cannot be analysed asset by asset and the only possible analysis is at the portfolio level, mixing the operations of the different assets, or building larger synthetic series for a single asset.

A cost-effective and fully functional strategy does not need to meet all these criteria; it is a table of maxima. However, as long as it does, we will have more reliable and robust systems.

On the other hand, this issue does not look the same from the point of view of the developer and the end-user of the system. As developers, we will approach these criteria as long as we have a well-defined protocol that covers all stages of design and evaluation. And, of course, if we also want to meet the first requirement, we will have to spend a lot of time on basic market research.

When the strategy is designed for third parties, these requirements are only met under the principle of maximum transparency: The developer must provide not only the code but all available information about the process of creating the strategy. Actually, this is not why the vast majority of systems available on the Internet to retail investors by sale or subscription. That’s why we’re so skeptical of “black box” or similar strategies. We don’t care if someone puts wonderful curves and fable statistics on their website. That’s like wrapping a box of cookies in a supermarket: If we can’t taste the product, we can’t say anything about it.

Categories
Forex Basic Strategies

Low-Risk (Yet Profitable) Forex Trading

One of the main things that attract many people to Forex is the potential to make significant gains in a relatively small time due to the use of leverage. However, the profit potential comes a significant potential for losses that should not be overlooked. To protect your account, it is a good idea to look at the big picture, which means not only looking for potential benefits but looking for ways to operate in a way that is less risky. Its rewards may be smaller in the short term, but with a low-risk Forex trading strategy, we expect you to be more successful in the long run.

There’s always a risk, and that’s okay. Think about it this way: there’s no business you can get into that doesn’t have a certain risk. For example, if you decide to open a convenience store, there is also the possibility that you may not be able to earn enough money to keep your doors open. But, if you conduct a proper investigation and consequently make the right business decisions, it increases your chances to build a profitable business. In this sense, your business is very similar. You should conduct proper market research to make sound trading decisions. You will still have some risk when you make transactions, but the risk will be diminished by its own understanding of financial markets and the way they move.

A great thing about Forex trading is that it can be in or out of the market at its own time of choice. For example, if the markets are too erratic and too volatile for you to feel comfortable, you just don’t do trades. Unfortunately, most novice Forex traders don’t understand what it is okay to put aside when needed. But if you make the decision to manage your risk, don’t be afraid to sit down. You may miss some winning trades, but you will probably also skip the lost trades.

Another way to manage your trading account and operate with less risk is to properly manage the size of your position. At the same time that Forex traders can use leverage to increase their earnings on winning trades, leverage is also a tool that can cause excessive losses and has to be used with care. Don’t let your desire for quick cash drive you past your account. You are in control and should always be careful to trade responsibly. Low-risk Forex trading.

Finally, you can control the size of your position and the time of your trades to take a lower risk. For example, if you work full-time and don’t have much time for forex trading, you can reduce the size of your position and the trade of the daily deadlines. You only need to devote a few minutes a day to setting loss stop settings and limits, and this trading strategy will allow you to continue your normal life while your money works for you. If you have time to sit on the computer for hours and hours, short-term trading may also be a possibility.

Pay attention to the psychology of commerce. Forex psychology is probably the most underrated tool a Forex trader has. The longer I trade, the more I realize this is true. For example, a market will rise or fall in the long run. That being the case, it would theoretically have about a 50% chance of success in any particular trade. What do you do with these odds? Take an example: you decide to shorten the USD/ CHF pair. When you press the sales button, the market spins and goes up almost immediately. You got a 50-pipe stop loss that’s in danger of getting hit pretty fast.

Do you let it happen? Or does he move his stop loss even higher in the hope that the market will back up in his favor? Unfortunately, too many traders will do the latter. You should remember that you set your loss limit for a reason, and the reason is still no matter how the market moves.

The worst thing is that the biggest mistakes often occur immediately after the initial loss. Too often too many people seek to “get their money back” from the market. Not only will they reverse the trade, but they will also double the size to get that money back quickly. Murphy’s law explains almost 100% of the time that trade will not work. You have increased your losses rather than minimized them.

Risk management is crucial and the key. Risk management is by far the first trader’s job. You must understand that losses are part of the game and that you must be able to tolerate them. For example, if you have a loss as described above and risk 10% of your account, you need to get 11% just to make up for the next transaction. You have also received a significant amount of damage to your account. However, think of trading in terms of risk of 1%. You still have 99% of your seed money, which is a lot easier to digest. In fact, I know many merchants who will risk only 0.5% per operation.

It is not the established trade. There is no magic trading configuration that creates high-profit, low-risk trades. The reality is that your trading system is not the only thing that will dictate your success. You must also manage your risk, pay attention to psychological triggers, and keep abreast of the market, even with an established business plan. The best way to keep a low risk in your foreign exchange operations is to keep your leverage reasonable, focus on your objectives, and not let stress or greed dictate your business decisions. With these gold keys, your low-risk strategy should deliver solid results in a long commercial career.

Categories
Forex Basic Strategies

How to Quickly Recover from a Blown Trading Account

Having your trading account reach a $0 balance can feel worse than a bad heartbreak. Unfortunately, this can happen to the best of us, whether you’re still beginning or considered to be more of an intermediate level trader. Some traders that blow their account give up entirely because they convince themselves that they aren’t good enough or they simply can’t bring themselves to deposit more money they might lose. However, losing your account balance doesn’t mean you should give up, as many successful traders have been there before. If you’re struggling to recover after blowing through your account balance, take a look at our tips below to keep yourself in the game.

Acceptance 

 Accepting the fact that you blew your account can be difficult. Some traders make excuses as to why they weren’t the problem and place blame on other factors to avoid taking a blow to their ego. Others go the opposite route and impose a lot of self-blame on themselves. They might think thoughts like “I’m not good enough” or “Maybe I should just give up”. Some never trade again because of this.

Although blowing your trading account is not ideal, it is also something that happens. It’s important to understand that trading is risky, and this is something that could happen to anyone. Once you’re able to look at the problem in a healthy light, you’ll be more prepared to take steps to deal with it.  

Ask yourself What Happened

After accepting your loss, you’ll need to look into the problem to find out what actually happened. The best traders actually use the opportunity to learn from their mistakes, so you’ll want to take a detailed look at each trade you’ve taken. This step is important if you want to avoid having the same thing happen to you again.

If you were already using a trading journal to log every previous trade in detail, you can pat yourself on the back for making this step easier. If you weren’t, you’ll still need to do the best detective work you can to find the problem and come up with solutions. Maybe your trading plan is to blame, you risked too much money on each trade, or there were several different issues affecting your results. 

Practice on a Demo Account

You might not want to go back to demo trading – after all, it almost feels like a demotion. Still, you shouldn’t discount the benefits of trading on a demo account. In addition to being free, demo trading can help you work on fixing the issues that previously blew your account without having to risk any more money while doing so. If you’re hesitant to get back into real trading, this step can also help ease you back into it while increasing your confidence if you get good results. 

Open a New Trading Account

Sometimes, a fresh start is all you really need. After you accept your losses, get some practice, and work out what went wrong, you’ll be ready to deposit more money into your old account or maybe even open a new account with a new broker. Keep in mind that you could open a smaller account if you’re feeling apprehensive and you might even be able to find a better broker while doing so. Instead of feeling discouraged, think of it as a new beginning where you can get off to a better start. When trading on your new account, remember to keep a detailed log of your trades in a trading journal just in case you need to track your progress.

Categories
Forex Basic Strategies

Holy Grail Forex: Three Successful Strategies

“Holy Grail Forex” is what traders call a successful strategy, which gives virtually no unprofitable trading. To search for the Grail, traders can take many months, even years, but cannot find it. It is very evident that there are no perfect strategies, but if we have the right approach, virtually every strategy can be made into a Grail-like trading system.

Rules for Creating an Ideal Trading System

The strategy should not be overloaded with technical indicators. The “more indicators, better” rule does not work. A professional trader can earn money using simple classic tools (mobile, Bollinger bands, oscillators, etc.) and by combining them correctly.

The trading system is tested in the demo, and then in the account cents with a minimum of 100-200 transactions, setting the main indicators: maximum profit and loss, a series of profitable and unprofitable operations, the relationship between average profit and average loss, etc. During testing the trading system optimizes the configuration of parameters and indicators from the point of view of optimal profitability and moderate risk. If at any time there is an anomaly in the actual trading account of the statistics of the working indicators of the test indicator system, the negotiation stops for the search of the causes.

The success of a trading system depends largely on the psychology of the trader. The key to success is composure, control over emotions, risk minimization, and self-confidence. Don’t be afraid to experiment. I prefer to use combined indicators in strategies, which are built on the basis of modified classical tools. Here are some examples of these indicators, which can be downloaded for free and installed on MT4. The strategies are polished and show good results. The main thing is to comply with risk management rules and not pursue surplus profits.

1. Strategy of “Bollinger Bands and MACD”

Simple channel strategy, the basis of which is a single combined indicator. Its composition includes:

Bollinger Bands is a basic channel indicator that denotes limits, support levels, and resistance. The rupture of the channel limits signals the emergence of a new strong trend, but more often the trend is reversed from the limits of the channel in which the strategy is built.

MACD is a very popular indicator that is used to test the strength and direction of the trend, is built based on moving averages. The combo indicator can be downloaded for free. After downloading the file, it must be copied to the MQL4/Indicators folder. Then, in the “Charts/template” menu, find the template of the indicator installed and run it. Recommended settings for BB_MACD are already listed in the template and cannot be changed without a deep understanding of the indicator principles.

Since the underlying instruments are indicators of volatility, it is best not to use BB_MACD in illiquid currency pairs. I would recommend the classic pair EUR/USD and the timeframe M30. Here the results are better.

Conditions for opening a long position:

-BB_MACD draws red dots below the red line. This can be a single point, but if there are several in a row, it will be a stronger sign.

-After the appearance of the red dots on the next or second candle above the red line a green dot will appear.

-On the next sail, you can open a position.

I recommend Stop Loss at the 10-point level. Exit the market is necessary with the sequence: as soon as you have obtained a profit of 15 points, close half the position, and in the second secure the trailing stop at 15 points and leave on “floating free”. The opening of a short position is completely opposite: a series of green dots must first appear above the blue line, after which a red dot must be drawn below the blue line. On the next candle after the signal, you can open a position.

Tip: If the channel formed by the Bollinger bands visually seems narrow with respect to past periods, the position should not be opened independently of the signals.

2. Fast Trend Line Momentum

Momentum oscillator is included in most trading platforms as a basic tool. Its objective is to measure the magnitude of the price variation of an asset over a certain period by comparing the current price with the price of some periods ago. Fast Trend Line Momentum is a modified impulse, which is not calculated on the basis of the closing prices of the sails, but on the basis of a smoothed trend line. Thanks to this, the curve looks smoother, and the indicator itself gives more precise signals.

Currency pairs -any liquid active, timeframe -1 hour.

Conditions for opening a long position:

-The oscillator draws a consecutive series of 3 or more red columns below “0”. Green columns should not have.

-The last “column” drawn must be located below level -0.002.

-Once the above conditions are met, a green column appears on the chart. The signal will be even more accurate if in the green column the candle is rising.

-Immediately after the green column has been drawn, open a position.

Everyone decides for themselves when to close a position, depending on their appetite for risk and the nature of the market, but I would recommend not to overexposure, closing half at the level of 10 points. The conditions for the opening of sales positions are opposite.

3. Stochastic + JRC + RSI

This indicator combines three basic tools, which are often used in beginner strategies:

-Stochastic oscillator that reflects the level of overbought and oversold of the asset. It is used to identify reversion points.

-CCI is an indicator that shows the overall rate of exchange of quotations of an asset in the market.

-RSI is a relative force index that also helps to identify potential points of trend reversal and the emergence of a new direction.

The simultaneous connection of three oscillators is an indicator, which shows their weighted average, helps to monitor the state of the market. Although exact signals to open the strategy position do not usually occur very often. Currency pairs GBP/USD, EUR/USD, 1-hour timeframe.

I recommend leaving the indicator settings in basic. Note the weight parameter, this is the weight coefficient of each oscillator in the general formula of the indicator, which can be adjusted in the range from 0 to 1. For CCI and RSI, the default value is 0.1.

Conditions for opening a long position:

  • The green line falls below -50.
  • The red line remains above -50.
  • The red line is crossed by the green line from bottom to top.

When these conditions are met, one position can be opened on the next sail. The greater the angle of intersection, the better the signal. If the green line crosses the red line almost in parallel, the signal may be false.

The selling position opens in opposite conditions, but with a level of 50 and with crossing the green and red lines top down. The indicator can be used with other tools, for example, slider analysis or graphics.

Conclusion. These simple strategies are convenient because they are not overloaded with redundant indicators and position opening points are easy to examine. The use of a combined indicator instead of basic 2-3 saves the trader time and simplifies control over the situation in the market. Recommendations for optimizing strategies:

Determine the time when strategies give more frequent and accurate signals.
Do not negotiate on these strategies in flat and at the time of publication of the news.
If the strategy gave 3 consequential unprofitable signals, take a breath or change settings.

Categories
Forex Basic Strategies

The Power to Average in Forex

0101Price action and swing trading methodologies per se provide a powerful way to operate in markets, but when they are complemented with average value analysis, you can start to “see” much more. The word “average” is synonymous with the word “average”, which is widely used in financial markets, including the stock market. However, this can be an important tool when used correctly. Mathematicians, Scientists, and Data Analysts usually use the power of the average in clinical trials, predictive analysis, and other applications to predict things. In this article what we want most is to show them how the power of simple average can be applied to your forex trading.

The Wisdom of Crowds: Average on Forex

The power of averaging comes to light when used with “crowd data”. Keep in mind, when analyzing a price chart, you’re looking at the average combined thinking of all traders in the market, who are being represented in the price. For example, do you know those quizzes about guessing the amount of candy in a jar? Most people will be far away from the actual number with their assumptions, some as much as 100 times above or below the actual amount. In fact, out of 160 people, only about 4 would approach the real value.

The interesting thing is that, even though no one usually gives the correct answer, “everyone” (as a group) comes up to a fairly close number. The typical scenario shows that when the amounts said by the public were averaged, the resulting number was something like 5,231.77 when the actual amount of candy inside the bottle was 5,240. This means that data collected from the entire public were able to accurately determine how many candies were in the bottle with a difference of 9 candies, which would be a margin of error of approximately 0.17%.

This example is quite amazing and shows the power of averaging. A Youtube channel did this experiment on the candy jar, letting people put their amounts in the comments. When the results were collected and averaged, the average was within 4% of the real value. Usually what happens is that people who overestimate are canceled by people who underestimate, which naturally filters out the bad estimates. What this shows is that you can collect everyone’s thoughts and average them to get something that is mysteriously close to real value.

Probabilities and averages should be the backbone of your risk management. Another unexpected place where averages play an important role is in our risk management plan. This will certainly have a consequence on the way you think and respond to your trading performance on a long-term basis. Many forex traders have difficulty making the switch and starting to think in terms of probabilities. Unfortunately, many people have their heads full of misinformation, contradictions, and paradoxes. For this reason, most new traders rank money management and capital preservation much lower than do experienced traders.

But the bottom line is that trading is a math game. You must understand the odds and statistics, and aim to stay on the right side of the numbers by exploiting your advantages in order to succeed. The advantage we teach in these items is to exploit recurring price patterns that continue to be repeated in the same way over time. Always keep in mind, there are a certain number of traders in the market at any given time, and they are doing the same thing over and over again to try to make money. This includes large amounts of “smart money,” such as investment funds and commercial companies that have the largest volume on the market.

This behavior repeatedly generates price action signals that we recognize and use to predict price movements. These signals of purchase or sale on average will behave in the same way as they have in the past, producing results that we can capitalize on. To make the most of the power of averaging, it is also advisable to apply positive risk-benefit ratios to the risk management of our operations, so that the “average” operation will have a profit. When you apply a 1:3 benefit risk ratio to your operations, you can lose 75% of them on average to keep your account in balance (neither win nor lose). In other words, you must win 1 out of 4 operations to maintain balance, or 1 out of 3 operations to earn money.

When you look at your recent operations, you may not see these numbers, but if you continue to apply this principle, the numbers eventually “stabilize” and represent what we are exposing. For example, you could have 4 consecutive operations that end up reaching the 1:3 target, which would be a total return of 12 R (12 times the risk). After this, you could suffer a drawdown period of 5 losing operations, but it wouldn’t really be a drawdown, because you’d still be up at 7 R. On the other hand, this could happen the other way around, losing operations might come first, giving you a -5 R as a result of a losing streak. But if the next 4 operations win, the situation changes completely and you end up with +7 R.

This is somehow to be expected because the market moves through good and bad conditions to make money for each system, and the losing and winning operations will tend to cluster as the market cycles happen. Start using the power of positive risk-benefit ratios and eventually you’ll see the results. All this is true if we assume that you have an advantage in your trading system, such as using price action.

How Most Common Indicators Work

We could stay here and tell you how useless we think the indicators are, but you’re human and your curiosity will force you to explore them for yourself for sure. This is completely understandable, sometimes you need to explore them to remove any remaining doubts in your head about what you might be losing. This way you can know exactly what the indicators are and decide from your own experience whether they are for you or not. When you insert indicators to your charts, they usually expose your data in the form of a line chart or histogram. The indicator is like a “black box” that does the hard work internally.

Would it surprise you if we told you that most common indicators are just a combination of price action data and mathematical averages? Well, it is true. Indicators such as stochastic, ADX, and CCI use the maximum, minimum, and closing prices of candles and pass them through averaging formulas. The ADX recycles its own data through multiple layers of averages.

The ADX is designed to quantify a trend by a certain numerical value. The result is that, if the value is too high, the trend will be more powerful. Here you can see how in the USD/SDG pair we have had this beautiful trend, but the ADX only showed a really confusing graph of lines that does not seem to correlate with the strength of the trend, or stability.

There are some custom indicators going around, which are actually joining multiple indicators within one, in an attempt to develop an extraordinary hybrid indicator. That is why it is well known that indicators have such a horrible natural mismatch. Some are notoriously worse than others, because every time you average data, the end result responds much more slowly to the real movement of prices. When you look at what is happening within most indicators, they are actually just a game with price action data, which are passed through some mathematical averaging calculations, it is not a big deal, just the same type of data but shown in different ways. This could be an advantage for some, but several of us would be frustrated with the performance of the indicators.

It is true that some indicators can work well under specific conditions for short periods, mostly in highly biased markets; but on the other hand, these indicators will give the trader a lot of poor quality buying and selling signals during conditions that are out of the optimal market behavior for which they were designed, and this could be as much as 80% of the time.

Presenting the Average Value Analysis

This is the basis for the analysis of the average value, the study of the price relative to its average value. We use average value analysis to help us determine many things in a price chart, such as:

  • The direction of the trend
  • Strength and momentum of the trend
  • Stability of the market
  • Signs of climax/exhaustion
  • Ideal points of purchase and sale
  • On Price Extension/Opportunities Reversion Operations to Average

The middle-value properties help the trader quickly remove noise, presenting a “summary” that you can use to quickly measure conditions at first sight, and help you make smart trading decisions. But of course, the analysis of the average value is not the only aspect that makes a good sign of trading. This along with price action and swing trading work synergistically with each other to create a powerful trading methodology that helps you read the graphics.

Categories
Forex Basic Strategies

Can You Earn Money on Forex Using Volume?

Unlike stock and futures traders, most retail Forex traders are not yet able to rely on volume data as an indicator to determine when to enter and when to exit operations. This is regrettable, as volume data can be much more predictive about future price movements than the same technical analysis based on pure price. There may be ways to get a better idea of where you are making the purchase and sale beyond what is already known.

There are three possible sources of volume information that a trader should be able to use in their operations. Let us take a look at how easy it is to access such information, going from the most difficult to the simplest.

Depth of Market (DOM)

Few Forex brokers offer this feature, although ECN brokers do offer it often. This function shows, at a given time, the outstanding orders to buy or sell an asset and at what price. It is usually a “staircase” chart, with the quantities shown against each price above and below the current market price. Some versions also include a “market profile“, which visualizes the quantity that has already been bought or sold so far during the session.

It is important to note that since there is no central market in the Forex spot, the data presented in the Depth of Market will logically be limited to the broker offering that function. It follows that the greater the volume handled by a given broker, the more accurate the data it presents. This is why many traders who use this information largely prefer to trade on major futures exchanges, where foreign exchange futures are traded in large quantities through a centralized entity. Usually, the Forex spot is not as liquid, but more reliable volume data is concentrated there.

So the Depth of Market is useful in Forex trading? Almost all professionals in the foreign exchange market will tell you that it is an essential tool in undertaking very short-term transactions. In fact, they will also tell you that it is much more useful than a typical technical graph. The reason is that you can very easily see, looking at how many orders have been placed at each price, which is moving the financial market at the moment: the buyers or sellers, or whether a market is finely balanced or simply relatively inactive.

What is expected for retail traders is to wait for larger orders to enter and enter as close to those orders as possible, on the backs of the big players. After all, prices are driven by high volume orders that inevitably come from big players, not from small traders. The best trading strategy for small traders is to track the flow of elephants who are winning the fight in the market at any time.

Let’s talk about the fundamentals of strategy:

When you see large sales orders a few ticks above and large purchase orders a few ticks below, you have a range for trading. Of course, it’s not as simple as that, because “false” orders can be entered and removed in the blink of an eye: not all incoming orders are executed. In theory, spoofing is illegal, but you don’t read in the news about a large number of successful prosecutions!

However, in general, looking at a Depth of Market staircase chart will give you valuable information on how a market really works, and, of course, can be used in conjunction with technical analysis, being the volume of orders a kind of confirmation that a technical tipping point or breaking level is actually having the expected effect on price.

Royal Volume

Every day more foreign exchange brokers design to offer real volume indicators in their graphics software. The information is not as accurate as the Depth of Market and, as I mentioned before, the bigger the broker the better, but it can be useful and is the second-best option. If the broker divides the volume indicated into purchase and sale, you can see in each individual time period not only the amount of purchase and sale but also check if more was sold or if more were purchased. So, for example, if the price is rising to the level at which you think you’re going to spin and see that the volume of sale becomes heavier than the volume of purchase, this can give you a short entry more likely.

Tick Volume

Most Forex brokers do not yet offer the Depth of Market or Real Turnover. So there’s always some substitute for data that could be useful and widely available? The answer is truly yes to both questions, but this is an area that needs to be addressed with extreme caution. This point needs to be re-emphasized: The signal volume is definitely NOT the same as the actual size volume! It is quite true that there have been some studies that suggest that there is a positive correlation between the two, but the theory is far from proven.

There are a number of indicators available on most chart platforms, for example, the volume indicator on balance. All of them are essentially variants of the Tick Volume, so we recommend the use of a pure Tick Volume indicator. If you are using Metatrader4, it is easy to find some useful Tick Volume indicators to download that color candles on the screen depending on whether they have relatively high or lower Tick volumes. Some of them can really do a lot more than that, as I will explain at the end of the article.

The Tick Volume is only the number of price movements made by the Tick graph in the period of time covered by the sail. It is not accurate and does not necessarily reflect the actual volume, but a large Tick volume on a support or resistance level provided can in fact give you a hint on the future direction of prices.

Many indicators for the widely used and extremely popular Forex Metatrader 4 platform have been developed and are in free circulation depending on signal volume. The best of these various colored indicators on each Japanese candle on a table depending on the volume of the signal that occurred while each candle was building. It calculates an average Tick Volume per instrument per unit time and marks particular candles as significant if the Tick Volume during that candle was at least a particularly positive multiple of the average Tick Volume over time.

Some of these indicators also include a way of recognizing particularly bullish or bassist candles based on the size of the range of candles, and when a particular candle has both an unusually large range and an unusually large Tick Volume, the candle gets a special mark which shows that it is likely to be the beginning of a great reversal. Of course, the correct selection of the beginnings and ends of major reversals must be a quick route to Forex gain, although these indicators are far from infallible.

Categories
Forex Basic Strategies

Trading the USD/CAD Pair with Your Swing System

Forex currency movements may look random but when we take a pair, we can notice statistical characteristics. Your trading system is certainly going to have favorites, simply it will be more successful on some than with other currency pairs. Sometimes if you tweak your system based on narrow pair set backtesting, you may find other pairs are not as good. But you should aim to have a universal trading system.

We have presented a few pairs, how and why they might be great for technical swing trading systems as they have peculiarities, unlike some currency pairs that are harder to analyze due to their “ordinary” nature. USD/CAD is one such pair. The USD is the most used currency and has a lot of action moving the trends, traders commonly say it is the currency that drives the bus. This means trends on USD pairs may be suddenly interrupted, false breakouts are often and even president tweets create havoc you simply cannot predict regardless of how good your system is.

Whatsmore, big banks’ attention is on the most traded pairs, and these are, again, the USD pairs. When we mix in the CAD, the United States and Canada are neighboring economies, they have extreme similarities and some professional prop traders even dare to say CAD pairs have made more losing trades than any other major crosses. Still, your system should be profitable here too and you will make a lot of trades on this pair throughout your trading career. So, we go a bit deeper to understand this tricky pair.

In the fundamental articles, you can understand the drivers of the USD and CAD currencies separately. Economies, countries, or currencies that are close, like the AUD/NZD, EUR/GBP, and USD/CAD can be characterized as in positive correlation. Using the basket trading methods, when comparing the currency baskets, traders seek to trade negatively correlated currencies, or when they diverge in value and prioritize them for trading. If history has shown AUD and NZD are mostly positively correlated, some traders will just avoid AUD/NZD pair just based on this analysis. Yet, according to contrarian swing traders, AUD/NZD is the best performing playground for their systems.

USD/CAD pair belongs to this category. When you have economies that run together, you do not have to worry about two event sets for each economy (currency) that may break down your analysis. Also, the news and economic reports are almost copied to Canada from the US. They come out at the exact time and formulated the same way. Non-farm payrolls and employment reports almost always come out on the same day. The importance and effects of these events are widely familiar with traders.

Now, if you are trading on the daily timeframe, the USD/CAD has a “double” event for each currency in the pair on the same day. This means that one candle can be packed with activity. It is suggested that your system should have a 48 hours decision buffer before this event. This means if your system has a signal to enter a trade 2 days before the NFP report or other major event, you should just ignore it. Typically major news events effect is unpredictable, regardless if it is positive or negative for the currency. It is up to the big banks, how and when they will react to this report.

Consequently, this is uncertainty you want to avoid 24 hours before. The USD/CAD pair typically has one candle (day) of calm activity before these reports. So your system or trade will not even have a move to gain from for that day if you have a signal. This is why you should implement a 48 hours rule to avoid trading before the major event for the USD/CAD. It is unlikely your Take Profit target will be reached in one day (Wednesday) before the event. 

One popular research and method that attracts traders is the comparison of the Canadian Oil price with the USD/CAD. The correlation of the Oil price to the CAD can be spotted as positive. When this analysis is carried over to the USD/CAD one could see periods where it holds and other periods there is no correlation at all, be it positive or negative. 

This is easy to test, take a look at the comparison charts. If we compare years, some correlation can be found, but this is not particularly useful to traders. On lower timeframes, months, weeks, daily, correlation is nonexistent. Still, a lot of traders have read some news or articles claiming this correlation, but all you have to do is open two charts. Do this to other CAD pairs or baskets, you will find this analysis does not provide any information you can confidently use for trading.

Similar is for the AUD and Gold, correlation analysis is just not precise enough and not consistent to be useful. As technical swing traders say, you can even ignore every correlation analysis since your system should show proper signals regardless if the correlation truly exists. 

Traders that use higher timeframes than the daily can be classified as investors. They do not trade often, their trades are held for months and are just not what you would define as a forex trader. The investor analysis is heavily fundamental. Does it mean investors’ analysis cannot be applied to day traders? If you are a technical trader, you may ignore long term fundamental analysis right away, if you are open-minded, there are a few tricks some day traders use from the fundamental analysis of the CAD.

From time to time, political events on a smaller impact scale have a critical effect on a currency that just goes unnoticed. In the long term, this can cause a major trend. This trend can be seen on higher timeframes, but your system is probably not accounting for these long periods. According to some traders, movements in the direction of this major trend on the USD/CAD are sudden, extreme in volume, and are very consistent. If you remember the importance of the continuation trades or major trend resume trades, your system should ignore small corrections and take just one direction signals. These signals can be the most frequent type of swing strategy. The weekly chart is the best choice in this case for the USD/CAD, even though it is too high for usual trading. 

Take any of the trend continuation indicators from your system and plug it on weekly. Trade only aligned directions with your system on the daily timeframe and you will notice consistent good trades. After the CAD minister elections in 2015, the USD/CAD took the opposite direction, long direction. Now, regardless of your political affection, trading should not be based on your opinions, ever. If we take economic management knowledge of this particular Canada minister elected in 2015, many would agree he is not the “money guy”. Interestingly, Trump’s election pushed this trend even harder. Trump would want a weaker dollar so this idea is not very logical. However, it was not until the beginning of 2016 the USD/CAD started to correct. 

These continuation trades remained consistent as winners even today in 2020 according to professional prop traders. You can take this tip even if you are a purely technical trader and use the advantage of long term fundamentals that seem to reveal some of the best trades on a not so great currency pair to trade. 

Keep your eyes open for any fundamental analysis or events that are affecting forex in a hidden way. The combination of these and your system will be long term cooperation you will enjoy. If we take the Euro or the EU, for example, many analysts think the union is on fragile legs, any new country to join is a bad idea to them. Well, try to use this information and test it in a similar way using a higher timeframe continuation indicator. Fundamental events or opinions by the investors is not always beneficial, so you will have to test as always. Note that you should not try this right away.

First, you need to master trading the way you like, using a swing trading system or some other strategy. Only once you have consistency year after year you can seek out new markets and new exploits like this one for USD/CAD. Whatsmore, thinking outside your typical trading way could lead to a life-changing discovery. Traders do not have to just follow other experienced traders, more often than not your original research will be more effective. 

To conclude, the USD/CAD, as well as other currency pairs have hidden fundamental gems, but similarly to the popular indicator, popular analysis like the Oil/CAD correlations are not useful. There are better things not in plain sight. If everybody can see the correlations and trade the same way, know the big banks will be hunting for the majority. The example above is just one way how your trading can evolve and should evolve throughout your trading career.

Categories
Forex Basic Strategies

Trading Forex with the Market Gaps

A price gap can offer attractive trading opportunities, both up and down. What are the gaps and how are they traded? Today we will discuss trading with market gaps.

A gap is simply a level at which the price of a share or any other financial instrument moves strongly upward or downward, leaving a visible space on the price chart that denotes the lack of continuity in quotations. These moments can be used to trade with market gaps. A price gap can be observed in all types of periods, but operators usually focus on daily price charts.

“A gap occurs when news generates a strong wave of purchases or sales at a time when the market is not trading or liquidity is low.”

Price gaps are a strong driver for quotes and can occur for a variety of reasons. In general, a gap occurs when news generates a strong wave of purchases or sales at a time when the market is not operating or liquidity is low. In this way, a large number of purchase or sale orders produce a substantial movement in quotes.

Economic indicators or the political news of the day often generate price gaps in the main market indices. In the case of individual actions, performance reports, or important announcements – for example, approval of a key drug for a biotechnology business – are factors that usually impact on quotes and can generate price gaps.

In recent years with the online trading boom and high-frequency trading algorithms, it can be seen that the flow of orders in the markets is becoming faster and faster. This can speed up price movements and generate more gaps in both directions. This is perfect for trading with market gaps.

Some trading algorithms analyze the current order flow and tend to buy when the rest of the market buys and sells when the rest of the market also sells. There are also algorithms that analyze news headlines, for example, to quickly detect if a results report was above or below forecasts. In general, these algorithms accentuate price trends and tend to favour the creation of gaps in quotes. This is why trading with market gaps is increasingly common.

“Trading with market gaps is becoming more common.”

By way of illustration, we can see in the Facebook price chart (FB) a downward price gap recorded in July last year. Subsequently, the chart also offers an upward gap in quotes at the end of January 2019. In both cases, price gaps were due to market reaction following Facebook’s profit reports.

As for the relationship between the opening price and the previous day’s price, we can differentiate four different types of gaps:

  1. An bullish full gap occurs when the opening price is higher than the maximum price of the previous day.
  2. A bullish partial gap occurs when today’s opening price is higher than yesterday’s closing price, but not higher than yesterday’s maximum price.
  3. A bearish full gap occurs when the opening price is lower than the minimum price of the previous day.
  4. A bearish partial gap occurs when today’s opening price is lower than yesterday’s closing price, although it is not lower than yesterday’s minimum quotes.

“The greater the volume of quotes with which the gap occurs, the greater its relevance for operators.”

A full gap, whether bullish or bearish, is generally more important in terms of its significance on price trend than a partial gap. In addition, the higher the volume of quotations with which the gap is produced, the greater is also its relevance for operators.

How to trade with market gaps?

When operating with a price gap, it is important to analyze this gap within the general context of the price trend in the asset in order to position ourselves in an intelligent way.

“In a continuity behavior, prices move in the same direction as the gap in the medium term, while in a reversal scenario they move in the opposite direction.”

In the short term, it can happen that the price shows continuity or reversion behavior after a gap. In a continuity behavior, prices move in the same direction as the gap in the medium term, while in a reversal scenario they move in the opposite direction. It is vital to determine whether we are in a gap of continuity or reversal when trading with market gaps.

It is said that a gap is being filled when after showing the gap the price tends to cover the space that was uncovered. Once the gap began to fill, it is likely that the price will continue in that direction until it is fully filled, as there are no levels of support or resistance that can stop price movements within the gap. This is a way to trade with market gaps.

A typical case of reversal is exhaustion gaps. These occur when the market price has incorporated the news over time, and the gap marks a final boost before the trend change.

Suppose a company is experiencing difficulties and this negatively affects the course of business. In this context, prices are falling. Subsequently, the results report a bearish gap that marks exhaustion in the selling pressure. From there the trend begins to change, as sales orders reached a limit.

On the other hand, a gap in continuity can occur for example if the market expected good news – prices were rising – and business numbers exceeded even the most optimistic expectations. In this case, the results report adds more fuel to the bullish price movement, and a gap can anticipate explosive movements in quotes.

Categories
Forex Basic Strategies

How to Trade with Short Squeezes and Short Sellers?

It is always wise to be aware of the market in general. You must be aware of new trends and adapt to changes in the market. Short Squeezes are undoubtedly one of the best opportunities to look for profitable ideas in 2020. Short sellers are like the new promoters of penny stocks, who sought to inflate the stock by deceiving people. Actually, they’re even better. The former promoters of penny stocks, with their advertisements, emails, and social media posts, were not as good at raising the price of shares as are these short sellers.

Why are these short sellers so good at raising prices? Short sellers are the new promoters. They are great for raising stock prices because they love stocks that are heavily sold and start to rise after positive news for the company. They think the action should fall again.

The difference is that they have not studied. They are not learning the nuances of trading and short selling. When I sell an action, I only do it in cases where we are facing real “bombs”, about to explode, when they have risen artificially. I would never cut short an action that was going up for news on the day of its publication. That’s all these newbie short sellers do: they sell any stock that’s going up a lot. They are basing their theories on the basics of an action. They think that the company should not have such a value, so it will have to go down. That’s why they take advantage of these explosive movements in the hope that the action will fall quickly.

This is not a good short selling strategy. But I hope the short selling trend will continue. It’s great for traders looking to buy stocks. So, how can short sellers get to raise the price? When a stock goes up, all short sellers have to buy their shares to cover their position. The influx of buyers makes the price rise. Then, all short sellers just chase each other out as they increase the price. Or worse, they average. That makes the price rise even more when stocks continue to rise. Dumb short sellers don’t realize they’re the ones who keep the price going up! Let’s look at some recent examples…

Examples of Short Squeezes

Now I will show only 2 recent examples of short squeezes. The first was on January 9. The second was after a positive news release about the company. Not all short squeezes happen the first day an action goes off. Short sellers also go into stocks that are consolidating. Your thought is that the stock price will fall. But then, when stocks continue their upward trend, they begin to be driven from their positions.

Let’s see TRIL first:

Trillium Therapeutics Inc. (NASDAQ: TRIL)

TRIL was in trend for a few weeks before short squeeze. It had a breakup of several days on January 2nd but then consolidated for four days, surpassing around $1.50 on two of those days. All the short sellers thought that was the best price the stock would have. Then, on January 9, the action opened with a gap of up to $1.60. That showed that the shorts were wrong.

The short squeeze continued throughout the day, with the price rising to a maximum of $3.43. The next day, there was a slight setback in the morning. Then it shot up again, further overwhelming the short sellers who thought it was the final climb. No promoter can move stock prices this way. In two days, stocks went from $1.60 to $3.90.

Counterpath Corporation (NASDAQ: CPAH)

We have another magnificent example of a short squeeze. CPAH started shooting up after the hours of January 9. The company released the news that he’s working with Honeywell. The unified communications solution is configured to increase the productivity of mobile workers.

In the specialized press, a Honeywell executive was mentioned. When you quote a large company in a press release, it’s usually good for small business shares. It legitimizes small businesses in such agreements. In the pre-marketing operations of January 10, stocks were down all morning. Short sellers assumed that the bearish trend would continue.

At first, they were right: stocks fell slightly. But then it started to rise with a high volume. Anyone short would quickly see their account in the red. They would have to buy shares to cover their position.

But then the action consolidated for approximately two hours between $2.10 and $2.50. The short sellers were probably thinking “Ok, this is definitely the maximum price at which the stock will go up”. It then broke below the intraday support of $2.10. The shorts took that as a sign that they were right and probably increased their positions. In their minds, this was the end.

The stock dropped to $1.75 where it found support and fell laterally mid-morning. But then it went up again and broke the previous day’s peak. Those big candles on the chart represent all the short sellers who bought more shares to cover their position.

Once stocks were consolidated until midday, short sellers re-accumulated. The stock shot up again, taking all short sellers to buy to cover themselves before closing. Some stubborn ones probably stayed up all night waiting for a slot the next day. Instead, the action ran out and had two big highs in the morning.

You can see how these might be a little more difficult to trade. You have to think the opposite way to what short sellers do. Where are your risk levels? Where will you buy to cover? Once you understand this, you can take advantage of the long side.

History Does Not Repeat…

Remember the old runners. I say things like this because the past usually repeats itself. Actions have their own personality. Traders remember the stocks they trade and the stocks they fail. But trading is not an exact science. Can short selling be a good strategy?

Lately, there are many novice short sellers who give the strategy a bad reputation. So, can it be a good strategy? The short answer is yes. But, again, trading is not an exact science. It’s not as simple as opening a short or bassist position in any stock that’s rising. We must bear in mind that negotiation is always risky, and we must all know that we’ll never risk an amount we can’t afford. You should always consider your risk/reward. He needs a plan for his in and out and where he’ll cut the losses if the operation goes against him.

Short selling can be a profitable strategy. But you need to know perfectly what you’re doing. Some of my most successful students are short sellers. But they only negotiate specific patterns and use rules for each operation. You will want to focus on patterns with better options.

The best opportunities to sell short are when stocks are over-extended when a stock increases several days without a red day. Then, one day it opens up with a gap down. That’s the first time that long traders have a reason to worry. It signals a change in trend. Usually, there is a morning panic as the lengths take profits, and the shorts increase. That’s when it comes to the back of the play and there are better odds of a short.

Categories
Forex Basic Strategies

Trading Forex Majors and Crosses Using The ‘Awesome’ Strategy

Introduction

The Bollinger Bands is a technical analysis tool that uses a statistical measure of the standard deviation to establish levels of highs and lows in a trend. The upper band shows a level that is statistically high, and the lower band shows a statistically low level. The width correlates to the volatility of the market. This means, in volatile markets, Bollinger bands widen while in less volatile markets, the bands narrow.

In today’s strategy, we utilize this feature of the Bollinger band to anticipate a reversal in the market. But Bollinger bands alone are not sufficient in generating reliable signals. Along with the Bollinger bands, we use the Awesome Oscillator to confirm the reversal of a trend. Let us understand how both indicators can be combined to generate reversal signals.

Time Frame

Time frames suitable for trading this strategy are 1 minute, 5 minutes, and 15 minutes. Therefore, this a perfect strategy for ‘Scalpers.’

Indicators

Three indicators are applied to the chart listed below.

  • Bollinger bands (20,2)
  • Bill Williams’ Awesome Indicator
  • Exponential Moving Average (EMA)

Currency Pairs

The ‘Awesome’ strategy should ideally be traded with major forex currency pairs only. Liquidity and volatility are especially necessary for the strategy to work at its best, which is provided only by major pairs. Some preferred ones are EUR/USD, USD/JPY, AUD/USD, GBP/USD, GBP/JPY, EUR/JPY, CAD/JPY, and NZD/USD.

Strategy Concept

Apart from the Bollinger band, we use the awesome oscillator indicator that attempts to gauge whether bearish or bullish forces are driving the market. It market momentum indicator, which compares recent market movements to historical movements. It uses a line in the center, either side of which price movements are plotted according to a comparison between two different moving averages. We use this awesome oscillator to forecast a shift in market momentum and whether the prevailing trend will continue or reverse.

We look for ‘buy’ opportunities when EMA crosses up through the middle Bollinger band. At the same time, the Awesome Oscillator should be crossing above the zero levels. This is the first part of the reversal. We execute a ‘long’ trade at the ‘test’ of the previous ‘lower high’ that is a part of the earlier trend.

For ‘sell’ trades, we are looking for the opposite conditions of buy trades. The first condition being that the EMA crosses below the middle Bollinger band. At the same time, Awesome Oscillator also crosses below the zero-line. Finally, we enter at the ‘test’ of the ‘higher low’ of the previous trend.

A stop-loss a placed below the lowest point of the downtrend in an upward reversal while it will be above the highest point of the uptrend in a downward reversal.

Trade Setup

In order to execute the strategy, we have considered the 5-minute chart of AUD/USD, where we will be illustrating a ‘long’ trade. Here are the steps to execute the strategy.

Step 1: The first step is to identify the direction of the market. We can do this in two ways. If the price is making higher highs and higher lows, the market is said to be in an uptrend. While if the price is making lower lows and lower highs, the market is in a downtrend. The trend becomes clearer when price moves in a channel and plot the same on the chart.

In the case of AUD/USD, we have identified a downward channel, as shown in the below image.

Step 2: After identifying the direction, we need to wait for a reversal in the market. We can say that a reversal is taking place in the market when price breaks the trendline and starts moving in the same direction. Trendline break is not enough. Here’s where the indicators Bollinger band, EMA, and Awesome Oscillator come handy.

In case of a downtrend, the reversal is confirmed when EMA crosses above the middle line of the Bollinger band, and the Awesome Oscillator moves from negative to positive zone. While in an uptrend, the reversal is confirmed when EMA crosses below the middle line of the Bollinger band and Awesome Oscillator goes below the ‘zero’ level. However, we do not enter the market soon after this, where we need one last thing before that.

The below image shows that when the price is not able to make another ‘lower low,’ it reverses to the upside and breaks out of the channel. At the same, price EMA crosses above the middle line of BB, and Awesome Oscillator becomes ‘positive.’

Step 3: Now, let us discuss how to enter a trade. In a downtrend reversal, we enter the market for a ‘buy’ when the price tests the ‘lower high’ of the earlier trend and puts up a bullish candle. This is when we enter with an appropriate stop-loss and take-profit. Similarly, in an uptrend reversal, we enter for a ‘sell’ when price tests the ‘higher low’ of the previous trend and puts up a bearish candle.

As shown in the below image, we enter ‘long’ only when the price reacts from the ‘lower high’ of the previous downtrend and moves higher.

Step 4: Lastly, we determine the stop-loss and take-profit levels for the strategy. In a ‘buy’ trade, the stop-loss is placed below the lowest point of the previous trend, nothing but the lower low. While in a ‘short’ trade, it is placed at the highest point of the previous trend, nothing but the higher high. The take-profit is set in a manner where the risk-to-reward of the trade is at least 1:1. But since we are trying to grab a major reversal of the market, we move our stop-loss to break even once the market gets closer to the take-profit area.

Strategy Roundup

While it can get take a lot of effort to apply all the rules of strategy, it gets easier after little practice. Pay attention to the Awesome Oscillator, where it clearly indicates the shift in momentum in the market. Aggressive traders can also enter the market without waiting for additional confirmation from the ‘lower high’ or ‘higher low.’ All the best.

Categories
Forex Basic Strategies

How to Use Rebates to Reduce Spread Expenses

What is a rebate and what do you need the rebate service? How can you go about reducing spread costs? Read our step-by-step instruction for using broker rebates to reduce the costs associated with spreads.

Rebate is a type of refund (cashback) or partial compensation to the trader for its costs. In general terms, the model is as follows: the trader registers on the rebate service page and through the affiliate link passes to the broker’s website, opens an account, operates, and pays the spread (markup) to the broker/market. The broker transfers a part of its commission (spread, markup) by the customer attracted through the rebate service, which in turn refunds a part of its profits to the trader. Everyone is very happy. Pay attention to this reading if you want to have more detailed information on how the rebate works, its advantages for traders and brokers, and on how you can get a refund.

Tell me, did you know that trading costs can be reduced in part, that is, the amount deducted by the broker as a spread (markup) can be returned to your account? For the trader, it is completely free. And if we have such an opportunity, why not take it?

What Is a Spread Rebate?

Rebate is a partial spread compensation to the merchant. This is the most common definition on the Internet that needs to be clarified. The spread is the difference between the purchase price and the sale price of a financial asset and the STP or ECN type order processing model is formed by liquidity providers or business conditions. Using the rebate, the trader receives a partial compensation only from a part of the spread, which is the broker’s commission (the markup is the so-called broker’s surcharge on the spread).

The rebate is made regardless of whether the transaction is profitable or not. The periodicity of the surcharge is varied and depends on the conditions of the broker/rebate service: daily (for the closed trading day), weekly, monthly. The calculation formula may also be different for different accounts, for example, the spread percentage or fixed amount for each lot. Some brokers have differentiation: by turnover of up to 10 monthly lots – an amount of compensation, for a turnover of more than 10 lots – another amount, higher.

Rebuttal may be granted:

Straight down the corridor for his clients. This type of cashback and information about it is usually placed in the share and bond programs section.

For third-party resources, an independent rebate service that fosters cooperative relations with dozens of corridors.

You cannot be a participant in the spread compensation affiliate program and register at the broker’s site through the rebate service. You must choose one of the options, and both have their advantages. Most often they are the brokers who have the most compensation, as the partner chain does not involve an additional intermediary, with which they will also have to share.

Advantages of the Rebate Service

Distribution of the merchant’s monetary flows. In the first case, the merchant’s money (both the deposit and the rebate) remain under the control of the broker. In the second case, the compensation is deposited into the account opened at the rebate service. And if the broker-“cooks” under different pretexts refuses to withdraw money, the trader may at least withdraw the rebate. The consolation is small, but something is something.

Rebate service as a consolidation platform. Among the partners of the rebate service, there can be dozens of brokers who expose on the platform both the commercial conditions and the conditions of rebate. In other words, all trading conditions are collected here and the trader only has to analyze them instead of exploring dozens of websites. On the other hand, is there always relevant data on such a platform? In addition, the trader loses the opportunity to assess the advantages of other brokers.

Rebate service as a rating and analytics platform. Such positioning means that the platform creates a rating of brokers with the best trading conditions, better spread compensation conditions, and builds ratings based on the opinions of merchants. Can the objectivity of such ratings be trusted? Rhetorical question.

Compensation fund. Some rebate services declare the availability of the compensation fund which assures the trader of the potential loss of investments. It is true that it is unknown how it is formed. Also, about such payments, I personally have never heard of.

Free legal assistance. Another service that may have some rebate platforms. According to the owners of these platforms, they are willing to help in any way and defend the interests of traders in the event of disputes that may arise with the broker.

At first glance, it is best to receive spread compensation through the rebate service. But most of the reported benefits are only theoretical.

How Does it All Work?

In general terms, the operating scheme for the membership of the rebate service, broker, and the trader is as follows:

The trader registers on the website of the rebate service. The profile is necessary to be able to monitor the rebate statistics on all accounts. On some rebate platforms, the money is deposited into the account, opened together with the profile (Customer Area balance). You can then withdraw or transfer to a commercial brokerage account. On other platforms, money is immediately deposited in the commercial account because they are linked through the identification code.

The trader follows the affiliate link on the broker’s website, with which the rebate platform has an agreement. Open a real business account, check, start trading. According to the rebate offer, the trader will receive partial compensation. How much, where, and how – individual offer conditions. Now about how much you will receive from the compensation. The conditions of each forum runner are different. Even, they may differ in different trade accounts of a broker. I will give two examples.

Example 1. Broker «A» offers a 70% spread compensation on the Classic account, 80% of which the trader receives. In other words, the broker pays 70% to the rebate service, 80% of this amount is transferred to the merchant’s account (normally such conditions are indicated on the website of the service). The calculation of the compensation is as follows:

-The trader operates a daily volume of 0,25 lots. During the 20 working days of the month, the turnover will be 5 lots.

-For the pair EUR/USD with 1 lot of 100,000 units the price of a point will be $ 10. (for 4-digit quotes!).

-Spread in the account is from 2 points (I take the minimum value).

The spread costs for the trader will be 20 days: 5*10*2 = $ 100. This is the sum of the costs that the trader could have lost by working with the broker directly. 100*0.7 = $ 70 is the broker’s compensation. 70*0.8 = $ 56 is the sum of the rebate. The trader’s actual costs will be 100-56 = $ 44.

Example 2. The broker «B» offers compensation of $ 8 in the Classic account for each lot, 80% of which is returned to the trader. Here the calculation is even easier. The trader’s costs for a turnover of 5 lots is $100 (from the example above). The sum of the rebate is $40. (5*8). The merchant receives $32. (40*0.8) and its actual costs are $68.

The examples given are approximate. No one forces the trader to calculate by hand, but when choosing a rebate service the trader has to take into account the approximate figures to compare them with each other. Almost all rebate platforms on the website have calculators. It is logical that they cannot calculate the floating spread. In addition, the fixed spread is also of the minimum value in them. They are valid for comparison, although the actual compensation figures, of course, will not match those of the calculator in most cases.

Advantages of Rebate for Brokers and Traders

Logical question: why does the broker need to share his commission with the trader and even with the rebate service that serves as an intermediary?

Marketing tool. Different types of actions, loyalty programs and etc. are more effective than a simple discount (in this case, spread). In short, it is not enough to reduce the spread, it is also necessary to offer the trader additional “goodies” so that he can see that they take care of him and feel special.

Encouragement. Another psychological aspect of the rebate that encourages the trader to increase turnover, since the more you operate, the greater the compensation. In addition, with the size of the rebate, the broker can encourage the trader to work with less popular or higher risk assets by offering a higher level of rebate.

Outsourcing. Each broker is interested in attracting as many active traders as possible. Affiliate and rebate programs can be considered as outsourcing tools. By consciously marketing the brokers attract the traders and the brokers share their commission with them.

Advantages of the rebate for merchants:

Saving money. The trader loses nothing. Registration in the rebate service is free, with no fees or membership fees. It only takes a little time to control the profile of the rebate service, but in the rest, the trader only wins.

Implementation of strategies that can be disadvantageous without challenge. These are strategies in which spread forms a significant part of commercial costs:

Scalping. Let’s see an example: in the spread of 2 points, the trader must set the target of at least 3 points. If you are compensated for 50%, you can afford to lower the bar.

Algorithmic trade with high-frequency tactics, including networking.

“Exotic” trade characterized by a widespread due to the low level of liquidity.

Psychological support. Loss for many traders is an emotional shock and stress. The rebate, which is paid even for unprofitable transactions (i.e., reduces the size of losses) is a small consolation prize.

How to Select a Rebate Service

Runner needed on the list of partners. The potential trader may choose a rebate service rating broker, but I would recommend taking it as a starting point otherwise. Spread compensation is not the primary criterion for selecting the broker. Therefore, first, decide with whom you are willing to work and only then look for a company from the list of rebate services. This refers, above all, to active traders: if your broker is not on the list of partners, then bad luck, but this is not the reason to change the broker.

Compensation conditions. Typical error: the higher the compensation amount, the better. On the one hand, a large refund sum may indicate that rebate service has so many customers that it can afford to share most of its profits. On the other hand, it can be a scam to attract a potential merchant in any broker’s “your” rating. Consequently, you will also have to pay attention to the possibility of a daily surcharge for the compensation: after one day you will understand whether the figures correspond to the real ones or not. Follow your interests, goals, and intuition.

Frequently Asked Questions

How do the rebate services differ from each other?

The terms and conditions of the broker affiliate agreement and refund service. The amount that the broker transfers (lump sum or percentage of the trader’s spread), the frequency of the refund (every day, once a week, etc.) – all this at the end indirectly influences the amount of compensation, which is the main criterion for choosing the service.

Conditions for compensation for counter-trader service. It depends on the “greed” of the refund service: what part of your commissions are you willing to share with the customer?

Additional “goodies” for rebate service customers. Additional broker bonuses for customers registered through the service. As a general rule, they are immaterial, for example, 125% as a welcome bonus instead of 100% at the time of direct registration.

Here it is worth adding the safety of the service, as the trader runs the risk of not receiving the refund by relying on an unfair rebate service.

What risks does the trader run by collaborating with the broker via an affiliate link in the rebate service?

As a first comment, I would like to repeat very carefully that the trader does not take any financial risks. He does not pay commissions or fees. At worst, you risk simply not getting what you promised, but you will not lose more than you have. However, there are some risks:

Risk of wasting time. Study the conditions of compensation, pass the verification, and ultimately get nothing.

Reputation risk. Verification involves the provision of personal data to the service. From the security point of view, this is justified, although on the servers sometimes there are hacks. In addition, there are other ways to steal personal data from merchants. The more intermediaries there are, the greater the chance of hacking.

Risk of getting carried away by emotion in pursuit of rebate (cashback) forgetting compliance with the rules of risk management. And, obviously, it is necessary to comment that the passwords of the profiles in the broker and the rebate service must be different.

What if the amount of compensation is not what the trader expected, or if it has not been transferred at all?

Reread the compensation conditions and calculation formula. The examples shown in the above readings are approximate and do not take into account many details. For example, with floating spread it is possible to calculate the compensation in the spreadsheet (downloading the history), but the question is whether it makes sense to waste time.

Other steps are standard: type a question to the rebate service support, capture the screen of each step, and each answer. If necessary, you can connect to the corridor as well. Please note that the operation of rebate services is not regulated, so there is no point in having regulators.

Is the swap refunded?

No, and that’s logical because of the nature of the swap. The swap is formed by the difference in interest rates, the rebate is a part of the broker’s commission.

How is the spread refunded if the spread is the difference between the purchase price and the sale, established by liquidity providers or market conditions?

Sensitive issue. The phrase “Rebate is a partial spread offset” is simplified (as, for example, no one talks about trading with Fórex CFDs, omitting this term). The spread that the trader sees is the difference between buying and selling an asset + “markup”, the broker’s commission. He is willing to share a part of this commission, and this is a good sign for the trader: if the broker markup is 50% and is ready to refund 80% of the spread, it is better to ask if it is not a company-“kitchen”. And if not, what is the excess in the runner’s spread, if he is willing to give that difference?

How can the rebate be received from several brokers/services at once?

A particular account can be linked only to a particular rebate service:

You can open two accounts with a broker through the affiliate link of two rebate services. To one account will be deposited a rebate, to the other – the second.

You cannot open an account and link it to two different rebate services.

In a rebate service, you can open any number of accounts with several brokers.

Is the 100% rebate reward real?

If you actually received such compensation, it is infallible that you disclose the name of the broker and the service. In theory, such a rebate exists, but it’s rather promotional and it’s a marketing tool. Think about it, who will share all of their revenue?

How do you combine the rebate and bonuses?

While trading takes place in net bonds (not traded), it will not open any rebate. Once the bonds are converted into your own funds, you can count on compensation.

Contest the runner or contest through the service: what is better?

Brokers, who are partners in rebate services, can offer their own rebate. But the combination of both refunds in one account is excluded. What’s better? You decide. Someone has no desire to waste time on additional registration. For some, the terms and conditions of service will seem more profitable. So there is no single recommendation for all.

Categories
Beginners Forex Education Forex Basic Strategies

What is the “Averaging Down” Strategy?

Averaging down or down-averaging is a term that describes the process of buying additional amounts of shares of an asset or financial instrument (such as Forex or commodities) at prices lower than the original purchase price. This reduces the average price paid by the investor for all of their purchased assets. Therefore, it is a strategy used to reduce the average cost in a market that has fallen in price. Is averaging down a good strategy or just another way to lose money in the market?

The answer depends on several factors. First, let’s describe how it works. You buy 10,000 shares at $100 per share, but these shares fall to $92 per share. You then buy another 1000 shares at $92 per share, which reduces his average price to $96 per share. It is true that this is a simplistic example, but we will describe the concept in more detail later.

Although it may seem to make sense, and actually sometimes works, it presents a great deal of risk. The price has to go up after the averaging is done. How many times have we acquired a stock that started to go down, invested more money after it went down, and continued to put more and more money in with the hope that the price will go up? Eventually, the point comes when we surrender and throw in the towel, shortly before the stock starts to recover. This is a very common scenario and it causes the ruin of many traders.

Description of Averaging Down Strategy

Although averaging downwards offers the appearance of a strategy, it is more a state of mind than a legitimate investment strategy. In theory, if an investor likes a stock at $35 per share, and the share price drops, but the investor still finds the stock attractive at 35, then buying more shares at a lower price offers the appearance of a discount. While there may be an unrecognized intrinsic value, buying additional shares simply to reduce the average investment cost is not a good reason to buy a share or other asset in the market as its price drops.

Averaging down allows investors to reduce their cost base in a given market position, which can work well if the market starts to rise as it allows the operator to acquire more assets at a lower price and increase its future profits. However, if the market continues to fall, capital losses will only increase further. Proponents of this technique see averaging down as a cost-effective approach to wealth accumulation; opponents see it as a recipe for disaster. In leveraged products like Forex and CFD, this practice can lead to large losses in a short time.

The strategy is often favoured by investors who have a long-term investment horizon and a counter-investment approach, that is to say, contrary to market consensus. An opposite approach refers to an investment style that is against, or contrary to, the prevailing investment trend. Here again, averaging can be a general rule: buy when there’s blood on the streets.

Interestingly, over the years, some of the world’s smartest investors, including Warren Buffett, have successfully used the averaging down strategy over the years. What also gives the illusion that this technique is an investment strategy. However, investors like Buffet can buy additional shares of a company because they feel that the shares are undervalued, not because they want to «lower the average». In addition, they have large capital resources that allow them to withstand a market downturn lasting months or years.

Is that a great strategy or not? If we average in a market that’s down and suddenly the price starts to rise strongly, then we’ll say what we did was a great strategy. However, if the market continues to fall, we must make the decision to keep averaging down or close positions to limit losses. At this point, much depends on the analysis of the market in which we are operating. If we are applying averaging down to fight price stubbornly in a market whose fundamentals clearly indicate that it will continue to fall, it is simply a gamble and a sure recipe to disaster.

On the contrary, if we have conducted a thorough analysis of the market and this study tells us that there is a likelihood that the price will start to rise, the downward averaging may make sense as long as we apply it sensibly following monetary management rules. In any case, we must always have a limit of losses as the market can be unpredictable and it is always good to have a safety net.

Stock Example

To show the difference between applying averaging down without a solid foundation and using this strategy based on more logical analysis and methodology. Let’s use it as an example of the difference between investing in a stock and investing in the company behind the stock.

If we are investing in an action, taking into account only the action of the price, we look for signs of purchase and sale based on a series of indicators. The goal is to earn money in the short and medium-term and there is no real interest in the underlying company beyond how its action might be affected by the market, news, or economic changes.

In most cases, much is unknown about the underlying company to determine whether a price drop it’s temporary or we’re talking about a big problem. The best thing to do when investing in shares under this approach (as opposed to investing in a company) is to reduce losses by no more than 7%. When stocks fall to this point, positions are closed and new opportunities are expected.

Invest In a Company

If you are buying stocks from a company (as opposed to a share), the investor has carefully researched and knows what is happening within the company and its industry. You need to know if a drop in stock price is temporary or a sign of trouble.

If you really believe in the company, averaging down can make sense if you want to increase your holdings in the company. Accumulating more shares at a lower price makes sense if you plan to hold them for an extended period.

This is not a strategy that should be used lightly. If there is a large volume of sales against the company, the investor may want to ask if they know something he does not know. These investors, who are making massive sales, are almost certainly mutual funds and institutional investors. Swimming upstream can sometimes be profitable, but it can also cause an account to be lost in a short time.

Averaging Down in Other Markets

Any market this strategy should be employed very carefully or avoided altogether if the trader does not know what it does, especially in leveraged markets like Forex or CFDs where profits and losses are magnified. In fact, this is how many traders lose their accounts. They continue to buy in heavily bearish markets in the hope that the price will rise to the extent that the losses that have accumulated are such that the inevitable ‘margin call’ arrives.

Many traders, especially beginners, have the tendency to «fight» against the market and when it starts to move against, do not bother to investigate because the market behaves in this way and simply start to open up positions contrary to the trend. In a market like Forex, where trends can be very strong, these traders end up losing big sums in a short time.

For example, a change in the interest rate policies of a major central bank such as the Fed or the BoE, are capable of shaking the market strongly and changing long-term trends. A trader who stubbornly trades against these moves and continues to add positions is only committing suicide.

Very different is when a trader adds more positions in a market whose fundamentals favor him and where the price is against him temporarily, more for technical factors than anything else. For example, it may happen that a currency pair is in bullish trend and the trader bought during a bearish correction that spread more than expected. In this case, the trader can average, to a certain extent, since he knows that the price has high chances of going back up. As we see, much depends on how the trader applies the strategy.

Who Should Apply Averaging Down?

The following table shows which types of investors can apply the averaging, and how to reduce the risk in case the market continues to fall. Here are some definitions of the main types of strategies.

Buy and Hold: It is a strategy where a person or company invests in an asset, such as an action, often for years. They are not interested in speculating on the purchased assets and their short-term movements, as they expect them to have an increase in long-term value that they can take advantage of.

Position Trading: A position trader is willing to invest in a market for months and even years until the signs of a major change in trend become evident.

Swing Trading: Swing trading operators try to take advantage of the trend movements of the market by trying to enter near the trend lows or trend highs, to win with the bullish and bearish price swings of the short and medium-term. The period in which operations are kept open is short, often for weeks or months.

Day Trading: A day trading operator conducts short-term trades where each position is usually closed before the end of the trading day.

Trading style, is it convenient to use averaging down?

Buy and Hold

Yeah, but be careful in a bullish market. Check your investments to make sure the fundamentals are still in good shape and that the technical aspects are attractive. Fibonacci setbacks work well in these circumstances. Measure the previous price increase from the minimum to the maximum of the movement and if you want to apply averaging down make the additional purchase around the Fibonacci retracement of 61.8% of the previous bullish movement. In a bearish market, then it’s best to wait. Otherwise, it’s like catching a falling knife. It can be a pretty dangerous process. Why risk it? Wait for markets to appear.

Position Trading

Yes, but it must hold the positions long enough for the market to recover and it must only be used in a market with the right conditions, that is to say in a bullish market. Ensure that the sector is also growing and that the fundamentals favour it so that any downturn in the market is due to short-term factors (as in the case of a stock with a bad quarter in a company with promising projections for the next quarter).

Swing Trading

Probably not. If we go in too early, expecting a change in trend and the price continues to fall, we can average down if the market and the industry are going up, but we do this only once. If we are tempted to average a second time, it is best to close the losing position and accept the loss. Remember, you are supposed to be a professional. Admit your mistake, take the loss, and continue.

Day Trading

No. As a day trading trader, the trader must leave before the end of the day and we have no guarantee that the price will be recovered at closing. A day trading operation should never be allowed to become a multi-day position. It is common for a trader to quickly lose their funds that way.

Categories
Beginners Forex Education Forex Basic Strategies

The World’s Most Dangerous FX Trading Strategies

It is vital that you have a strategy when trading, the strategy is what lets you know how you can get in and out of your trades as well as containing the risk management for your account. So it is important that you have one, however, you need to consider what sort of strategy you are planning to use, the fact is that there are good strategies and there are bad strategies. A bad strategy does not necessarily mean that it will make you lose. Some of them can actually make you a lot of money. They are often considered bad because of the risks involved or the inflexibility that they have when things go against you

So we are going to be looking at some of the strategies that a  lot of people consider bad, remember, it doesn’t mean that they do not work, it just means that there are some very obvious flaws in them that the markets will not be afraid to exploit.

The Martingale Strategy

If you have been involved in trading or gambling or pretty much anything to do with investing then you most likely would have heard of the martingale strategy.. It first became popular casinos, specifically on the roulette tables and later on Blackjack tables. The idea behind it is simple, place a $1 bet and place it on red or black, if it wins, you double your money, if it is wrong you lose. If You lost, the next bet you put a $2 bet on the same color, if it wins you are -$1 + -$2 + $4 so $1 in profit, if it loses, you double again. So a $4 bet on the same colour, this method will continue until there is a win when you win, you will always be that $1 up.

Sounds good right? In principle you will always win that $1, there is no way that you cannot, well apart from the fact that you do not have unlimited money. Let’s say that you have a balance of $1,000, how many times do you think you can put a bet on using his strategy? 10? 20? 50? In fact, your $1,000 account could only manage to put on 8 trades, just 8, if all 8 lose then you will blow that account. The only way that the Martingale strategy works if you have $an unlimited amount of money. The thing is, people know what you are doing, the casino world got around it by limiting the maximum bet that you can make, so you can only get 4 or 5 bets on before it becomes unprofitable.

So how does this work with trading? It is pretty simple and works exactly the same way, you place a 0.01 lot long trade on EURUSD, it, unfortunately, moves against you, so you decide to open up another position, this time though it is at a 0.02 lot size. This means that the markets do not need to move as high in order to make the overall positions profitable. However, if it goes south, you now have 0.03 lots adding to drawdown. So you add another position, this time 0.04 lots, the markets gain you do not need to go as high to get you out. But as it continues the wrong way, you have 0.07 lots going against you. This can continue because when the markets go on a strong trend, and if they do, it will continue to drag you down. If you keep adding positions until your margin no longer available, your account will eventually be depleted. 

If it is so risky why do so many people use it It is simple really, it is by far the easiest strategy to get into and to learn. There is very little to learn at al. Some people can literally just stick a  random trade on, regardless of the markets and the direction doesn’t matter. It is a complete gamble to them as the market will eventually turn right? It is also the easiest trading robot to create, which is why there are so many of them out there for sale. If you go to any trading robot marketplace, a large percentage of them will be using a form of this strategy, simply because it is a quick and easy strategy to use, although it is also by far one of the most dangerous.

We would advise sticking clear of this strategy unless you love to gamble and do not mind losing all the money that is already in your account.

Grid Strategies

A grid strategy is actually very similar to the Martingale strategy, the main difference is that with a grid strategy, there is not an increase in the bet or lot size that is being used, they often also have a number of different ways of getting out of trades. While the drawdown and lot sizes do not increase quite as dramatically, it does post a lot of the same risks and is still considered as a very dangerous strategy to use.

The strategy takes a very similar pan as the Martingale strategy does, as things go against you, you open up additional trades in the same direction, the main difference between this and the Martingale strategy is that the size of the trade is consistent, it does not increase with each additional trade.

There are also some differences in the way that the trades close, the grid strategy will generally do this in one of two ways. It will wait until the markets change direction and will then close the entire basket of trades once it goes into profit. The other method will close off the most recent trade when in profit and then close off the oldest trade or part of it so that the overall position that is closed is profitable. This will slowly eat away at the first trades that were made, eventually closing them out.

Much like the Martingale strategy, this has a lot of potential for the drawdown to begin to grow exponentially depending on how many positions are open, this is another reason why many more experienced traders would advise you to steer clear of this strategy.

Mass Scalping

Not the official name for it, but this is a simple strategy when you are trying to grab as many 2 to 3 pip wins as you can, sounds easy right? The problem with this strategy is that it can get out of control very quickly. It’s only 3 pips, right? Easy, most trades move to that position at some point right? Wrong, trades can continue to move against you, but you haven’t planned for this so when do you decide to get out of the trades? They could be taking away the profits of the past 20 or 30 trades. As you are putting on so many, it can be quite hard to keep track of everything and this will only lead to complete disaster and ultimately a loss of your account.

Strategies Using too Many Pairs

Not a specific strategy, but there are a lot of strategies out there that tell you to diversify and to trade a lot of different currency pairs at the same time. It is far better to have a strategy that focuses on one of two different assets. You need to remember that different currency pairs and different assets all move differently, there are different elements and factors that dictate whether they go up or down. In order to trade all of them successfully, you need to have an understanding of them all, this is just nothing that is practically possible in the real world.

Do not use strategies that trade 20 different pairs, it will be confusing and you won’t be able to keep up, let alone know why you are making those trades. Stick to strategies that specialise on one or two strategies, you can then expand into other strategies that work with other pairs instead of using one that claims to work with them all.

So those are just a few of the strategies that you really should avoid, they may well work for a short time, but the risks that they bring and put on your account only means that at some time in the future, they will blow it, so try and stick to those less risky strategies, even if they are giving you slightly lower yet more realistic returns.

Categories
Beginners Forex Education Forex Basic Strategies

Simple FX Scalping Strategies to Put to the Test

The fact that you are here means that you most likely know what scalping is. For those that don’t, scalping is one of the fastest styles of trading, you are looking for very short term profits putting on a vast amount of trades. It is also considered to be one of the riskiest trading strategies that you can do as it is far harder to put proper risk management in place due to its quick nature. It is the main strategy style that many in the outside world would compare to gambling, simply due to the fact that you are putting on so many trades in the hope that more win than lose (that is how it is seen from the outside). Even with its risks, this does not mean that you should not take it up as your main style, a lot of people make a lot of money out of it.

Before we get into some of the easy to use strategies, let’s just outline exactly what scalping is, as many have a misconception as to what is involved and some even see it as the easy route to money, which we must point out now is certainly not the case. Scalping is all about putting on small trades trying to make small profits, normally between 5 to 10 pips. When done over a longer period of time these small profits all add up to larger profits. For this reason, you are required to use an account with low spreads and preferably low commissions too. When scalping one bad trade could potentially wipe out the profits of 4 or 5 good ones, which is why it can be so risky.

In order to be a good scalper, you need to have the right mindset for it, there is a lot of stress that comes with scalping, you need to be able to deal well with it, you also need to be able to deal with a lot of risks, if you are a very risk-averse person then you may struggle to keep scalping for long, as you will always be putting extra risk on your account. You also need a broker with pretty good servers, as scalping is so quick, you need a broker that is able to activate the trades quickly, this also goes for your trading platform. If there are any delays within the platform when communicating with the broker, it could be the difference between a winning trade and a losing one.

The other thing that a scalper needs is volatility, if the markets are not moving then there is very little chance or opportunity to make any profits. It doesn’t matter if h markets are moving up or down, just as long as they are moving. If the markets are not moving at all, then it may be time to take a break or think about a different style of trading for the time being. You need to learn how to read charts and how to get them quickly, scalpers normally use charts ranging from the 1-minute chart up to the 1-hour chart, charts any bigger than this will not really be useful as you are looking for smaller movements rather than large ones. Some people decide to scalp before, during, or after major news events, this can be very profitable but also very risky, so unless you know what you are doing, we would advise avoiding the news.

So we know a little about scalping, now let’s take a look at some of the more simple scalping strategies (in no particular order) that you could try out.

Volume and Price Action

When using this strategy it is required that you eat a few volume indicators to help you look for price action, the strategy is based on the idea that changes in volume are normally then followed by some price action. So in that way, the volume will act as your signal and the price action would then act as your confirmation. When the volume is low, it can be an indication that the trend is beginning to slow down and that a reversal may be approaching, or that it needs to take a break before then continuing the trend. Scalpers need to see their patience when the markets are ranging, they need to spot volume spikes alongside the price action, attempting to buy or sell before the price moves. If you are planning on using this strategy the be aware of where you get the information from, if it is a broker give statistic then it may only be taking into account the orders that they themselves are fulfilling, you won’t be able to get an entire picture as to what the actual volume is, but some indicators make a god job of it.

Exponential Moving Averages

This strategy relies on EMA (exponential moving averages) indicators. You most likely would have heard of them at some point through your journey. The EMAs are pretty easy to use, they work by showing us the underlying trend that is currently behind a forex pair, it does this by showing the average price over a certain period of time instead of showing you the current price. The strategy is pretty straightforward, when the price is above the EMA then it can be a signal to sell, when it is below the EMA then it can be a signal to buy. It is recommended that you use more than one EMAIL though, it helps to improve the accuracy of the signals that you are receiving. Using a slower and a faster EMA, one on the 10 EMA and one on the 20 EMa seems to work well, a sell signal would be when the price reaches the lower EMA, a buy signal would be when the price reaches the higher EMA.

Stochastic and Trend Lines

To use this strategy you will need to use the Stochastics indicator as well as trend lines. Stochastics is pretty straight forward, it basically helps to measure whether something has been overbought or oversold, if it is above 80 then it is classified overbought, and below 20 as oversold. This strategy works best during an up or downtrend, you need to draw the trend zones onto the chart, either yourself or using another tool or indicator. The strategy works by looking for the trend line, when it is met or crossed, you would then use stochastics to look for it being oversold or overbought as a signal to enter the trade. It is a slightly safer strategy as it requires two conditions to be met, the trends one and the stochastic is another.

Dynamic and Static Support and Resistance

This is a strategy that is pretty much entirely based around support and resistance levels. The static support and resistance levels refer to the levels from the beginning of the day, the highest and the lowest points. It is best to identify these when you first start trading. Dynamic support and resistance levels on the other hand are always changing and depend on the market movements and fluctuations, they can be a lot more subjective than static levels, someone may have certain levels while another trader may have different levels. This strategy will look for where the static and the dynamic support levels meet, these will be your buy and sell positions. You can use other indicators as confirmations, but the strategy is simply where the two trend lines meet.

Bollinger Bands

One that you most likely would have heard of as it has become increasingly popular. Bollinger bands are used to help you see volatility, the further they are from the centre, the higher the levels of volatility. If the bands are close together then it means that the markets will most likely be ranging and for a scalper, this is a time to avoid trading. The strategy is simple, when the prices are by the upper band then you sell, when the prices are at the lower band then you buy. It can be done in a ranging market but it is far more difficult to be consistent in a ranging market. Try and set a stop loss around 10 pips above or below the bands in order to keep tight stop losses but to also allow a bit of movement.

So those are a few of the strategies for scalping which are regarded as pretty straight forward, not all strategies will work in all situations, it is also important that you do not try to over complicate things, if you do then you could end up confusing both yourself and muddying the signals that you have been receiving. Make sure you are also backtesting your strategy and also trying it out on a demo account to ensure that it is both consistent and that you are able to successfully implement it as well as fully understand h signals that you are receiving. Scalping can be very profitable, but also very risky, so practice, practice, practice, and then practice some more.

Categories
Beginners Forex Education Forex Basic Strategies

Let’s Discuss Get Rich Quick Trading Strategies

A lot of the adverts that you see around the internet all seem to be based around the fact that you are able to get rich pretty quick, even overnight when trading, but is this actually the case? Can you actually get rich overnight, or is that just a fantasy?

The truth of the matter is that you can in fact get rich quick overnight, it certainly is possible, is it likely? That is another question and one that is a resounding no, so you can get rich, but you are far more likely to lose any money that you put in rather than making more. We will point out straight away, that while he adverts may say that you can get rich quick, you certainly won’t with them, those sorts of adverts are complete scams and should be avoided at all costs.

There are a few different strategies that you could use to get rich pretty quick, again we must point out that we are not recommending that you try these strategies, there is probably a 0.01% chance that you can sustain them for more than a day or two and so they are ultimately a sure-fire way to lose your money and to blow your account. So let’s take a little look at what these strategies are.

Double or Nothing

The name pretty much suggests what this one is, it is pretty much like flipping a coin, you will either double your money or you will blow your account. It is certainly not something that you should be doing unless you are pretty heavily drunk and are happy to throw away whatever money you have lying about. You will simply put on a trade with a much higher trade size than you should, place a take profit at the point where the balance would double, place, and sit back and see what happens. Some people put it to a 10 pip movement to blow, others a bit more, but people who do this are often looking for a quick turnaround, so it will normally only take a few pips up or down to either double or blow the account. I am sure that you can see why this is not a sustainable method, simply because at some point you will be wrong and that will be everything gone.

For those that wish to try this rather risky strategy, we would highly recommend that if you win the first trade, take out the initial money, at least this will protect the moment that you put in. We have actually seen people win  3 or 4 of these trades in a row, going from $10 to $160 in next to no time, of course, the next trade lost and so they lost it all. If you remove that initial deposit, at least you won’t have lost anything. We have also seen people lose the first trade 5 or 6 times in a row, will take a lot of luck to make that money back and if you get into that situation, it is probably better to just quit and walk away.

Martingale

If you have been in the casino game or done any sort of gambling in the past then you would have probably heard of the Martingale strategy. The strategy was eaten and was popular in 18th century France. The strategy is based around doubling your bet or in this case trade size each time that you lose. So if you had a trade of 0.01 lots which lost, you would then do a trade of 0.02 lots, if those lose then you would do a trade of 0.04 lots, you would continue to do this until you had a trad that won, the winning trade would then win back all the original losses plus the profits that the original trade would have won. Seems like a good strategy, and in theory, it is. In theory, it could give you a 100% profit rate as you will eventually have a winning trade, won’t you? Yes, but how long will it take?

The problem with this strategy is that it could take an unlimited amount of money in order to make that trade. If you have a balance of $100 you will only have a certain number of trades available for you before you lose all your money, if you have a $1000 account, you only have two extra trades than you would have and $100. The more times you need to trade, the amount required will grow exponentially, so unless you have an unlimited amount of money, at one point or another, you will blow the account.

Rapid Trading

Another form of trading that looks to try and double your money, or at least trade it up as quickly as possible is something called rapid trading, this basically involves you making a lot of trades, and we mean a lot of trades in order to take lots of little profits. The problem with this trading strategy is that it is very easy to overwhelm yourself with the number of trades that you have. In a normal scenario, you may have one, two, or maybe three trades active at any one time, but with the rapid trading strategy you can quickly grow up to 100 open trades, on various pairs, or even on the same pair. The issue really becomes apparent when you do not have stop losses set properly on these trades, so you could ultimately have 100 small trades going against you at the same time, giving the same results as placing one very large trade, well above the size that you should be trading.

There are a number of different expert advisors that have been set up to work this way, they are often the ones claiming that they are able to double your money in a day, and they actually can, the problem is that they may double it one day, the next day they will completely lose everything. This is an extremely reckless strategy to be using and one that we would certainly not recommend. Having said that, it does look pretty incredible seeing 100 different grades all changing prices at the same time, it looks good but doesn’t work well.

Borrow Money

This is probably the worst idea that you could probably have, yet it is something that a lot of people still do. One of the major sayings and pieces of advice that people are given is not to trade anything that you cannot afford to lose, this ensures that you are still able to pay your rent and buy some food, so what would make you think that it is a good idea to borrow some money in order to trade? We understand that having more money means that you can make more money, but what if you lose? There is a  good chance that you will lose, if you do, then how are you going to be able to pay that money back.

Trading or gambling with borrowed money is a disaster waiting to happen, if the thought of doing this ever crosses your mind, try to think about what would happen if you lose, you will be paying that money back for years to come, a lot of years depending on the amount that you borrow. Don’t do it, just don’t. Only trade what you can afford to even if the prospect of making a lot more money is a good one.

So those are a few different strategies that really can live up to the promise of making you rich pretty quick, the problem is that the chance of them actually making you rich is very low due to the massive amounts of risk involved in them, in fact, we would just as likely suggest that you put all of your money on the lottery, you probably have just as much chance of winning that than you do for these strategies to succeed over any long period of time.

We would advise that you stick to tried and true strategies that have been tested and proven to work, trading is not a quick money-making scheme, it is a long term project that can really change your future if used properly.

Categories
Forex Basic Strategies

Guide to Trading Forex Without Indicators

Indicators are a wonderful thing, they can do a lot of our thinking for us, there are however problems with them and since they are becoming more and more popular, people seem to be adding hundreds of them to their charts which causes them to end up looking like a bit of a mess. Too many indicators can simply confuse things, you don’t really know what you are looking for and your actual strategy will be lost somewhere beneath them all. The other issue is that it takes away a lot of the skill from trading, simply using them as indications of when to trade means that you do not need to think anymore, everything that you learned before is going to waste.

If you are experiencing some of those issues, then there is something that could work for you, naked trading. We don’t mean getting all your clothes off, you are probably doing that already, what we are talking about is trading without any indicators. We need to remember that indicators are not designed to be signals, they should not be telling you to buy or sell, but that is how a lot of people arouse them. They are designed to simply tell you something about the markets, it should then be your job to use that information to make up your own trading decisions. We are going to be taking a look at what it means to be a naked trader and how you could potentially bring this idea into your own trading routine.

So let’s get a brief idea of what naked trading actually is, its main principle is that you will be looking at the markets it is current state, the price that it is currently at, we are not looking at the past prices and we are not looking at its potential future price, just what it is at right now in this moment of time. It is all about making trades and decisions based on the charts that are in front of you and nothing else. The difference between naked trading and trading with indicators is that you are required to have a good knowledge of different candlestick and chart patterns, hopefully, you should have already learned some of these during your initial trading training and education, they are afterall one of the main analysis techniques in trading. Price action is another bit of knowledge that you need to have a good understanding of, you will be using this to help work out your trades as it will make the markets a lot clearer for you.

Understanding Trends

Trends can be a naked trader’s best friend, understanding them gives you a greater understanding of the markets and the way that it generally likes to move in cycles. If we think of a typical market cycle, it will start ranging low, then start to trend upwards, it will then range high before a downtrend starts, it will then cycle like this, of course, that is a typical one and the markets don’t always play fair. These movements are however vital for a naked trader to understand. These patterns appear in all charts, not just the longer timeframes a good naked trader will be able to see the direction of these trends and will trade with them, not against them.

Understanding Market Psychology

Getting yourself a good understanding of the psychology that goes on within the markets will help you with your naked trading. There is something known as dumb money and smart money. When there is a huge candlestick forming, those that jump on it is what is known as dumb money they are simply throwing money into something that is already happening or has already happened. You need to get in before this, as after a huge buying candlestick, there is normally a lot of selling at the end, you want to be selling, that is market money. You need to be able to establish how the markets are moving. Or in other words, how volatile the markets are at that point in time. Volatility is great, it presents you with opportunities to get some trades on the go, of course too much volatility can be dangerous and can be made more dangerous when trading naked without any indicators to help you. Understanding this volatility and the larger movements are key to making profits when naked trading, ranging is a little trickier but can still be profitable.

Trend Lines and Support and Resistance Levels

When naked trading, you should still be using support and resistance levels as they can provide you with a lot of information about the markets. The thing to remember is to not draw too many lines, if you are writing on 100 lines then it will just become confusing, you need just a few and you need to ensure that you are constantly updating them, recent lines are far more useful to you than older ones. You should also only draw the lines that you are 100% sure of, do not try guessing where the resistance and support levels may be. It may not sound like naked trading anymore, but remember that you are drawing these yourself, not using a bit of software to do it for you, the trend lines can give you a real boost to your analysis and trading, so ensure that you at least try to use them.

So it sounds a little complicated, but who can actually trade naked? Is it for everyone? The simple answer is no, however you should certainly try it at least once. Even those that do not like it will still admit that they often look for price action first before then using their indicators, indicators are great for confirmations and can help to confirm whether it is safe to make a trade or not. Naked trading can also help to save time, you are trading in real-time and will not be overthinking your analysis which could cause a trade to pass by without you taking it. It can be simpler, less stressful, more precise and it takes less time. Having said that, you still need to set yourself a trading plan and some goals. Do not just go straight into naked trading without hanging ideas of the trades you want and when you should be getting into and out of the markets.

So you have decided to do some naked trading, there are a number of different things that you should be looking for, one of them are patterns, there are multiple different ones to think about covering the candlesticks and price action, so let’s very briefly look at what some of these patterns are.

Price Action Patterns

Let’s start with price action patterns, the first to look for is the Head and shoulders pattern. This is an extremely common pattern and you most likely would have seen it a number of times without knowing it. It is one of the key patterns to look for when naked trading. It is easy to notice as it consists of two shoulders which are lower heights and a head, or the highest point. More often than not when this pattern emerges it means that an uptrend is starting to tire and could be about to reverse into a downtrend. If you have a position open then it is a good idea to sell it before the market reverses. It can also work in reverse and would signal that a downtrend is about to reverse into an uptrend.

The other main price action pattern to look for is the Wedge, this pattern is also sometimes referred to as a triangle pattern and it can occur in a number of different ways which indicate slightly different things depending on the market condition it is found in. The wedge pattern is defined as a triangle, it has one long side which is accompanied by the price getting closer and closer together, the other sides are then drawn with trend lines. As the price gets closer than a breakout will occur and either a downtrend or an uptrend will occur. Normally, if there is a falling wedge pattern with the price slowly falling, then an uptrend breakout will occur, and vice versa for a downtrend. There can also be wedges without a rising or falling trend, which can make things a little harder to predict the breakout.

Those are two of the main price action patterns, there are then two main candlestick patterns to look out for. These patterns are based only on a small group of candlesticks, normally just two, three, or four of them. The first that we will look at is the Hammer, this pattern is a single candlestick that simply looks like a hammer, sometimes known as a pin bar. It has a long wick and a short body, it can sometimes be used to help indicate that a reversal is about to happen and can be seen at the top or bottom of a trend. The Engulfing pattern is the second one, this pattern consists of two candlesticks, it gets its name from the fact that the first candlestick is completely engulfed by the second one. This pattern helps to indicate that a trend reversal may be about to take place.

So it all sounds good, there doesn’t seem to be any reason not to naked trade right? Well not quite, it takes a lot of skill to trade naked, for many people, it is not something that they will be able to do straight away, it will take quite a lot of experience to do it properly and to be profitable when doing it. Many will argue that it is still better to use some indicators, especially when the markets are being a little funny. It is far harder to be a consistent trader when naked trading than it is when using a few indicators, if you are not fully reading and understanding the markets, then it could change without you noticing.

Our advice is to try trading with indicators, at least to begin with, if you are confident, and then try naked trading on demo account for a bit, if you do well, then move on to a live account, just remember that it takes a lot of skill, not everyone is cut out for it, so do not be afraid of giving it a miss after trying for a bit and going back to indicators, those indicators were designed to help you after all.

Categories
Beginners Forex Education Forex Basic Strategies

The Forex 10,000 Hour Rule

The 10,000 Hour Rule became popular after author Malcolm Gladwell dedicated a chapter to the concept in his book Outliers. The book can be summarized as a piece that examines the nature of trading success by evaluating different success stories and looking at separate case studies that back up some of those findings. In the chapter that focuses on the 10,000-hour rule, Gladwell claims that he has discovered “the magic numbers for greatness”: 20 hours of guided practice per week, 50 weeks per year, for 10 years, which equals 10,000 hours in total. According to the book, achieving this would put the person on the same level of greatness as a professional trader. 

Of course, any trader that sets out to meet this goal would have to be highly ambitious. This might not be possible for every forex trader, as many can only afford to trade part-time or might use a strategy like swing trading that doesn’t require as much attention as a more hands-on technique. One of the main benefits to forex trading involves the flexibility of hours since traders can decide when and how they want to trade. You would have to really work the 20 hours a week into your schedule if you wanted to meet the hours outlined by Gladwell’s plan. This would also only leave 2 weeks off per year, where some jobs provide their workers with 3 or 4 weeks. For traders that exclusively work from home, this is possible, but those with less flexible schedules just might not have the time. 

The plus to following the plan is that it would expose you to many different types of markets, thus building you into a more knowledgeable trader. For example, if you had started in 2010, you would have traded during both the U.S. and European financial crises, Japan’s nuclear meltdown, and during the plunge in oil prices. If you started on the plan today, you would likely see many other world events during the 10 years that are required to complete the plan. Learning to trade in different environments certainly could help one to learn how to deal with different markets and what does or doesn’t work with their strategy.

Our final opinion is that Gladwell’s 10,000-hour rule is better viewed as a rough estimate of the amount of time you should pour into trading. If you can only dedicate 15 hours a week and you’d like to take three or four weeks off each year instead of two, there’s no reason why this would stop you from becoming a professional trader. Even with less time put in, if you traded over the 10-year period, you would still be exposed to different events and would reap most of the benefits outlined in the plan. Keep in mind that there isn’t really a magic answer for the amount of time one needs to spend trading, but the 10,000-hour rule does provide a good guide of the time that is needed to master the skill of trading.

Categories
Beginners Forex Education Forex Basic Strategies

Five Fundamentals of a Good Trading Strategy

One of the most important things that a trader needs in order to be successful is a good trading strategy. This is one of the first things you need to figure out as a forex trader because it is crucial to have a plan outlined so that you know how you want to trade and what your goals are. There are a lot of different strategies out there, some focus on day trading, while others pay more attention to risk-management, making smaller profits that add up, and so on. No matter which strategy you choose, there are 5 important elements that your chosen strategy needs to incorporate. 

Time Management

You need to invest some time into trading if you want to be successful. This doesn’t mean that you have to quit your job and devote all your time to trading, but you do need to make sure that you have enough extra time to take trading up. Once you’ve figured out how much time you have to trade, you’ll want to find a strategy that you can maintain. If a strategy requires multiple hours a day sitting in front of your computer but you can only trade in shorter intervals, then it won’t work for you. 

Risk-Management

You’ll need to decide how much you’re willing to risk on each trade before choosing a strategy. The truth is that most experts don’t recommend risking more than 1% of your account balance on any one trade. This can account for slower profits but will ensure that it does not break you if you make a bad move. Trust us, we’ve heard stories about big-league traders losing $25,000 or more on one trade thanks to a lack of these precautions. On the other hand, some traders prefer taking more risks with the chance of making a bigger profit. We’d recommend sticking with the expert’s recommendation if you’re a beginner or don’t have a lot of money invested just yet. Of course, what you’re willing to risk is up to you and you need a strategy that follows those guidelines. 

Making Money

Your trading strategy obviously needs to be profitable with the goal of making money (while minimizing your risk). Of course, your strategy needs to outline some type of plan to bring in the money. What does the strategy consider? Is it based on trends, making small profits through multiple trades, or something else? You should believe in the things that your strategy is based on. 

Easy to Follow

This doesn’t mean that your strategy needs to be simple, only that it needs to be easy to follow from your own perspective. If a strategy confuses you, then you’re going to have a hard time following it correctly. If you try your best to understand a more complex strategy but can’t figure out all the little details, you should try moving on to something else. Remember that a complicated strategy is not necessarily better than a simple one. 

Works with your Broker

Some strategies won’t work with your chosen broker or trading platform. For example, some brokers or platforms do not allow scalping, which means that scalpers can’t use their strategy on those platforms. If you already have a broker, you should check out their terms and conditions so that you know what is and isn’t allowed before choosing a strategy. 


Categories
Forex Basic Strategies

Differences Between Good and Bad Strategies

You have been told that you need to create a strategy, you cannot trade without it, however, once you have made your trading strategy, how do you know if it is any good? How do you measure whether it is a good strategy or not? Of course, you can look at whether it is profitable or not but there are plenty of other things that you can look at to work out whether the strategy is a good one or not, most of those reasons will be personal to you. So, let’s look at some of these factors that determine whether a strategy is good for you or not.

It should be personal: A good strategy needs to be personal to you, it needs to have been created in a way that suits you and the best way for that to happen is for you to create it yourself. This way you know the ins and outs and exactly how it works, if the markets suddenly decide to change, you need to have that understanding of the strategy in order to adapt. If you were to take a strategy from someone else, then you do not have a full understanding, as soon as the markets change you will be stuck, not knowing how to adapt it. So creating it from scratch is paramount and will help to really make that strategy your own.

It needs to be specific: The trading strategy that you need has to be quite specific, it should be focusing on specific things rather than being too broad. If a strategy focuses on just one or two currency pairs, this way the strategy will be able to more easily be adapted to the changing markets or if there is a dramatic event in the markets. If a strategy is trying to cover all bases and all currencies then it will struggle, each currency behaves in different ways and so there cannot be a group of settings that can cover them all, this will only result in there being issues when things go wrong or if the settings do not match the characteristics of one of the pairs.

Opening lots of trades: A good strategy will be able to pick its trades well, it will use very specific criteria before opening one up. What you do not want is a strategy that is opening tens of trades when only one is needed, some strategies do this to increase the volume being traded or the entry requirements are so loose that it allows for lots of trades. This is also sort of related to the precious points of being specific, if it is relevant to too many pairs then it may open too many at a time. When we look at trading, we are looking at quality and not quantity.

Risk management: A good strategy will have its risk management built into it. This will include things like the stop losses, the take profits, the percentage of the account to risk on each trade, and just simple methods of keeping your account safe. A bad strategy will unfortunately not include some of these things that can make them far riskier and dangerous, if a strategy does not have any risk management attached to it then we would suggest looking for a different one to use.

Can it cope with change? A good strategy will need to be able to adapt to the changing markets, they will always be changing, on a day to day basis and on a larger scale over the months and years. If your strategy is not able to handle any of those changes due to it being too rigid and requiring very specific requirements without the ability to alter them, then it would be considered a bad strategy. You need to be able to make adaptations or the strategy will only lead to eventual losses.

So that is a non-exhaustive list of things that could cause a strategy to be either good or bad, there are of course a lot of other things too, but these are some of them. Try to keep your strategy personal and specific, those are the main points to take home.

Categories
Forex Basic Strategies

A Different Heikin Ashi Strategy – Trend Exit Guide

Most traders initially rely on what they hear, read, or otherwise find to be useful and informative, especially due to the enabling nature of this age of information exchange and media saturation. More often than not, these pieces of data prove to be half-truths, if not worse, and such a lack of skills and knowledge is then easily transferred across the global forex market. Due to the unrestricted access to partial, non-factual information, traders absorb too many fallacies, especially when these are related to indicators and strategies to earn a bigger profit. The same goes for the widely praised Bollinger Bands and Fibonacci, among others, which are some of the oldest and the most outdated tools that numerous sources still glorify despite their age and poor performance.

Some other tools and topics are simply copied from one source to another without much creativity and personal input. Nowadays we have heaps of materials with no innovative additions, which may not necessarily involve any new creation except for an original perspective. In this article, we will attempt to provide a fresh outlook on another popular topic from the world of forex trading – Heikin Ashi trading strategy. Also, this is just one example and opinion based on one group of professional technical swing traders, you can interpret the information the way you see fit.

Heikin Ashi is often perceived as one of the most basic indicators under the MT4 group, which another reason why some professional traders question its quality. In addition to being similar to another well-known indicator, Japanese Candlesticks, its name actually originates from Japanese and it translates as an average bar. Beginners mostly find it extremely useful because it makes finding the trade entry considerably easier. However, most available sources provide an insufficient amount of data as well as to abound in the lack of the right tips that can help traders earn a profit. It is common knowledge that, as with other similar indicators, Heikin Ashi offers two distinct candles, where the white candle suggests that a trader should go long, while the red one implies the opposite. Despite its simplicity, traders are not given an opportunity to make any settings adjustments, which additionally reduces the quality of this tool.

Furthermore, this indicator is so easy to see that everyone can see the same signals at any location on the planet, thus stripping you of the exclusivity that naturally comes with using a good indicator. Bearing all these facts in mind, any individual at any point in their forex trading carrier must be aware that simplicity and popularity do not necessarily equal supreme quality.

Regardless of this tool’s shortcomings, we should strive to be objective and provide a clear list of actions which traders should avoid if they decide to use Heikin Ashi. Firstly, traders should not use this indicator to enter trades because the number of losses is almost always higher than the number of gains. As we already said that Heikin Ashi is generally favored for its ease of use, beginners, as well as all other traders, should attempt to do a demo trade and see this for themselves. It is extremely easy to get excited while using this indicator early on, but using it to enter or even exit a trade will only make you feel more frustrated and incompetent at trading in this market. Moreover, Heikin Ashi’s candles function in an entirely different way from the regular forex candles we are used to seeing.

If you take a look at the image below, you will surely see a few prominent reversals in the chart (marked grey). These inviting points are precisely the places where you should remain focused just because most people fail to grasp the severity of entering a trade in between the grey areas (marked yellow). By measuring how trading, in this case, would turn out in advance, you could in fact understand that your price would probably never reach your take profit. What is more, before you could even see any profit from such a trade, you would probably need to go through more than a few losses, and no success afterward would be able to compensate for the degree of loss you previously experienced. Therefore, if you only allow yourself to see the surface and feel compelled to enter a trade only because of some superficial positives, you may lose all your confidence and severely endanger your financial stability as a result.

While we owe it to ourselves to call a spade a spade, this indicator can still offer some value, which other sources do not seem to be interested in. To be able to extract any such benefits from Heikin Ashi, you primarily need to be a trend trader using your own system. To manage a win, you will take half of your trade off after a certain number of pips and your move stop loss to the break-even. In case you have yet to discover an exit indicator you would prefer to use, Heikin Ashi can temporarily assist you with the rest of your trade. Simply put, if a trader is already going short, they will have to wait for the candle to become white to exit and vice versa. This indicator is not the best tool you could use to finalize a trade, but it certainly can be of great assistance if a trader has not decided on a specific exit indicator yet.

In comparison to not using an indicator to end a trade, Heikin Ashi can definitely render more pips and thus bring you more money than the other way would. However, if you already have an exit indicator you like or you are exploring your options, you can always use Heikin Ashi to compare the results it gives you to the ones your indicator of choice produces. It this comparison demonstrates any advantage of Heikin Ashi over the other indicator, you will know to continue looking for a better tool. This approach will save you much time and help you develop a safe and functional system you can rely on.

We know how important having a good algorithm is and Heikin Ashi can not only help you discover a good exit indicator, but it can also yield a great number of pips, even to beginners. Nevertheless, earning a few coins here should not stop you from looking further for an excellent tool that can bring even more success to your account. Keep searching for trend indicators and do not give in to passing compulsions that this indicator entails on the surface level. Avoid reversal trading and strive to see the entire chart as a whole measuring possible wins and losses and demo trading to compare. You can truly stand out from the crowd by learning how to differentiate between acting upon a feeling and making decisions based on some tangible data.

Do not be misguided by a vast number of sources promoting price levels, support/resistance lines, and other ineffective strategies that will not get you in or out of a trade on time or without losing a substantial amount of money. With a clear strategy, a trading mindset, and an effective exit indicator, you can get to wherever you want to be and Heikin Ashi can serve as a transitioning step on the way to reaching your goals. Finally, understand that all the time you invest in learning about Heikin Ashi and other indicators, testing, and making necessary comparisons will only help you grow as a trader for these are the skills you will always be able to call upon in the future.

Categories
Forex Basic Strategies

Should You Trade Against the Trend?

Every now and then, you will see the markets consistently move in a single direction, this is known as a trend, much like sheep, most people will jump on the trend, trading in the same directions which can potentially add to its momentum.

There is the argument that a trend cannot continue forever, and this is true, so if you are the sort of person that likes to try and predict the tops and the bottom of trends, then going against the trend could be pretty beneficial. The issue with this is that it is not exactly an easy thing to predict.

More often than not, when all points on a chart are pointing in the same direction, the market sentiment will also support this movement, so it is easy to see why the majority of traders would not want to go against it. The one thing that we need to consider though, is the fact that the majority of traders have their trading bias and may not necessarily understand why the markets are moving up or down, just following the trend without understanding the reason for the move, can be just as dangerous as going against it. This sort of hive mentality is one of the common mistakes that a lot of new traders, in particular, seem to make.

It can be a pretty scary prospect, going up against the rest of the markets, and we can understand why there would be some hesitation, after all, most people would be going in that direction for a reason right? What would you know more than they do? What you need to remember is that a strong momentum does not mean that those currencies are actually strong, it could just as easily mean that there was a large influx of amateur traders joining the markets and blindly following the trend.

There is a forex trading strategy that is known as contrarian trading, this is all about going against the current market bias, as the shift in market sentiment is inevitable at one point or another. It would involve buying a currency when it is weak or selling it as it becomes stronger. This may sound counterproductive, but it certainly has its merits.

People who trade against the trend have a much better understanding of an overpriced or oversold asset, when something is hugely over or under, it can often result in a number of different pullbacks or even price reversals as there is only so long that an asset or currency pair is able to remain in that condition. When something is overbought, it means that its price is being inflated, there is no way that it will be able to sustain that price or continued rise in price for a long period of time.

This strategy obviously has its dangers, when a currency is really strong and pushing the prices up, there is a good chance that it can actually run straight through the potential reversal points, continuing higher and higher, this can blow out a trade that a reversal hunter may have put in. So it is not something you should just try at any time, you need to be able to see the stages of the trend slowing or the main money makers pulling out, this is far harder to do that to say and so this is actually an extremely risky strategy unless you understand what you are doing.

If you have done your research, understand your fundamentals and are willing to lose a few trades, then the idea of trading against the trend can actually be a very profitable one. It won’t be for everyone, it certainly won’t be for newer traders, but there certainly are some potential of profits in it.

Categories
Beginners Forex Education Forex Basic Strategies

Signs That Your Trading Strategy Isn’t Working

There are thousands of strategies out there, and we mean thousands, all sorts of things are available, you will also get people claiming that their strategy is making them $11 to $500 per day, or they are making 10,000 pips per month, these are huge results and very tempting, but you also need to ask yourself does it sound legitimate? These people claim to have the ultimate strategy, well they can’t all have the ultimate strategy now, can they?

Instead of looking towards them or even using them as a comparison, it is important that you create a strategy that works for you, build it from the ground up in a way that suits your strengths and weaknesses, and also your style of trading. Having done all that, you will be good to go and will be profitable right? Well, not exactly, even with a strategy that you created yourself, there will be flaws in it, in fact, many people who have now found their preferred and most successful strategies would have been through another 10 before that which didn’t turn out quite so well.

So once you have gotten your strategy set up, what sort of things would make you give it up and start again? That is what we will be looking at now.

You’re Spending More than Your Earning

We will get this one out the way first, this is more for those that purchase signals or Expert Advisors (EAs), are they actually making you any money? If you rent an EA for $200 per month and it earns you $150 per month on your account, do you think it is worth it? You are making a net loss of $50, so why are you still suing it? Why would you purchase something that actually makes you a loss? Get rid of it and start looking at your own strategy, a hopefully profitable strategy.

It’s Not Profitable

Keeping along the same lines as the previous point, some strategies just aren’t profitable, you can have a successful strategy that doesn’t actually make you any money, strange I know, but possible. This is often down to bad take profit and stop loss levels and risk management, risking too much per trade can actually give you more wins than losses but the monetary value of the losses is higher than the wins. If this is the case, then it is time to evaluate the strategy to look for an entirely new one to build.

It’s Hard to Stick to the Rules

When setting up a new trading strategy, it should come with some rules, these are there for a reason and they are often the reason that the strategy works. They help to improve consistency and overall profitability. So if you have a strategy that seems to be working, but you are finding it hard to stick to the trading rules set by it, then, in the long run, there is a good chance that you could start to incur losses. It is actually impossible to wor out the profitability of a strategy if you are constantly making changes and breaking the rules, so if you are not able to, it would be a good idea to try and create one that you are able to follow.

The Strategy Takes too Much Effort

When you create a strategy, you also need to take you into account, these are things like the time you are free to trade, your sleeping patterns and so forth, if you like in Europe, there is no point in creating a strategy that requires you to be awake during the Asian markets, otherwise you will be up the entire night. Do you need to look at 108 different indicators in order to find the right signal, well that isn’t maintainable, you need to set up a system that you will be able to use without too much effort, and certainly without causing sleep deprivation.

All of the points above are reasons why you may need to give up your strategy, remember that trading forex should not be a chore, it should be a learning and enjoyable experience, if your strategy is turning that into work or causing frustration then it may be time to start looking for a new one.

Categories
Beginners Forex Education Forex Basic Strategies

The Strangest Forex Trading Strategies

You often see the same strategies being mentioned over and over, there are a few different ones that a lot of people use, or at least different variations of very similar ones. However, every now and then you come across a strategy that people are using which do not actually make any sense, more often than not there is a form of gambling involved, but those people are convinced that their strategy works and so they continue working with it.

We are now taking a look at a number of different strange yet very real strategies that people have been using to trade on the markets.

Allowing your pet to trade: This is a weird one and certainly goes into the realms of gambling. You probably see during most major sporting events, they will put food in two bowls to predict the result, whichever the bowl that the pet eats out of is the predicted winner. Some people have taken this into the trading world and put two bowls down, one with a buy and one with a sell, then let your pet decide. Now unless your pet is actually psychic, this method of choosing trades is certainly not a realistically long term process. It is all a gamble and not something that we could recommend, it could work for a few trades, but certainly won’t in the long run.

Use sports to trade: Sports trading is big business, but we aren’t talking about that, we are talking about people who use sport to work out what they’re going to trade on the markets. This can be a single match or an overall tournament, normally people will look at the super bowl or the world cup final, whichever team wins or scores next will determine the direction of the trade. Not the most scientific approach and certainly not a reliable one, yet it is something that a lot of people do, mainly for fun I am sure, but there is a good chance that one could go the wrong way. I am sure that you can see that there really isn’t a correlation between sport and trading in this sense.

Trading based on the weather: What could be easier than getting up in the morning, looking outside, and knowing exactly what the markets are going to do. Well, that is exactly what some people are doing, they are simply opening the blinds and trading based on the weather. If it is sunny, it will probably go up, if it’s rainy, most likely down, seems logical right? Well apart from the fact that the weather does nothing to the markets. It may change your outlook or your mood, but it certainly does not change the markets.

Trading based on the seasons: Pretty similar to the weather, but slightly easier to work out what the direction of the trade should be. This isn’t necessarily about deciding whether you go long or short, it is more based around the idea that certain investments are better in the colder months and others in the warmer ones. Strategies surrounding this can involve things like trading riskier investments and currencies from November to March before then switching to slightly less risky investments for the rest of the year.

Coin flip: You need to love to gamble on this one, it is not really a strategy when you think about it, it is more of a 50/50 gamble, flip a coin, heads go up, tails go down, simple really.

Home run: The riskiest of all strategies, you are simply going for a home run with every trade, if it is pulled off then you pretty much double your account, couple home runs in a row and you are laughing to the bank. However, unlike baseball, it is one strike and you are out. You need to be able to massively over leverage the account as well as risk the entire thing on a single trade, putting in a trade size larger than usual. Not the best strategy at all, but if you have $10 you don’t mind gambling, it could be fun.

So those are a few of the weirder strategies that people have been known to use. They aren’t ones that are going to make you rich, heck they probably won’t get you many wins compared to losses, but for a bit of fun, they could be worth a shot, of course, maybe use them on a demo account instead of on your actual account.

Categories
Beginners Forex Education Forex Basic Strategies

Forex Setup Sheets and Testing Guide

Building up a system of trading is one of the first tasks you have to overcome when you start learning to trade. However, the process doesn’t end there – indeed, it never truly ends because you will forever be developing, perfecting, honing, and adapting your trading system. The most basic building blocks of your system are likely to be the trading setups you have selected and integrated into your process.

A setup is a specific combination of price trends and movements that, in given market conditions, has a high likelihood of delivering an expected outcome. Every setup basically identifies certain market conditions that mean a trade is likely to succeed.
What Kind of Setup?

Forex traders come in all shapes and sizes and from all walks of life. People get into forex trading from just about any profession you can think of. Some start out as floor traders or market makers but others go into retail trading from their regular jobs, as a way to make some extra income or as a way to replace a job or profession in which they are unsatisfied.

Moreover, there are no real limits to the different ways it is possible to make money through forex trading. But, here’s the catch, you won’t be able to do many of them. Not because you aren’t smart enough or gifted enough but because they won’t suit your personality and your strengths and they will eventually frustrate you. This is not a comment on your abilities so much as it is a description of the fact that everyone will end up trading in their own very unique way. If you try to teach an impatient trader how to watch the market for weeks at a time, waiting for a rare set of circumstances to occur, they are going to struggle and eventually fail. The same can be said if you push a risk-averse trader to make high-risk, high-tempo decisions under pressure. They will become frustrated and ultimately they will fail.

Because forex traders come from different backgrounds and because trading is such a personalised skill, it is important to identify what kind of trading suits you. In many ways, it is the ultimate personality test. A teacher, mentor, or instructor may be able to show you a whole series of setups and will probably place an emphasis on those that suit them but, at the end of the day, you will need to figure out what works for you. You will end up making your own, unique style.

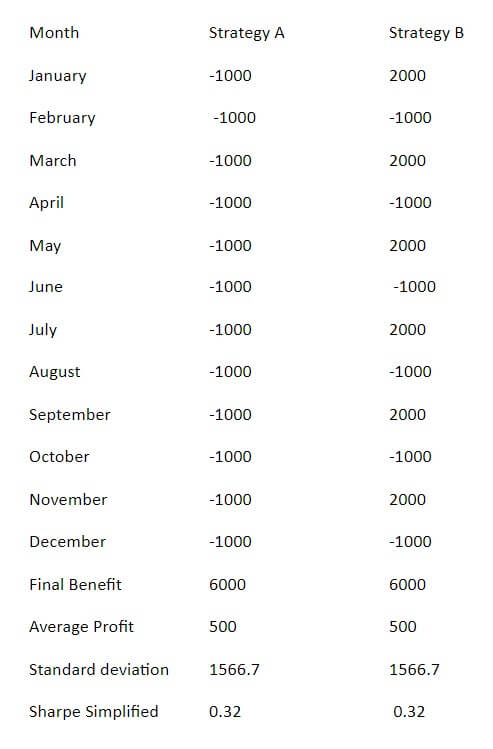
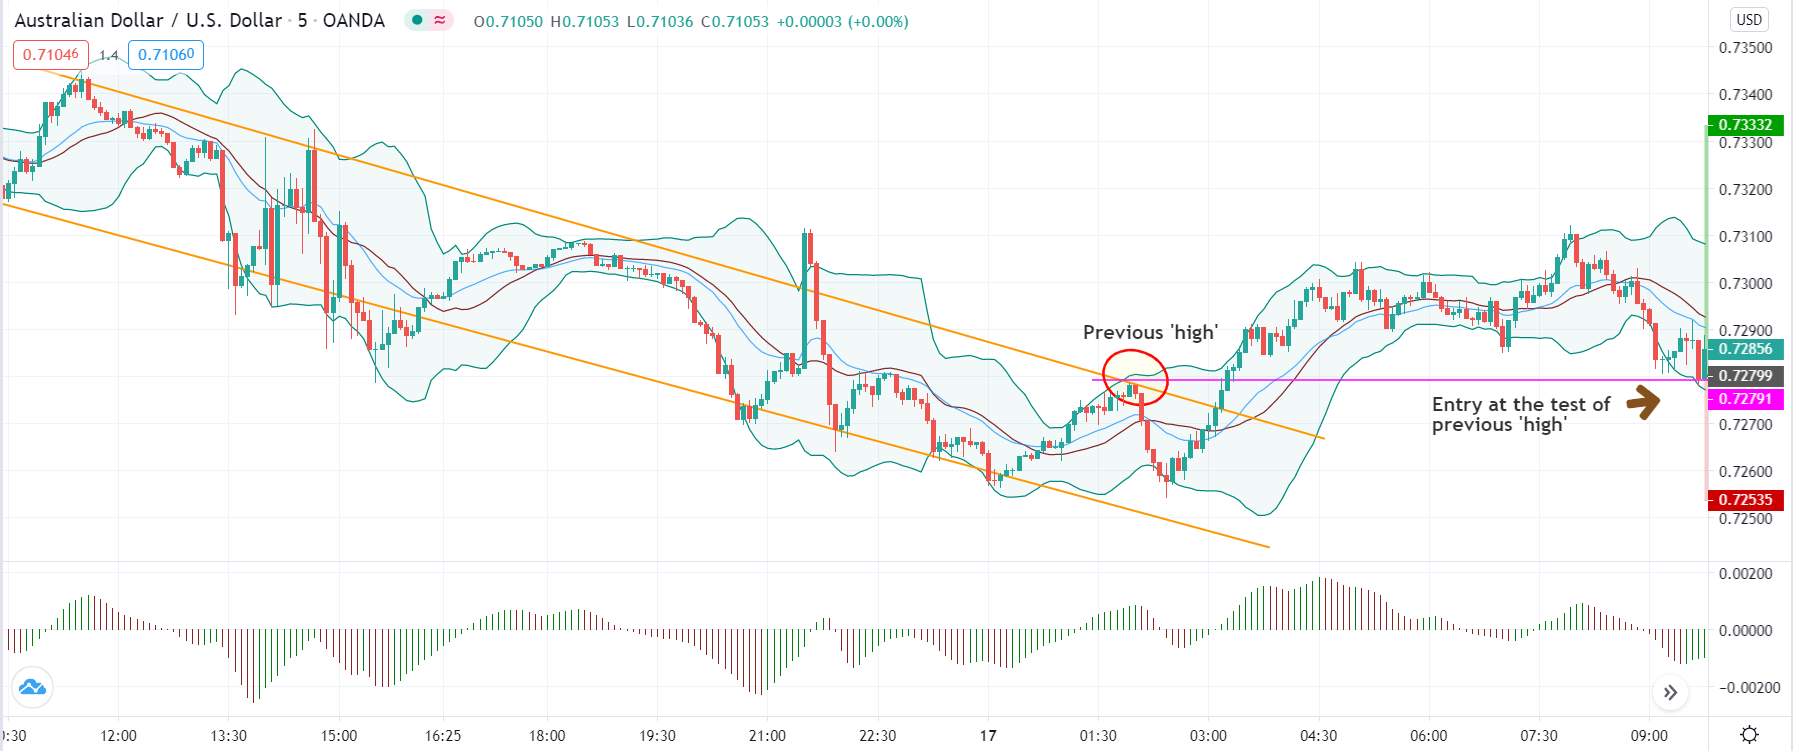
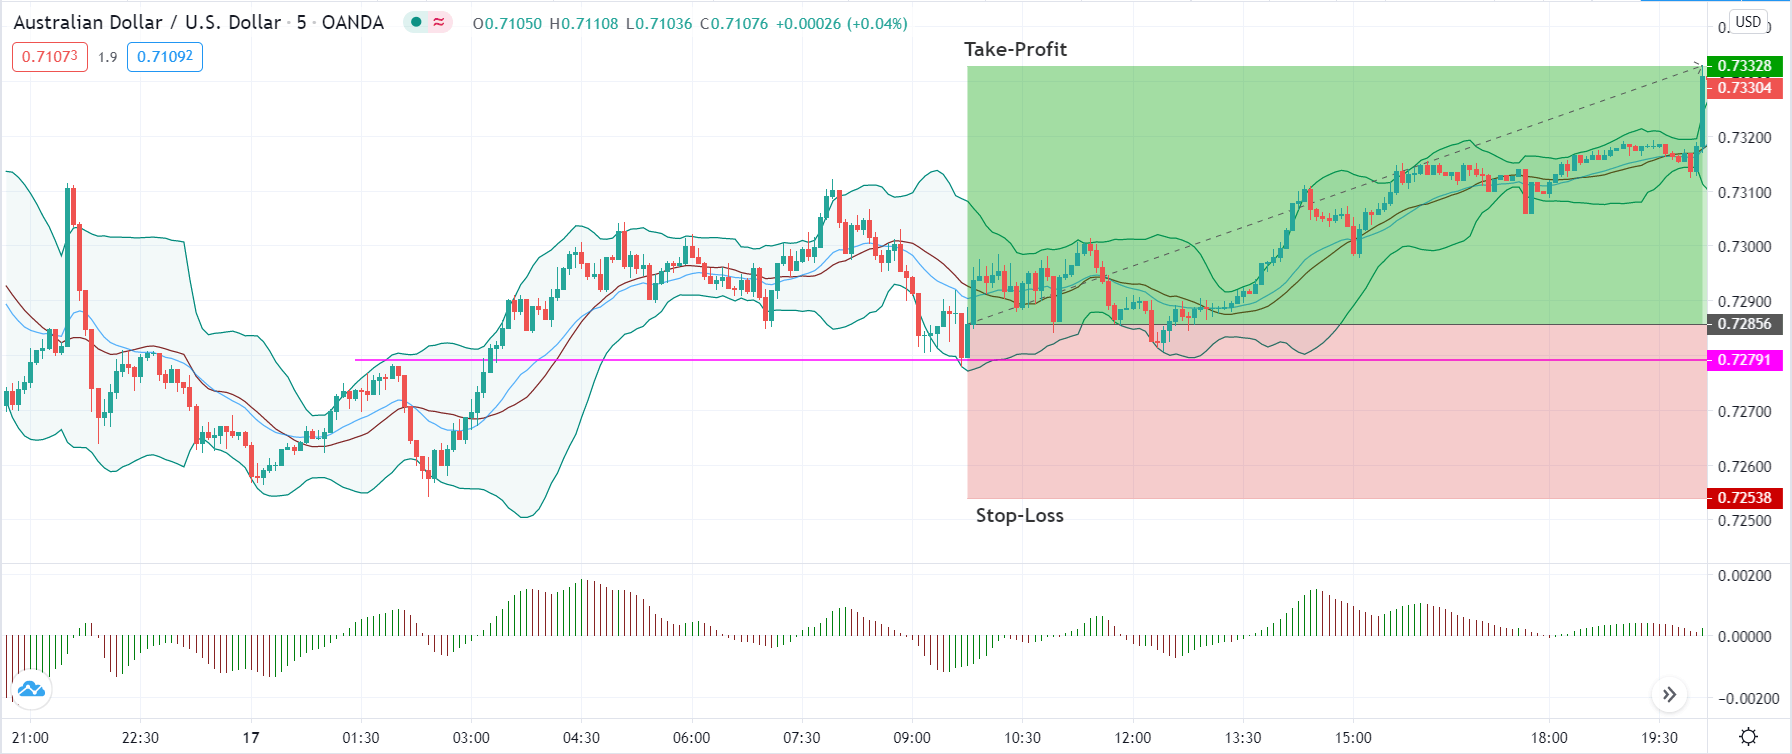
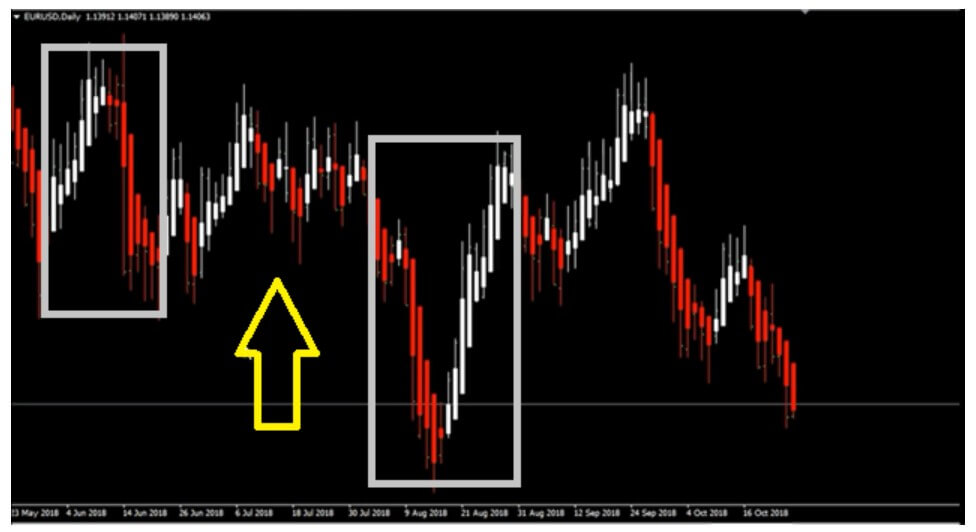
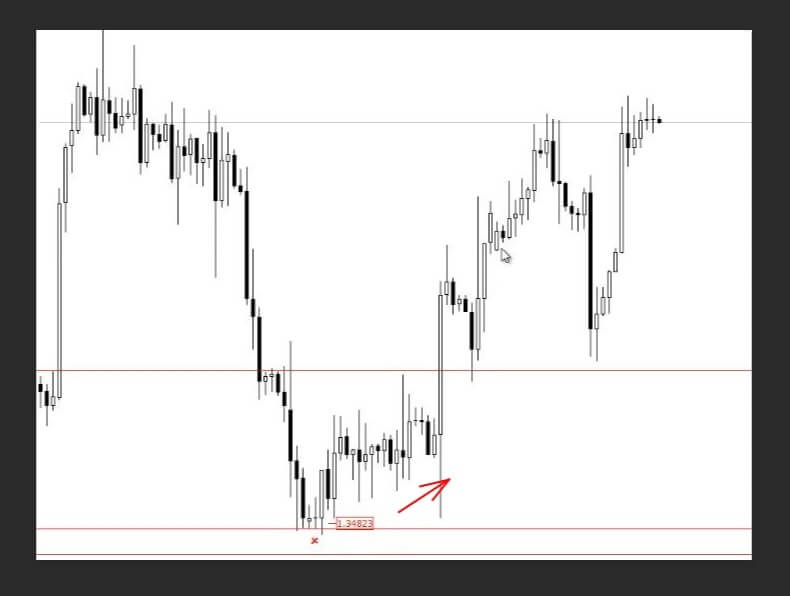
There are a couple of things here that are important to understand. Firstly, when you are starting out you will have a hundred questions about whether you should stay in a trade longer or shorter, whether you should enter earlier or later, and so on. The fact is that nobody can tell you based on one situation. It takes a much larger sample size – dozens or tens or even hundreds of situations – to reveal what works. And over such a long timeframe, what is revealed is not just what works better but what works better for the individual trader.

Everyone prefers to trade at different times. Some people have day jobs that mean they can’t trade early in the morning, others will want to trade at 4 am. Some people will have conservative position management strategies, others will be risk-takers. But the key thing is that if you try to apply an approach or strategy that goes against your needs and strengths, you may have some initial success but over the long term, you will deviate from it, twist it into something it isn’t designed to do and it will cease to be a system. In the worst case, it will cease to function at all and you will fail.

Once you do figure out what works for you, an important next step is to codify the information and start turning it into your own process.

Making Your Own Setup

Why is it important to write down your setups? There are several reasons. One is that you will probably be running several setups at the same time. Perhaps not at the beginning but eventually your strategy will include a plethora of setups that you have shaped and integrated into your system. Keeping all of these in your head is going to drive you nuts but, even if you can remember them all perfectly, you are more likely to make a mistake if they are not written down.

But there is a more important reason and it has to do with clarity and systemization. In your head, your thoughts are nebulous and hard to pin down. You may feel like they’re crystal clear but the real test of that is if you can convert them into words, into language and, even better, write them out. It doesn’t matter if when you write them down you are the only person that’s able to figure out what you meant, the act of writing down your thoughts makes their meaning crystalize. This is a crucial step in establishing a workable and consistent trading system. Clarity and systemization.

The actual process of writing out a trading setup is made much easier if you use a setup sheet. You can conceivably make your own but there are pre-made sheets out there that are perfectly useable.

Setup Sheet Blueprint

When you open up your blank setup sheet, it should include some of the following fields. Trend Analysis, Entry Criteria, Indicators, T.E.S.T., and others. T.E.S.T stands for Timeframe (how long you plan to keep a position open), Entry level, Stop Loss level, and Target or Take Profit level. Based on these Risk Ratios and other key stats can be calculated automatically. It doesn’t matter much what kind of trade you are going with, whether it’s a reversal, a pullback or an area breakout, you will need to fill in these fields accordingly.

Use the Trend Analysis fields to describe the market conditions that need to be taking place when you are looking for the setup to emerge. The conditions you are entering here are going to depend on the setup you have selected. In which direction is the market trending? Are you looking for it to be making new highs? If so, on what timeframe?

The Entry Criteria fields are where you write precisely what the price should be doing when the time is right to enter. If you are looking for it to break out of a consolidation, how long should that sideways movement last before the breakout? Are you looking for a low base or a high base? Are you waiting for the moving averages to approach and put pressure on the price to breakout?

You should fill out the Trend Analysis and Entry Criteria in language that you will later be able to understand. Again, it doesn’t matter if it makes sense to anyone else so much as it matters that it will make sense to future you. Under Indicators, list the indicators you will be using to help you identify the correct entry point and under T.E.S.T. enter your timeframe, stop/loss, and profit target. Remember, the first time you fill out a setup sheet for a given setup is not even close to being the last. The reason for this is that once you have these fields filled out with the criteria for your setup, it’s time to take it to the test range.

Tried and Tested

Until you test the setup you’ve outlined, nobody in the world can tell you if it’s going to be any good. What’s more, if you’re not testing your setups, you are going to struggle to make it as a trader because throwing them in the deep end is probably going to hurt you financially. All that is to say that testing is a fundamental activity of a smart forex trader. If you’re not testing, you’re not improving and your craft will stagnate.

There are several ways to put a setup through its paces. You can run tests in a simulator (TradingView replay feature) or through a demo account. Both have their advantages. Using a demo account is a real-world test (but remains risk-free) and has all the advantages that this entails but it can take a long time. This is particularly true if you are testing a setup that doesn’t occur with any great frequency. It can sometimes take months to build up a viable sample size for your test to yield any useful data. In that sense, simulator testing is much quicker and will give you a rough indication of how your setup performs.

Regarding sample size, opinions differ. However, you will want to generate a minimum of twenty times you traded with your setup to have a good enough dataset from which you can gauge results.

Test and Adapt

To be thorough, your testing process should have several stages. First, test your setup in a simulator and assess whether it yields a reliable win/loss ratio and lucrative reward/risk parameters. That is, are you winning often enough, and are the wins rewarding enough compared to the losses? Once your setup passes this first round, take it to your demo account and test it there. This will naturally take a lot longer but be patient. It is important to give every setup a proper real-world run-out.

Once you have been through at least these two stages of testing, you will have probably noticed changes you would like to make to your setup sheet. The first version of your setup is bound to have deficiencies that emerge when you run it through testing and your experience will also have improved to the point where you can see what can be changed. Feel free to tweak the trend analysis or entry criteria or any other aspect of the setup if you feel this would make a qualitative difference to how the setup performs.

To be truly thorough, you should then take this amended setup sheet back to the testing range. You can also run historical tests. That is, you can take your setup and check it against a given currency pair’s historical price charts and see how it performs in a real-world scenario. The advantages of historical or backtesting are (1) that it is quicker than demo testing and (2) can give you an insight over simulator testing, especially because you know or can crosscheck the news events that might have impacted market movements.

Closing Thoughts

Designing a setup is a two-step process (writing out a setup sheet and testing it) only on the surface. The reality is that your setups will evolve over time, even after they have successfully gone through testing. They will evolve with you as you grow as a trader. With that in mind, don’t throw out your old setup sheets, hold onto them because you might find that your trading habits change over time and you might want to resuscitate them from the reject pile. With a tweak here or there, of course.

Bear in mind, also, that there is such a thing as too many setups. Focus on those that work for you specifically and that you can successfully integrate into your system. You will be a better trader if you do not spread yourself too thin.

Categories
Forex Basic Strategies

Plan the Trade And Trade the Plan

This is something that you have probably heard a lot of times before, it is one of the most used phrases in Forex trading and it is also one of the most relevant. When you break it down, it is simply reminding you that each trade needs to be planned, analysis needs to take place and the right entry/exit points found, once this has been down, you should put in the trade and then stick to what you had planned before, do not start fiddling with it mid trade and changing the stop losses or take profits, you had them set for a reason, so let it do its work.

Some people may say that you need to deviate from the plan in order to make the most profit or to avoid losses, those are the people who have not created their trading plan properly and so need to micro-manage their trades, with a proper plan it will be able to get on with it itself and any losses will be negligible due to the risk management put in place for each trade (part of the plan). Yes, flexibility is important, but that flexibility needs to come in the planning stage, not the execution.

Use a trading journal:

You have probably heard this a thousand times, use a journal to record everything that you do, not only does this give you valuable information about the trade but it can also be used as a way to check that you are in fact sticking to your plan. Looking through your trades, can you see anything that deviates from it, any moves stop losses or early closures? These are the things that you will be looking for.

Discipline:

Discipline is key, but also sometimes hard to maintain. Sometimes you have to deviate from the plan and it goes well, it may happen a second time and so you will start to believe that making these changes with each trade could lead to more success, that is until it all goes wrong and you start to bring in some losses. You may notice a trade that you made changes to and it did well,m but it is important to stick to your plan, that is your plan for a reason, its reason is that it works, so why change something that works in the long run just for some quick gains. Stick to that plan, if you have noticed something that may work better, test the plan with the changes on a demo account, use the same changes with every trade and see whether it is more effective or not while doing this maintain the current plan on the live accounts until a full analysis of the changes has been performed.

Find the justified and unjustified wins and losses:

It is quite easy to work out which of your wins and losses are justified, you created the detailed plan for the trade, and you stuck to it, that is a justified trade. This means that an unjustified trade would be one that you deviate from the plan, it may be a large change or it could be a little change like changing the stop loss by a few pips, it doesn’t sound like much but it can really make a difference.

Maintaining discipline is vital when it comes to making justified trades, your trading journal can often make it obvious when trade was unjustified, there will be a random change that cannot be seen anywhere else, it is important to work out why that change happened and why you deviated from the plan, a lot of the time you will not be able to recall and most likely did not record it. You need to stay disciplined, your plan is there for a reason, each trade has been justified with analysis and reasoning, do not change that partway through because you have a feeling or someone told you something else.

Consistency:

You have probably heard this a thousand times, stay consistent with your trading, and this is certainly relevant. Your plan was created and most likely had each trade following a very similar path, so stick with it, consistence can be in regards to things like stop loss and take profit distances, lot sizes used. Do not just start adding to the trade size because the previous trade lost, your plan should have been created with losses in mind, so staying consistent to it will bring in far more regular results than potentially damaging your account with sudden changes.

So the moral of the story is to plan your trades, then trade that plan.

Categories
Beginners Forex Education Forex Basic Strategies

Anatomy of a Forex Scalping Strategy

Scalping is a type of trading strategy that revolves around profiting from many small price changes. A scalper focuses on making as many small profits as possible, rather than trying to win a large amount from a trade. Like every other strategy, the scalping method isn’t perfect. One of the strategy’s biggest downsides is that one large loss can wipe out all the smaller winnings that one worked so hard to make. Successful scalping involves having a higher number of winning trades versus losing ones, with the profit ratio equal to or higher than the losses.

Less market exposure limits one’s risks and reduces the chances that you’ll run into an unbecoming market event. There’s also more of a chance that a stock will move a few cents than there is that it will move a dollar or so. There are more opportunities for smaller moves than there are for larger ones and a good scalper can jump on these changes. These considerations make scalping a worthwhile strategy that can pay off. Of course, scalping involves making hundreds of trades, possibly per day. If you only have a limited amount of time to put into trading, this may not be the best method for you. Consider becoming a day trader or full-time trader if you’re ready to become a dedicated scalper.

Traders that don’t want to specialize in scalping may still find golden opportunities to use this strategy, like when the market is choppy or when there are no trends in the longer timeframe. Switching to a shorter timeframe can help one to see trends, so scalping can be beneficial here. There are several other ways that traders incorporate scalping into other, more long-term trading plans.

There are three main types of scalping strategies:

“Market making” is where the scalper tries to take advantage of the spread by putting out a bid and making an offer for a certain stock at the same time. This works best with immobile stocks that trade big volumes without any real price changes. It can be difficult to master this strategy as one would need to compete with market makers and the profit is small.

A trader purchases many shares and sells them for a very small gain on a price movement. The trader would wait for a move that is usually in cents and this requires entering and exiting 3,000 or more shares.

The more traditional strategy involves entering several shares and closing the position as soon as the first exit signal is generated. This would be around a 1:1 risk/reward ratio.

So, you may be asking yourself about the risks involved with scalping. One of the most crucial components of success involves having a strict exit strategy. If you don’t, then you’ll likely be one of those traders that loses all the money you worked hard to gain with one bad move. As we mentioned above, the “market-making” strategy can be difficult to pull off successfully, so it may be worth avoiding at first. Remember that scalping takes a lot of time and effort, as you’ll be glued to your computer screen making multiple small trades. You’ll need to be able to think and act quickly to master scalping successfully.

Tips

-Work with a direct-access broker for automatic instant order execution.

-Scalpers profit from the spread, so it is important to find a brokerage offering a tighter spread.

-Find a broker with competitive commission costs. Scalpers need to make many trades, potentially hundreds per day. Commission costs will add up quickly, especially unfavorable ones.

-Ensure your broker allows scalping and doesn’t impose restrictions that will hinder your strategy. Every broker isn’t scalper-friendly, but many are.

-It is important for scalpers to understand trading with the trend. Being able to identify a trend and momentum is important for successful scalping.

-You should be familiar with technical analysis, which involves looking at statistical data and charts.

-Most successful scalpers close out their trades at the end of the trading day and never carry them over to the next day.

Conclusion

Scalping can be a profitable trading strategy when it is used correctly, either as a primary or supplementary strategy. It does take a lot of time and dedication, along with a good understanding of trends, momentum, and technical analysis. If you’re a complete beginner, you’ll want to spend some time researching so that you understand these principals. It could also be a good idea for beginners to avoid the “market-making” strategy and to stick with the two more traditional scalping strategies. Scalping will likely continue to grow in popularity as many traders prefer the small profits in exchange for taking larger risks. This strategy isn’t for everyone, but it very well may be the key to success for those that understand how to do it effectively.

Categories
Beginners Forex Education Forex Basic Strategies

What to Consider Prior to Changing Strategies

At some point throughout your trading career, in fact, in quite a few points, you will be required to change up your trading strategy. While it may have been working really well at one point the markets will not remain consistent forever and they will change, you will then be required to change with them, if you do not, then you are putting yourself into some additional risk and could be putting your account in danger, as your strategy may not be as effective in these new conditions as it was in the ones that it was created for.

There are a number of different things that you can do to help you prepare to change your strategy, these can either be used to help you to alter your current one or some of them can be used to help you adapt yourself in order to use a completely different strategy that varies a lot from what you are used to, so let’s take a look at what some of these things are that could potentially help you change your trading strategy.

The first thing that you need to be able to do is to understand why you need to make a change, there could be a number of different reasons for this. Maybe you are currently risking too much of your account per trade and so you need to scale back your lot sizes. Maybe the markets have shifted, your strategy worked well before but there are now different trading conditions that it may not function at 100% in, so you need to make some changes to match the markets. Maybe you need to change things up because your risk management isn’t quite working or your risk to reward ratio is not quite right, whatever the reason is, you need to have a good understanding as to why you need to make that change, once you know the reason, it will be easier to focus your changes on what will resolve the current issue, rather than changing things that may not actually need changing.

It is important that you only make a single change at a time, while there may be multiple different things that need changing for your strategy to be ready, it is important that you only do it one thing at a time. The reason for this is that when you make changes, they can either work or not work, you do not want to be changing 5 things at a time if one of them is not working how will you know which one it is? When we are changing just one thing at a time, we can see straight away whether that one change is effective or not. If it is not, then we can adjust again, if it is then we can move onto the next thing to change. Of course, changing some things can then also affect something else that you had previously changed, but at least when doing it one thing at a time, you are able to better track what the effects of each change are and whether individual changes have worked well.

You also need to have a good understanding that once these changes have been made, you cannot just leave them, things will be constantly changing so you need to be prepared to continue to make changes as the conditions of the markets continue to move on. A strategy is never complete, this is something that a lot of traders see to forget, no matter how much you have worked on it, it is not complete, there will always be things that need changing and adapting, this is due to the fact that the markets will never stop changing themselves, you must stick with them no matter what they decide to do. So while your strategy has been changed and is now working, you will need to make further changes in the future. I mentioned that a lot of times just then, hopefully, that helped it to sink in, once again, the markets will always change, so you will always need to adapt your strategy.

So you are looking to make some changes, where are you going to do this? Are you going to make the changes directly onto your life account or are you going to implement the changes onto a demo account? Hopefully, you went with the latter option. You should not be making any changes on a live account, you do not know what effect these changes are going to have on your strategy or the profitability of the strategy. This is why we always test all changes on a demo account, if it works, fantastic, we can then move them over to the main account, but what if they do not work, and we are using a demo account, it makes no difference to our live account, we can just revert back and try again with zero risks. If you were to attempt this on a live account and it goes wrong, then you have put your account in danger and could potentially lose a lot of money if things go wrong and you cannot rectify it.

What if you need to go with a completely new strategy? One that you have never used before. You have been using your current strategy for quite a while now, so making the huge leap onto a completely different strategy can be a little daunting. Some of the reasons why you may need to do this could simply be that your current strategy does not suit your style of trading, or it does not work in the current trading environment. When you make such a huge change, it can be hard to forget some of the things that you had been using in the past. You need to understand that you are starting fresh, ignore all the little things that you may have done with your previous strategy, you need to follow the new rules that you have set out and only those rules, when you try to take in some of the little extra things that you did with your previous strategy, there is a good chance that they can contradict the things that you are doing with the new one, so stick to the new rules, not the old ones.

Going along with the above when you make small changes to your strategy, it can actually be quite hard to get old habits out of your mind, you are so used to doing the same thing over and over, as soon as one little bit changes, it can be hard to adapt to that. This is far more prevalent in those that have changed just one thing if you have been using your strategy a certain way for a long time, you can naturally want to do things the old way, you need to set reminders about the changes that you have made. When you change your entire strategy, it is easier to remember the changes than it is when you only change a very small part of it. So set yourself reminders or put something up on the wall to remind you of the change that you made and what you need to do to stick with it.

So those are some of the things that you should be keeping in mind when you decide to change up your strategy or even go with a completely new strategy, it is important to know that you will need to keep on adapting and so getting these things into your head beforehand can make thing booths easier and safer when you eventually implement any changes.

Categories
Beginners Forex Education Forex Basic Strategies

When To Let Go Of Your Trading Strategy

You may have spent the last few days, weeks or months developing your very own trading strategy which is great, having your own strategy that is suited and adapted to your own personality and trading habits is great, however, this does not actually mean that it is the right strategy for you to be using, this can be for a number of reasons that we will look at later in this article.

You may well be seeing others boasting about their profits or the amount of pips that they are making each month which could then make you want to switch over to that one and to abandon all the work that you have put into your current strategy. This is of course not the best idea or thing to do, firstly we do not know if those results are actually real and secondly, those strategies are created for those people not for you. So simply wanting to emulate someone else’s success is not a good reason to throw your own strategy to the side, instead you should be sticking to your own.

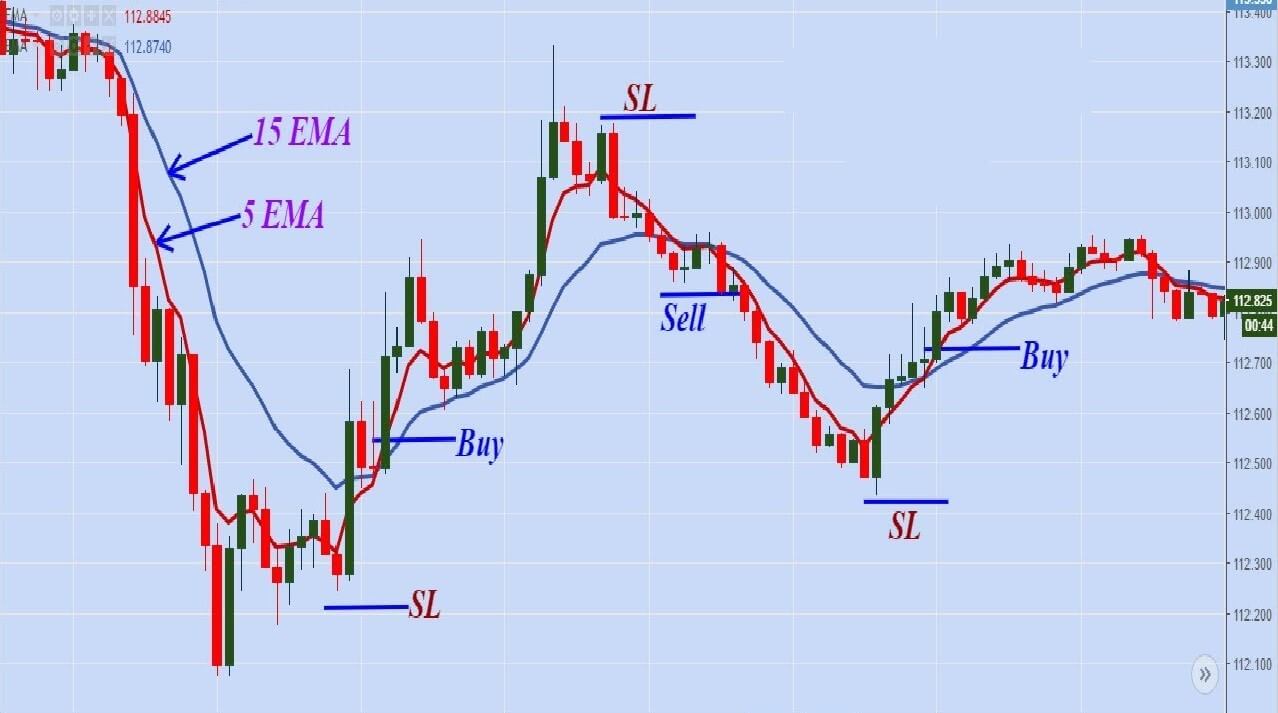
Before we look at the reasons why you possibly should change your strategy, create your own and what you put into it, because if you missed out one or more of these things then you may just need to alter your own rather than look for an entirely new one. Did you take your time to play it? Including risk management, your risk to reward ratio, and just overall risk of the strategy. Are you using the correct indicators for the strategy, there is no point having 100 indicators if you only use 3 or 4, but make sure that those 3 or 4 indicators are the right ones which give you the right information. How long have you tested the strategy? If it has only been a week or two, then you need to use it for longer, a few months at least to ensure that you are clear as to whether it is working or not. Finally, are you following the rules, and do they suit the current market conditions? Not all strategies work all the time, yours may work when there are different conditions to the ones in the markets right now, so you may not need to abandon it completely.

Since you have done all of that, if things still aren’t working then it may be time to try something new, so we have come up with some reasons why it may be the right time to jump out of your current strategy into a nice new shiny one, this does not mean that the new one will work, it may give the same results, but it is worth trying something that more suits you as a trader.

You struggle to follow your own rules.

When you created your strategy, you would have created some rules that you are meant to be following. The problem is that some people struggle to do this for a number of reasons. Maybe there are just too many of them, maybe they are a little unrealistic, whatever the reason as to why you are not following them, it could be an indication of this strategy not being suitable for you. You breed to be able to be consistent with the rules, this is the only way to work out whether a strategy is successful or not, so if you are struggling to stick to them, no matter what they are, this strategy is probably not the right one for you. Of course, as mentioned before, it is always better to slightly tweak these rules to see if that makes things easier rather than just ditching the entire strategy, although that is of course still an option that is available to you.

Does your strategy require too much effort?

Let’s be honest, you probably don’t have 12 hours a day that you can set aside for trading, if you are working a job at the same time then you probably only have a couple of hours each day to trade. So if your strategy currently takes you hours to find a trade or it requires you to be online at ridiculous hours then do you feel that you will be able to keep it up? If your system is keeping you up or is requiring you to be online at hours and times that are not suitable for you then it may not be the right strategy. You may need to find one that fits in better with your current schedule rather than allowing one to dictate it for you.

Are you spending more than you make?

This is more for those that are buying their strategies or using Expert Advisors. We should point out that some are fantastic and can make you money, while a lot of others will not. However, if you are paying for a signal or an EA, then you need to be able to add the costs of this into your profit and loss numbers. If this results in you spending more on the signal or the Ea than you are making,g then we are sure that you can see the issue here. A good signal or EA will be able to cover its own monthly cost with its results, if it cannot, then there’s clearly something wrong and you should probably consider moving on to a different one.

The market conditions aren’t right.

There may not actually be an issue with your strategy at all, it may just not be the right time to be using that exact strategy. There is no one strategy that works all of the time, they are all suited to certain market conditions. Some like trends while others like a more up and down market If Your strategy works on a trend but the markets are going sideways then of course it will not be effective. This does not however mean that it won’t be effective once the markets begin to trend. So you should still be keeping that strategy at hand once the market conditions change. So try and have multiple strategies that you can switch between based on the current markets and what works best for them.

It’s not profitable.

The big bad obvious one, if your strategy is not profitable, then you should not be using it. We are not talking about not being profitable week to week, we are talking about being profitable over a long period of time. If you have been using it for months and it is still not profitable then it may be time to look for another one to try.

So those are some of the reasons why it may be the right time to try and get a new strategy. It is entirely up to you what you do, or how long you give a strategy before deciding to get a new one, but try and give it enough time to have enough results to see an accurate portrayal of how it will perform. You should also not be shy about simply tweaking things with your current strategy rather than looking for a new one completely.

It can take you time, effort, and possibly a little bit of luck before you find a strategy that works for you, just don’t be afraid to ditch some of the work that you have put in in order to find a more suitable strategy for you. Take your time with it, demo it to ensure that it works and this will hopefully allow you to be more successful over a longer period of time.

Categories
Beginners Forex Education Forex Basic Strategies

What is the Forex 10,000-Hour Rule?

The 10,000-hour rule is a theory that was developed by Malcolm Gladwell in a book called Outliers. In this book he stated that practicing daily, weekly and monthly over the course of 10 years will equate to around 10,000 hours of practice, this is the magic number needed to be able to perform a task to the standard of a professional, Malcolm was not being specific to a particular skill, instead, he suggested that anything can be taught in this manner, so how does this apply to Forex trading?

We all know that practice is important, you cant get good at anything without it, but when it comes to Forex, is this based on time? If we take the example literally and suggest that you have now been trading daily for the past 10 years, you would have experienced some of the major ups and downs that have occurred from 2010, these include things like the US financial crisis, the European debt crisis as well as the most recent drop of oil prices into the negatives. The experience of going through and experiencing those major moments in financial history can give you a much better understanding of major events and thus can enable you to plan your trades and strategies better.

Those are just the major events, trading in more standard trading conditions can also give you a better-developed understanding of how the markets actually behave and how they like to move in trends and patterns, the timeframes, trading session differences, and which currency pairs you prefer. It will also help you to understand a little about yourself, what your risk tolerance is, and how your personality dictates some of your trading decisions. We would also hope that the 10 years of trading experience would help you to develop some of the better trading habits and to have worked out some of the more damaging ones.

So does the 10,000-hour rule actually work? It is impossible to say and it will also vary for everyone, how much and how quickly you pick up and retain information and habits. A quick learner or more technical-minded person may get to the performance and have the knowledge of a professional in 1,000 hours or less, someone that takes longer to learn may take 20,000 hours to learn what is needed. The 10,000-hour rule should be taken as guidance rather than as a rule, once you hit that 10,000-hour mark it does not magically make you an expert.

Within the world of Forex, there are far more important things to learn than just putting in the hours, just trading for 10,000 hours will not teach you a thing if you just contact output in trades with no reasoning behind them or no learning from your mistakes. Using your time wisely to develop a working strategy, to help remove those bad habits and learn new good habits to replace them is just as important as the time you are putting in.

While we cannot deny that becoming a professional or even profitable trader, in the long run, does take time, a lot of time, we can’t really put a figure on how much, that will come down to you, your dedication and your willingness to learn.

Categories
Beginners Forex Education Forex Basic Strategies

The Importance Of Strategy Testing

Creating a successful, consistent and profitable trading system is the aim of any forex trader, however, it can take years of experience and practice to actually come up with one, not to mention the fact that even a strategy that was once successful, won’t always be.

If you have traded for a while, you know what making consistent winning trades means that you can’t just look at each trade completely fresh, you need to have a set of boundaries and rules that you have put in place, not only to find the best trades but to also act as protection for your account, otherwise known as risk management.

So let’s say you have come up with a new strategy, on paper, everything looks good. It takes into account pretty much everything you can think of and you can see no reason as to why it won’t work, you just jump straight into the live markets with it right? No! You need to test it, and there are a number of different ways that you can do this.

Before you do any sort of live testing you need to ensure that your strategy would survive something called a backtest. This is a way of looking at the historical data from the markets, looking at how they moved and applying your strategy to what has happened in the past, if your strategy holds up well then it shows that it offers a bit of resilience, however, if the backtesting shows times where the strategy would have blown or had a large number of losses in a row, then it may need a little tweaking to sort that out.

If the backtesting all passes, then there is one very important aspect of testing that is required, demo it. Using a strategy on a demo account lets you test it out in real-time on market conditions that are very similar to the live markets. The key to using a demo account is that there is no risk, you are able to test it out, it if brings a few losses, you can adapt it to fix whatever aspect caused the loss and then continue to test, this should be done for an extended period of time, months for proper safety and through multiple different market conditions such as trends.

When testing the strategy there are a few other aspects that need to be tested, no strategy is 100% bulletproof, so looking for the signs in the market where your strategy won’t work is just as important as getting it to work. Maybe the strategy won’t work during major economic news, maybe it only works in an up or downtrend, these are the things that testing lets you work out and then once going live will allow you to avoid such events when using your actual capital, this acts as another form of protection for your account.

The main downside to testing is that it lacks some of the things that you get on a live account, things like slippage and commissions. These can really impact your profitability especially if your strategy looks at taking lots of small profits. So keep this in mind when testing, be sure to subtract an amount form the figures given in order to account for these.

The more testing you do, the better your strategy will be. We know that it can be a little boring going over the same thing over and over again, you also want to get that strategy trading live, we understand that and always feel the same way. However, diligent testing is the only way you can be sure it will be profitable and is a vital part of creating a new strategy. If you want a strategy to be profitable, it needs to be tested thoroughly.

Categories
Beginners Forex Education Forex Basic Strategies

The Stop Loss / Trailing Stop Combo

If you have been trading for 10 years or only just started last week, one thing that you would have heard about is stop losses, they are there to protect you and to protect your account, but have you heard of a trailing stop loss? They are very similar in functionality but very different in their executions.

So what exactly is a trailing stop?

The trailing stop works in very much the same way that a stop loss does when the price reaches that of the stop loss, it will close out the trade, where it deviates from its name. It is a trailing stop which basically means that it will follow the price up to and won in order to close the trade on a retracement. People often use trailing stops once a trade has already gone into profit, thus creating a risk-free trade that can continue in the right direction and will be closed once it decides to retrace a few pips, this can both increase or decrease the profits received based on how long it takes for the retrace to occur.

How does it work?

So let’s take a look at exactly how it works, before looking at a trailing stop loss, let’s look at what a normal stop loss does, so let’s take this example.

EURUSD:

Opening Price: 1.10
Stop loss: 1.09
Trailing Stop pips: 2 pips

So we bought into the currency pair at 1.10, the price drops down to 1.09, the stop-loss triggers and the trade closes at a loss. Pretty straight forward and something that everyone should be using to help protect their account. The way that the trailing stop loss works is that it does not come into effect until the price goes into profit.

As soon as the price rises to 1.10100 the trailing stop will trigger, it will then be placed 2 pips below the current price, so at 1.10080, as soon as the markets move up to 1.10120, the stop loss will move up to 1.10100, remaining two pips behind. Should the price move back 1 pip back to 1.101100, the trailing stop loss will remain at 1.10100, just one pip behind, so it will not move down only up. If the price continues, then it will continue to follow the price until it retraces those two pips. It is up to you whether you sit to have a solid take profit, but when using the trailing stop, most people will leave just the trailing stop to work, but a solid take profit can also be used.

To some you may wonder why you would use a normal stop loss at all, can you not just stick the trailing stop loss and let it run like that? You could, but the problem doing it that way is that the trailing stop only generally comes into effect if you are in profit, if the trade fails to come into profit and continues to drop, you will not have a stop loss in place as the trailing stop is not there, this is the importance of having your solid stop loss in place too.

So the best way to think about it, is that the solid stop loss is to limit the risk of your account, however, the trailing stop loss is for stopping profits from dropping. Having both of them available on your account can be a powerful tool to have.

There are of course a few downsides to using the trailing stop over a take profit when you create your trading plan, there was most likely a stage where you worked out your risk and reward ratio, this is how much of your account you are willing to risk with each of your trades and also how much you will potentially make from it. As soon as you are using a trailing stop, the reward part of that ratio is now fluid, this can potentially have a huge impact on your overall strategy as it is no longer fixed. Each loss could now potentially wipe off the profits of one trade or even more due to the trailing stop loss triggering and exiting the trade at a lower level.

If you are going to be using trailing stop losses then you need to ensure that you have them planned from the start. However, if you do, the combination can be fantastic, get it right and the trailing stop can allow a trend to move a lot of pips, whereas your take profit level may normally have been at 20 pips, with the trailing stop, if the trend moves 100 pips before moving back, then you can catch the majority of those 100 pips, giving you a much larger profit for that trade.

So ultimately, there are risks involved with using it, but combining it with the usual stop loss to protect the risk on your account, the trailing stop loss can be a very powerful tool, especially if you are trading longer-term trends.

Categories
Beginners Forex Education Forex Basic Strategies

Forex Trading Strategies To Avoid: Martingale

There are a lot of strategies out there, some are fantastic and some not so much, there are also some that you should be avoiding like it was the plague, these are strategies that are either extremely unrealistic or will increase the risk within your account to an unacceptable level. Some also have literally no risk management and just rely on luck or hope that the markets will change.

One of those such strategies is the Martingale strategy, this strategy was first seen in the 18th century and was most popular in France. This strategy was used a lot in the casinos, there were those that made a lot of money from it, but far more lost everything. The casinos also came up with their own defenses and changed the way some tables world primarily to simply prevent people from using this strategy.

So if the casinos are changing things to prevent it, it must be quite effective right? Well, it can be, it can actually guarantee you wins, the problem is that you will need an unlimited amount of money in order to guarantee a win.

What is the Martingale strategy?

The idea behind the Martingale strategy is very easy to understand, you place a bet at $1 on a 50/50 outcome, if it wins, then you get back $2, If the first bet losses then you will double up your bet, so the next bet would be $2, if that wins, you get $4 back which is $1 profit ($1+$2 bet $4 win). If it loses again, then you double it again and place a $4 bet, you are starting to see the pattern now.

Those that advocate the strategy will tell you that if you have enough money, you will always have a winning bet, this is technically true, the laws of probabilities indicates that you will eventually have a win, the problem is, that you would potentially need millions in order to win that $1 if too many trades go the wrong way. The amount that you need to pay can very quickly get out of control.

So looking at that table, you can see that the amount that you are betting and the potential losses can very quickly go through the roof and they will continue to escalate at a much faster pace the more you go. Many people will be expecting to make a win before getting to that stage, but are you really willing to potentially risk $1000 just to get a $1 profit, it really isn’t worth it, this strategy is only achievable if you have an unlimited amount of money.

Many people have tried to use this strategy, unfortunately, the majority of them have lost all of their money. When you look at it from the outside, you would assume that you would win at least one of your trades out of 10, but the markets do not work through those sorts of probabilities, the majority of people using this style do not necessarily use a well thought out strategy, instead, they trade and hope, hope that one of their 10 trades wins, but unfortunately, a lot of people often realise that it is not quite as easy as that, and so ultimately lose.

There is also an anti martingale strategy, this works in much the same way, except that you would not be increasing the bet size after each win instead of a loss. People believe that they should take advantage of their winning streaks, each win will multiply the current profits, you then reset down to the minimum trade until the next win when you then double up again. This method will help to reduce the potential losses, however a run of losses will still then require you to win a number of different bets or trades in order to make up the differences, so it is still considered as quite a risky strategy, but nowhere near as risky as the original Martingale strategy.

So that is the MArtingale strategy, something that has probably been taught to you, and something that you will find a lot of expert advisors using, it is certainly something that you should avoid due to its nature and the risks involved.

Categories
Forex Basic Strategies

Trade Exit: How to Know When to Get Out

When you ask most traders what the most important part of a trade is, the majority of them will simply state that it is the entry position, however, there is something just as important: the exit position, when you need to get out of a trade. There are a number of different things to think about when it comes to getting out of a trade and they can really make or break the profit or loss that you receive.

If you have made a proper risk management plan and trading plan then you may well have considered the possible exit strategies that you could use. However, there are occasions where things may not go to plan or where you need to make some decisions as you are trading. So let’s take a little look at the sort of things you should be considering.

What are you prepared to risk?

Hopefully, you have a risk management plan in place, but if you don’t, as a trade is going, you need to consider how much of your account you are willing to risk. We would always suggest using a stop loss, but if you haven’t you should not be sitting there watching the markets and hoping that it turns, instead you need to get out, you must consider what percentage you are willing to lose, once the markets hit that stage, close the trade. Learn from this and set stop losses in the future

How much profit do you need?

Pretty much the opposite of what we mentioned above, when a trade is going the right way, when do you close the trade for the profits? Do you let it run and hope for more even though there is a risk that it could turn? Again this is an opportunity to use the automatic closers in the form of take profit levels, this way you will have the profit that you want already set, and it will take it and close the trade as soon as it is met.

What sort of trade is it?

Are you going for short term scalping, day-trading or long term trades? This will have an influence on when your trades are closed, if you are scalping then they should be relatively small and short trades, day trades will often be closed at the end of the day before the markets close and long term traders you will be holding for a long time. Depending on the type of trade, you may need to close it sooner than expected or later should the markets require it.

Is additional analysis needed?

Do you continue to analyze the markets after a trade is open? Things change in the markets, so continually analyzing them can help you understand if it is time to eventually get out of the markets, even if it is not the right time. If the markets are turning, it may be beneficial to get out earlier than expected to help save some losses or to guarantee some profits.

Do you do any of these things, if you have a set and forget strategy with stop losses and take profits then you most likely do not need to, however, if you do not, what makes you come out of a trade and does it work for you? Just remember that coming out early can be both beneficial or detrimental to the overall results. Set the line with your trading plan and strategy and things should be a lot smoother.

Categories
Forex Basic Strategies Forex Economic Indicators

Trading Forex News: Why Risk Assessment Calls for a Different Approach

We know how certain markets, such as the crypto market, foster the culture of sharing news and exchanging information. The spot forex market, however, appears to be calling for a different approach for traders to truly master the skill of trading currencies, building the very needed psychological resilience along with one’s trading account. Some of the market’s most prominent traders even fervently support the idea that trading news is one of the least effective strategies forex traders could ever implement. While a number of traders keep striving to find a way to trade news, a portion of successful traders insists on employing another method. Today, we are trying to understand whether traders should necessarily avoid every type of news, and how reliance on such information affects trading, analyzing claims against incorporating news events in trading currencies.

When we think of news, we should first differentiate between the types of information which can have an impact on forex traders and the second type that has no influence on their trading. The forex community consists of traders, which is distinctly different from investors, which why a number of news announcements on websites such as Bloomberg or CNBC simply do not apply to the currency market. Various sources entirely disregard the forex-related news, whereas other media provides information that is simply not very useful and thus should not constitute a part of traders’ daily routine. In comparison to the previous group, news that forex traders should concern themselves with is economic indicators, which are scheduled news events. These pieces of information always come in advance several times a year (e.g. every two or three months, each quarter, etc.). Of course, traders may suddenly receive some unexpected news at times, but such cases are exceptionally rare and seldom. The benefit of having such transparent information ahead of time is to know factors that can actually affect the market in some way and along with the time of these events’ occurrences.

For traders to be able to make use of such pieces of information, they should first access news calendars, which are available online (e.g. https://www.forexfactory.com/calendar?week=jan13.2019 and https://www.dailyfx.com/economic-calendar). These calendars are an excellent source of information because they offer traders the possibility to protect themselves against any potential pip falls in advance. Nonetheless, even if some of the existing economic indicators or news events lack to provide any information a trader may find relevant, they still have a great impact on trading overall. What often happens is that certain pieces of news alarms people and, as you may already know, the more traders react, the faster will the banks get involved. When the big banks overreact, it usually entails some important market activity ending with the price changing direction. Therefore, consulting news calendars before entering a trade is a crucial part of trading in the spot forex market because traders need to have any available information at their disposal as early as possible.

Some traders assume that managing news events is possible, believing that by possessing these information items gives them control over the market, to the extent that they deem generating a great number of pips in little time possible. Their viewpoint on news events boils down to the idea that the moment such news comes out, they will take specific action accordingly. Should the news be strong, they will go long on their chosen currency and vice versa. They believe that any timely reaction will easily bring them many pips, and we cannot but confirm that such a belief is based on solid grounds. Nonetheless, the fact that some traders managed to achieve this does not prove its quality. Not only does it happen occasionally, which immediately introduces a higher than necessary risk, but it also leads to false conclusions. Wanting to stay on top of news events is equal to trying to beat the traders’ main opponent, the big banks, and attempting to fight the one who decides how the prices will move is a very bad idea in the long run. Failure is inevitable when your adversary is unbeatable, so any attempt to control the news already implies more risk than anyone should have to take on.

Since traders already have no power over the price, they may need to consider the role of the big banks on a deeper level. These banks can choose to redirect the market in any desired way and, even if they ever get fined for manipulating prices, which does happen from time to time, they have enough financial support to withstand and last. You may have already noticed how certain decisions they have made in the past have always been justified in the media, regardless of how incomprehensible or unreasonable those may be. Often when traders receive some positive news regarding a particular currency, a pair involving the currency will suddenly go short and keep the same direction for a long period of time. The forex news media (for example Twitter and Bloomberg, among others) always appears to be prepared under any circumstances, providing some vague explanations such as claiming how the news has already been priced in. Traders, unfortunately, do not possess this information beforehand and each time a price moves in an unusual fashion, traders are made to believe it was them who failed to read through the news or take the right steps. Therefore, going against this powerful opponent is sheer luxury traders need not indulge in for the sake of keeping their accounts.

While the price may at times take a strange direction, there are times when they move in an expected manner. Traders may have witnessed how, when some positive news came out on a particular currency, it become more expensive as a result. News events have the power to dictate whether a price will become higher or lower, but you should know that it is the big banks pulling the strings from the shadow. The news may say where the price will go, but these banks alone will ultimately decide when such action will take place and what will happen with the price before it gets there, moving it up and down to their liking. Apart from special permissions, the big banks also have access to exclusive tools that allow them to see orders, stop losses, and whether traders are going long or short. As they have the ultimate power, they can trigger traders’ stop losses and manage the market as they like. What the big banks especially look forward to is seeing where the majority of traders are going because it is the moment that is the most rewarding for them. The ability to see retail money only helps them earn more by moving the prices against the majority. Therefore, when any big news comes out, they immediately know where the price will have to end up for them to reap the benefits, leaving most traders on the other end of the spectrum.

Some traders may still want to make money trading while the big banks are busy, but this approach will only bring random wins. Unfortunately, this game was designed so that there is always only one winner and traders are not meant to be the ones taking the prize home. You should not, therefore, feel confused or surprised if you realize that the price did not act the way you imagined it would, as this market will never let you build your account this way. While you may have previous success with handling news, you should know that the likelihood of maintaining the same approach long term is rather low. Because many successful traders have already failed to try to play these games in the past, they understand that the best solution is to not get involved. Traders need to seek actions that will grant them control and they definitely cannot control the big banks’ decisions, the news events, or the manner in which the masses are going to reach them. By willfully taking part in the attempt to manipulate news events, you are in fact giving u control over your own money.

The reason why so many traders get involved in such activities is the rush of instant gratification, which practically boils down to the urge to satisfy the greed for becoming rich fast. The best strategy for any trader dealing with such compulsive need is to learn how to properly address the news, and to be able to do that will then require them to have a set plan in place. You do not have to go to great lengths to be able to secure financial stability. Trading five-minute charts, managing numerous screens, and making rash decisions upon entry and exit will not necessarily lead to any lucrative outcomes. By trading the daily chart, for example, you can successfully evade the impact of news events. Just by looking at the news calendars, you can develop insight into the substantial quantity of news happening on a daily basis. You can also, therefore, grasp how many pieces of information the traders using the five-minute chart, which is a stressful endeavor alone, need to manage at the same time. Trading smaller timeframes, hence, does not necessarily imply having more benefits, but quite the contrary.

Traders have probably seen cases of important news going against the majority of people trading smaller time frames that inevitably produce disastrous outcomes for the group in question. Forex traders using the daily chart, however, may occasionally experience some drawdown, but with the right approach and direction as well as technical skills and tools, it is more often than not only going to be a temporary setback until the price eventually returns to its previous course. Even in the case of some unfavorable news, daily chart traders only need to patiently wait out the interim periods and have a ready plan they will see through until the transition is complete. This further entails that traders are required to be prepared in advance in order to protect their trades from any major events by knowing how they will address any type of news they come across. Luckily, traders have such information at their disposal well in advance in most cases and, what is more, these events often concern only one or two currencies, further reducing their impact.

Although these events rarely affect daily chart traders, as described above, they still need to be wary of going in blindly or unprepared. By being cautious and attentive, traders will establish a firm foothold and withstand any alternating circumstances. Furthermore, they may escape a series of unnecessary yet painful losses and build on the momentum of accumulating wins rather than the opposite. To grow an account, you need to think of potential failure ahead of time because in the world of trading currencies you essentially win by not losing. If you drag your account down by taking unwise steps, allowing yourself to be compelled by any upcoming news event, you willfully and consciously engage in activities that will ultimately cost you your account and financial stability. The main benefit of adopting an observant and focused mindset, you prime yourself for success and give your account the opportunity to be much bigger at the end of the year.

An excellent example of the events requiring such a regimented approach is the times of elections when the market behaves in an unusual and uncontrollable manner. Whenever traders attempt to stay on top of those events, they eventually help banks gloat over the results. The U.S. presidential elections and Brexit are the very proof of how external circumstances and unexpected turns of events affect trading because not only did traders witness exceptional turmoil in the market but they also often had their stop losses passed. The market is not intended to act according to traders’ needs and desires, especially under such circumstances, so if you aspire to trade during the times of utter commotion, you are entering a game you cannot control. Some traders may have had some success while trading during elections, but such wins can hardly be more than exceptionally random and rare instances of gaining the upper hand. If you are ready to commit to a disciplined approach, you may need to reconsider trading elections and thus substantially reduce the risk levels.

Certain news events affect the market long term, leading to more lasting changes. When Greece was undergoing major challenges with the overdue debt burden, the European Union was weighing a decision whether to provide further assistance or refrain from lending any more money to such a greatly weakened economy. Through the course of this long period, a plethora of varying news events would suddenly come out, rendering traders confused and lost. They could not know what the news would indicate, how the market would react, or the direction EUR would take. The same scenario repeats itself every time we face any major transformation, directly affecting the market and the related currency. Therefore, the best strategy any trader could adopt in these long and unpredictable periods is to avoid trading the currencies in question. Eliminating additional risk and ignoring all pop-up news for as long as it takes for the dust to settle provides traders with real control in tumultuous times. Fortunately, with having the option of trading eight major currencies, you still have enough room to keep your account active and earn a profit in a safe and sustainable manner.

With regard to short-term events, it is always best to consult a news calendar prior to entering a trade, making it an essential part of one’s daily routine. There is a great number of events traders can ignore; however, a portion of news events has proved to trigger trading by knocking individual stop losses. NewsImpact.com, for example, is an excellent resource offering a historical overview of how prices moved when news came out in previous years. It provides into how an event that occurred two years ago may not have the same effect at present and vice versa. The impact of events can change substantially, where something traders found to be entirely unimportant before can gain importance in time. Nonetheless, what we can control and use as a relevant piece of information is the knowledge of events that historically elevated risk levels for traders, which is why understanding how each currency is particularly susceptible in a specific situation is crucial for both avoiding volatile market activity and maintaining control over one’s trades.

USD

The correlation between nonfarm payroll (NFP) data and the strength of USD proves how trading during this biggest news event of each month is an unwise decision, especially due to its tendency to bring about quick and erratic market activity. The circumstances involving interest rates and The Federal Open Market Committee (FOMC) also require special attention because each time interest rates rise or fall, so does the people’s interest in those currencies. Whenever there is an increase in interest rates, traders look forward to investing their money in the currencies in question owing to the potential of getting a bigger return. Likewise, in the scenario where interest rates decline, traders will inevitably search for better places to direct their money.

Furthermore, each time certain prominent figures decide to speak publicly, their words appear to have a bigger impact on the market. Jerome Hayden “Jay” Powell, the current Fed Chair, is an epitome of a public persona whose apparent disagreements with President Trump may be the source of additional concern because of the number of different interpretations people can derive. When we are assessing words, we are not dealing with any quantitative data, so the result of the manner in which the majority of people conceptualize what was said may lead to some unexpected changes the markets will undergo. From the side of quantitative factors, traders should pay attention to the Consumer Price Index (CPI), which measures price level changes, and these numbers have only recently started to have an impact on USD. As said before, the news impacting this currency may vary and change in relevance over time, but their current impact should not be disregarded.

EUR

Due to the fact that this currency spans across several countries, the impact of the news is of a lesser degree than it would be in case of a currency dominating a single country. Apart from interest rates, which prove to be a common factor among all currencies, people trading EUR should pay additional attention to the news coming from the European Central Bank (ECB) because the previous President Mario Draghi’s seldom statements often caused quite a commotion with regard to EUR.

GBP

One would expect economic indicators to have a stronger impact on a country that is as small as the United Kingdom but appears to be irrelevant in this case. Interest rates in this country depend on the Monetary Policy Committee or MPC whose nine members’ vote determines the timing and the direction of interest rates. News calendars will typically disclose information of a uniform nature, where all nine members agree on the same decision. Nonetheless, should this ever change, it may cause GBP to act strangely causing traders to feel alarmed. Another important news concerning the currency is GDP owing to the fact that a country smaller in size is naturally more affected by its gross domestic product than in the case of larger countries.

CAD

Aside from interest rates, the Canadian market has proved to be vulnerable when it comes to the employment rate, with these numbers often oscillating at the same time as nonfarm payroll which allows traders to tackle two factors simultaneously. Retail sales should be included in the traders’ assessment of the market’s stability and their next move. The last factor in terms of news events relevant for this currency revolves around CPI, whose significance has grown as of recently.

AUD

Interest rates and employment numbers also affect this currency as they do some of the previous ones. Yet, what is different about AUD as opposed to other currencies is the impact of the news coming from China. As Australia’s favored trade partner, events occurring in China would naturally impact AUD. Nowadays, however, due to the fact that the Chinese economy has subsided in the recent years, they are not going to buy as many minerals and materials from Australia as before when the country was in the building stage, which lessens the overall impact of news events originating from China on AUD.

NZD

New Zealand’s currency is affected by a number of factors discussed above, such as the employment rate and GDP. However, we also need to introduce GDT, global dairy trade, as dairy does constitute an important part of the country’s economy. Therefore, whenever the news of GDT comes out, it naturally makes a difference in the market of the Kiwi dollar. It is important to remember that some news calendars may not detect or disclose this, or any other piece of information for that matter, which further entails that you may need to consult several news calendars (consider the previously-mentioned options) in order to put together the complete picture. Interestingly enough, interest rate appears to not have had a major impact on the currency in question in years, which certainly does not indicate that it will not become an important factor once again in the future.

JPY

One of the last two currencies which seem to undergo little impact of news events is JPY. As with NYD, the Japanese currency has also not seen any activity worth mentioning in terms of interest rates since they seldom change, but they may pose a threat in the future when they do. Luckily, it a single piece of news that comes out only once each month, which does make it easy for traders to monitor and detect any news-worthy changes.

CHF

The Swiss currency, similar to the ones before, may one day start depending on the fluctuations of interest rates, named the London Interbank Offered Rate or LIBOR in Switzerland when traders are advised to sit out and patiently wait for the currency to stabilize.

While we have analyzed the main news which may have an impact on the major eight currencies at present time, you may come across other news events as the nature of the market is to always grow and change is naturally an inherent part of such growth. We also need to mention that both banks and people trading in the currency market can choose how they will react regardless of individual expectations and/or needs. The example of the 2019 flash crash should serve to teach traders a lesson that even if we know some information in advance like we knew how Apple sent out a warning concerning the Chinese economy, big banks still allowed the market to go into a craze. News, be it small such as this one or a more sizeable piece of news, can at times stop traders. However, we need to accept it as an integral part of the forex market and decide to move on. While there is a vast number of aspects to trading currencies traders cannot control, what they can in fact do is devise a plan that will serve to protect and support them on their path of growing accounts and finances.

For every news event coming out, each trader should be mindful of the available steps he/she can take so as the secure the best possible position at the time. If, for example, traders are not trading a specific currency pair while receiving some important news, they are advised to refrain from entering any trade involving the currency in question should the news event be occurring within the following 24 hours. If there is a possibility of securing any candles prior to the time frame we have just mentioned, you may freely do so. As long as the trade falls under the period of one day, you are entering the market at the risk of endangering your finances and your account at the same time. This rule will surely introduce more control over news events and limit the urge to trade recklessly, thus providing the necessary stability all people trading in the spot forex market should strive to ensure.

If the news event, however, involves the currency you are trading at the time, you will be able to apply a few different strategies depending on the stage of the trade you are in. In case you are in a trade where you are slightly losing (e.g. 50 pips), but your stop loss has still not been hit, and a big news event is about to take place within the 24-hour period, you will need to exit the trade so as to protect yourself. Taking such loss may be difficult, but considering the fact that by staying you would in fact be open to facing an even bigger loss, this option is the safest it can possibly be. While it may not happen very often, you do not have to get yourself to the stage where the price passes your stop loss without having been triggered. Hoping that the price will go back your way immediately involves too much risk and the cons are simply incomparably higher than the pros. The only way to eliminate a risk this big is to close these trade because the likelihood of your account recovering afterward could be highly questionable otherwise.

If you have entered a trade that is now winning, there are several important facts you should take into consideration. Firstly, regardless of the fact whether you have already taken any profit, using the ATR indicator as your take-profit point is always advised. We can typically see two scenarios unfolding in this case: either a trader has entered a trade but no profit has been collected yet or they have already taken some profit off the table but the price is now falling. In either case, there is only one solution that will mitigate the risk that comes from trading under the impact of an upcoming (or very happening) news event. The only solution here is to take whatever profit you have made so far and exit the trade at peace. There will surely be people who earned a big profit during the time of an important news event, but what this approach is about is limiting the losses. If a trader was lucky enough to go unharmed once, the same circumstance may not play out again which is why this risky approach is then not your best long-term strategy. Even if a trader chooses to move their stop-loss to the break-even point, the odds of a stop-loss being taken out under such circumstances are higher than they may realize. Whatever preventative measure you think you have included in your trade does not truly mitigate the risk, which is why exiting such trades is the only logical and safe solution.

The very last context we will be analyzing today concerns trades that have already scaled out and are still winning. If you have taken your profit at the ATR value, for example, and you are satisfied with how the trade is progressing, you should carry on as if it were any other normal circumstance despite the big news event approaching. You have probably moved your stop-loss point to the break-even or you are relying on a trailing stop, so there is no need to include any other measure at this point. This scenario has several benefits starting with dealing more pips due to trading the daily chart. Moreover, there is a chance that the price does not hit your trailing stop, but keeps moving in the desired direction even further instead. Be it this best-case scenario or a somewhat different one, your trailing stop will always provide the protection you need under these circumstances. Regardless of which scenario you get to experience among the ones discussed in this article, you should always assess the risk levels and take any preventative measure you can so as not to end up where the majority of traders do.

Finally, the notion of going against the big banks is a losing game and the game which will inevitably, sooner or later bring about massive failure. Your job is not to play the game where everyone is meant to lose, but to navigate around the challenging circumstances the best you can. Recognize the repetitive cycles and acknowledge the news events in a rational, non-compulsive fashion. Learn how to read through the news and understand how some events will take months to fully play out, along with taking a number of traders off the trading scene. Whenever you notice the tension building up in the market, the best strategy is to simply be patient and wait for the turmoil to pass. You cannot predict how any participant in the market is going to react, which is why getting involved in any of the events you cannot control is a risky decision. Use wisely the knowledge on the events you should consistently avoid and keep researching the market and the currencies in the context of the states they govern.

Include news calendars in your daily routine and adopt a healthy, sustainable action plan which you can call upon at every trade stage or in any circumstance. Whatever action you are planning to take, you should always rely on the system you developed because it will provide you with technical support this line of business heavily requires. Lastly, while the effect of having such a comprehensive approach to trading may not help you see any immediate results, by the end of the year your account will provide transparent and tangible proof of how having a structured plan supported by technical tools and factual knowledge always leads to success.

Categories
Forex Basic Strategies

FX Trading Strategies To Avoid: Grid Strategies

There are thousands of different strategies, some are fantastic and work for most trading conditions, some work really well during specific trading conditions, some work with some of the time, some most of the time. Some are safe and some are a little bit riskier, we are going to be looking at one of those slightly more risky ones, in fact, it is one of the riskiest ones. It is known as a grid strategy and it works much as the name suggests, so let’s take a look at what this strategy involves and why it is so risky.

There are a lot of different variations of the grid strategy, but before we look at any of them we need to outline what a grid-based strategy actually is. To put it into simple tmr,s if you look at the charts, you will see a grid on the background, this is similar to how you need to imaging the strategy, there are vertical lines going up the screen at fixed intervals, lets for the examples state say that the grid lines are 25 pips apart. A trade is opened if it goes the right way, it is done and profits can be taken.

However, if it goes the wrong way, when it gets to negative 25 pips, you will open up another trade going the same direction as the original, if it then moves another 25 pips to a total of 50 pips negative, you will open a third, this will continue until the markets reverse and the trades can all be closed at the same time for an overall profit.

So you can see how it can be a little risky if the markets continue to move against you, there is a very good chance that you will continue to open up new positions until you get a market call and the broker protects itself and you by closing out your trades. That is the barebones basics of how the strategy works, there are of course a lot of different variations of it. Some make it safer, some riskier and some just make it go a little crazy, but whichever version people use, it will have a lot of risks attached to it and so this strategy remains very risky and is one of the most dangerous ones to use due to its lack of basic risk management.

Now let’s take a look at what some of these variations of the strategy involve:

Grid + Martingale

The martingale strategy is another strategy that you may have heard of and is another sky one, so you can imagine that combining it with the grid strategy, which is an already risky strategy could be making things a little worse.

This strategy works much the same way as the standard grid strategy does, its main difference is that when more than one trade is opened due to the markets going the wrong way, each subsequent trade is opened at a larger size. What size that depends on the trader using the strategy, some people use double the lot size, some people increase it by just a specific amount each time. Other than that, it works exactly the same way, at a set interval the new trade will be opened.

As the lot sizes are now increasing it will make a couple of differences, the first is that the drawdown that the account experiences will be a quite a bit higher than the standard version, the other differences is that if the markets do decide to change and reverse, you will be able to get out of the trades in profit from a much smaller move. So there is a positive and a negative, but overall this version of the grid strategy offers a lot higher risk to the standard one, which we will remind you that it was already quite risky to begin with.

Extending Grid

As this is a grid-based strategy, it works in a similar fashion once again, as the markets go against you, new trades will be open dup at set intervals the main difference for this version is that the grid expands as it gets large, so the first trade will open after 25 pips, the second would be after 75 pips and the third would be after 150 pips, so as you can see, the gap between each trade is getting larger, this helps to slow down the speed that the drawdown will be increasing. This version of the grid helps to reduce some of the risks that come with the strategy, but this does not make it a riskless strategy, it still involves a lot of risks.

Increasing or Decreasing Sizes

Another variation of the strategy takes a different approach to the lot and trade sizes rather than the size of the actual grid. There are two different variations within it, one where the trade size decreases with each trade and another when it increases, we have already mentioned the increasing version in the form of the martingale variation, so the other one is the decreasing size. This is where each trade is opened at a slightly smaller trade size, this is done to try and reduce the speed that the drawdown increases while still allowing you to open up additional positions. This is a version that is far less performed due to the larger reversal required but it does have the benefit of not risking as much of your account as quickly as the other versions do.

Those are a few of the different styles of the grid strategy, there are of course additional variations that people use, what is important to note is that they do not change the actual mechanics and ideas behind the strategy, so we know what some of the versions are, but in what situation is this strategy actually effective in?

The strategy works best in a market that is oscillating and ranging, it moves up and down and does not break out into any trends, this allows you to consistently take profit at each move up and down as you would be opening up trades, taking profits and then opening another, this continues and can be very effective when the markets continue like this for an extended period of time.

The main issue with this strategy is when the markets begin to trend, when this happens, things can begin to go wrong very quickly. A trend can last for hundreds of pips, if this happens the grid will open up a lot of trades and unless you have a very large account, there is a good chance that the tread can continue long enough to cause an account to blow. The only hope with people using this strategy is that the trend reverses or that there is a pullback where you are able to get out of all trades at the same time with a profit.

So those are some of the different grid-based strategies, they are some of the strategies that people are often told not to use, and for good reason, the strategies are very dangerous and can put your entire balance at risk, so if you are looking to protect your account, we would strongly suggest that you try a different, more conservative strategy to a grid-based one.