Categories
Forex Service Review

Creature Automated Trend Scalper Review

Creature can be found within the Experts section of the MQL5 marketplace, it was created by Natalya Sopina and was first uploaded onto the marketplace on the 23rd of July 2019, it has not received any subsequent updates and is still at version 1.0.

Overview

Creature is an expert advisor that was designed for the MetaTrader 4 trading platform and is a fully automatic EA that specializes in scalping. The EA does not use martingale or grid trading styles and works best with the GBPUSD, USDCHF, GBPCHF, CADCHF, GBPCHF, EURCHF, and AUDCHF currency pairs, although it can be used on all pairs.

The EA uses rollbacks from main trends to find its trades, it does this by using Bollinger Bands to determine the trend and channels. The EA will open its trades at the channel breaks and will filter out false breaks. It will take profits, complete stop losses, execute trailing stops and time out in order to close out trades.

Service Cost

The Creature EA will currently cost $60 to purchase it outright, this will get you up to 5 activations of the software. You are also able to rent it, this can be down on a monthly basis and will cost you $20 per month. A free demo version is available, this will only be usable with the strategy tester within MT4 though.

Conclusion

There are no reviews at present which is a shame to see, it also means that we do not know whether the EA is working as intended for those that have purchased it. There are a few comments, they are all from the developer themselves giving some time and settings. The most recent comment was in 2019, due to this we would suggest getting in contact with them to ensure that it is still being supported before you make a purchase or a rental.

Categories
Forex Trade Types

Technical Trader Algorithm Guide Example – Trend Continuation Trades

Trend following strategies is the best method of trading according to research studies. Traders will pick a trading method that is the most comfortable or profitable to their living style and psychology. Therefore, your best method does not have to be trend following. On the other hand, most professional traders believe you can adapt trend following strategies to any trader personality type. It is just a matter of how well you improve your psychology part once money management and technicals are in place.

Trends are mostly not consistent and predictable so traders devise ways to have better odds in this environment. Trends can be parabolic, mild, and long, with pullbacks, low and high bases, or switches in momentum. Your trading system will need to have a mechanism to generate a signal to continue following the trend. This article will present one example of how you can implement a ruleset, indicator measurements, and algorithm to have a definitive decision when any of the above trend characteristics manifest. Your systems can take exact values although as every trader has different trading styles, you should adapt it to your preference. 

Prop traders employ a set of indicators and elements to know when to enter a trade –  at the best moment when a trend has started. That trend needs to have momentum. For this purpose, they measure volatility or volume. This trend is confirmed by confirmation indicators we wrote about, and money management tells us how much to risk according to the currency pair or other asset volatility. Other elements also have their roles so we catch the best probability trends once they emerge. But more often than not, our exit indicator can signal us to exit, only to find out the trend just had a pause a day or two, just two candles if we trade on a daily chart. Whatsmore, the trend continues for a week with great momentum.

Now, we can feel we missed out on a dramatic profit, but we have a rule set we do not deviate from. Continuation trades are also rule-based, and since trends are not consistent, continuation trades are common, so common they can even make the majority of the trades we make. Some prop firms take into account higher and lower time frames signals to pinpoint the best entry or exit. Yet, for continuation trades, it is enough to stay on one if it is a daily time frame, since higher time frames, weekly and monthly can have many significant events for a currency. A daily time frame is used in our algorithm example, including the previous articles.

In our MACD indicator article, we gave an example of how the MACD can be used for continuations. However, there are a few rule modifications once we have a trend below or above our baseline element. Additionally, other elements such as the volume filter, are completely ignored. Now you may think you spent so much time on finding and testing the volume indicator only to ignore it now is not a rule you want to implement. If you remember the article we talked about the lagging indicators, you will notice every volume or volatility indicator we know needs data to measure to have a conclusion if the price action is flattening out.

You may rely on chaos theory and look at the charts alone to determine if the market is going into the flat period before any volume indicator signals. These decisions are predictive, it is hard to backtest your decisions like this and they are prone to previous trade success and emotional state. If you use a volume indicator, continuation trades will likely be too late, you will enter a trade once a trend is in a pause or reversal moment. Consequently, we are eliminating the volume filter from our algorithm for continuation trades only. You can backtest this decision if you have better results without it. In our testing, it was always the case. 

The Baseline is our ultimate major trend filter. It tells us where a higher scale momentum direction is. Using a baseline we filter one trade direction, short or long if the price is below or above the baseline at the end of the day trading session. Based on this rule, we enter only the trades in the same direction as the major trend momentum. Clearly, there is a higher probability a trend will push the price more in the same direction than turn around, even though reversals happen and cut a part of our profits from our trades or cause a loss if our take profit levels are not reached. This is what the baseline element is for when we talk about continuation trades. 

In forex trading, it is easy to find certain market conditions that do not fall into our rule book. Such does not happen often if our plan is already developed and tested. However, there is a common condition that may confuse beginner traders if they follow our guides. It is a condition when the exit indicators call for an exit even though the trend confirmation indicators still show the trend is still going on. As mentioned above, we do not blindly ignore the exit indicator or blindly listen to the exit indicator. We create an additional continuation rule that says to enter a continuation only when the confirmation indicators show a new entry signal. This means they have to show a counter-trend signal before a continuation can happen once they generate a trend-following signal again.

If you have a confirmation indicator that also doubles as an exit indicator, then it has to show an exit before a new continuation signal, in this case, it is easier to find continuation trades as the signals are at the same moment. Yet, in most cases, exit indicators act before confirmators, so you need to watch for an alignment. Once you do some continuation trades, it becomes easy to follow the algorithm, even if it may look complicated.

Money management also needs to be adjusted for the continuation, not just the volume. You may notice the ATR money management is always in effect, for all trade types your algorithm shows. You will still use it as described in the previous articles and guides without exception. However, the part that does not include position sizing measures, is ignored. So not only do you ignore the volume for continuations, but also the 1xATR price level (values used in our example) that is past the baseline. Trends that continue are often way past the baseline, so the rule when we enter a trade that prohibits fast movers past the 1xATR range from our baseline does not make sense. Otherwise, we would never have the benefit of continuation trades that happen a lot.

Continuation trades do not have this ATR – baseline rule but it does not mean you should ignore the crisp money management position sizing setup we have described in a separate article. Only when the price cross-closes the baseline we apply the ATR range rule. So we define a trend in the continuation mode only when it never crosses the baseline again but the confirmation indicators show another signal to go. 

Now we can present examples of how we manage these conditions with the simplified system according to some prop traders. Again it is all defined, we do not have to think if the trend is continuing or not, the system covers this situation, all we have to do is follow it. It is easy to backtest and forward test it too. Let’s take the MACD indicator we have used first as it has a few parts combined to generate signals – two moving averages intercrosses and a zero line cross. It is good as an example of a continuation trade idea. In the picture below we see AUDNZD daily chart with the MACD on default settings without the baseline or any other system element. 

The zero-line of the MACD (gray dashed line) is like our baseline, a higher scale major trend gauge. Once both MACD moving averages cross it, this signals that a major trend is starting, the grey vertical line on the chart marks the moment. So this is a short signal, but we have a signal to exit once the faster, blue MACD MA crosses the red one. Both MAs are still below the zero-line telling us this is probably a small correction and we are still in the major downtrend. Soon, we had our first continuation trade, the faster blue MA crossed the red down again, marked by a blue vertical line. An exit signal was generated again and a new continuation until the major trend was over later when both MACD MAs crossed the zero-line at the far right end of the picture.

Some of the continuation signals might be a loss but these are losses we have to take. We do not account for the volume filters here so we have to be careful about these trades and maybe avoid taking them if the forex market overall is not moving much. Such conditions can be assessed with the mentioned $EVZ or VIX Index we wrote about before. Combined, continuation trades capture the biggest part of the major trend, but not all, this is the price we have to pay if we want to control the risks. 

Now, let’s add a baseline and change the main confirmation indicator for the same chart. We are still not going to include other algorithm elements, such as the volume and exit indicators you should have included. For the sake of simplicity, we will use the Chaikin Money Flow indicator for entry and exits, set on the 8 periods. We also include the 20 SMA as the baseline. The Chaikin Money Flow also contains a zero-line, once the signal line crosses it down, it is a trade entry signal. Also, once the line crosses it up, we exit. As in the previous picture, the major trend started once it close-crossed our blue 20 SMA baseline, the moment marked with a gray vertical line. Chaikin Money Flow agreed and we entered the trend. Pay attention to the ATR entry rule here as well as the volume conditions your system should have. Chaikin Money Flow gave us a signal we need to exit for the first time, marked with a red vertical line. This was probably a winner trade if we put our take profit at the 1xATR level.

Three days later, Chaikin Money Flow gave us a short entry signal again, the price level closed below our baseline so this is officially a continuation trade, no ATR-baseline rules apply for trade entry, we do not look at our volume indicator, we just place our usual risk management (position size, take profit and stop-loss orders) according to the ATR levels. A candle later we have an exit signal with a small profit and then Chaikin Money Flow shows to enter once again without exit until a few weeks later. This captured more profits than the MACD even though we now used more sensitive indicator settings. Interestingly, we had another continuation trade that ended in profits until the price close crossed the baseline, marking an end to the major trend and our current trade.

Again, we have not included system elements you should have to cover the most important aspects of the forex market. The examples above are only to demonstrate how to handle trends that more often than not have inconsistent momentums. You should always test how your system performs, including all trade types – continuations, pullbacks, new trend entries, including trade exits, and the trading rulebook. As you may have noticed, reversals are not the trading type for trend-following methods. Hopefully, now you can have a complete system structure you can follow and come back to if you need clarification. Of course, you can add-on to the mentioned example and build your own structure while exploring the world of forex. 


Categories
Forex Basic Strategies

Trend Trading When There Are No Trends

During a larger part of 2019 traders have witnessed probably the least volatile forex market in history. These periods are often followed by steady bullish equities markets when most of the capital goes on this side of trading. Forex traders that use trend following methods have two options in these situations. Trade as they are still in trending markets and give back what they have earned during the previous year or use this environment to their advantage. The situation from 2019 is perfect grounds to learn, test, and separate consistent traders from the rest. 

To some degree, trading forex does not put you in a position where you feel out of control, like in the stock market with reports or crypto with so many unannounced events, etc. In forex, even when trades do not go your way, you still have some control. There are a few ways to recognize dead markets, some are quite obvious but beginner traders may need more clarification. Taking advantage of dead markets does not come from trading, it is by adjusting our trading systems to avoid them. Experiencing dead markets in real-time is a great opportunity to secure our future results. So traders will need a plan, and we will put in place one as an example of what you should do when you enter flat waters. 

First, a tool is needed to measure how volatile the forex market is. Volatility can also be substituted with volume, what we want to measure is the activity on the market. One such example tool used by prop traders is the Euro FX VIX ($EVZ), Index created by CBOE. Pay attention to our Volume articles about incorporating filter indicators into your system. This tool is just another filtering method that can be applied to your plan outside the usual MT4/5 indicator combo. Now, the $EVZ Index is published by a few charting sources, one can be Yahoo Finance, barchart.com, TradingView or you can even go to the CBOE site. If you notice the “Euro” in the Index name, do not think it applies to the EUR currency only, it is a good indicator for the overall forex market volatility. 

$EVZ presented as a histogram on Yahoo!Finance:

In the picture above we can notice a sharp jump in the activity once the world was hit with the COVID-19 pandemic. Just a few weeks before, the $EVZ was bottoming below the 5 mark for quite some time. The whole of 2019 was one of the quietest long periods in forex history. The Index can also be represented as a bar chart but you should not pay attention to the highs and lows, just focus on the close value. The 2019 anomaly created a stir as trend traders found their systems losing more than usual and just after the dead period traders experienced the pandemic shock. To adapt, a completely different instruction has to be used for your trading plan. Another interesting correlation to dead markets is the movement of the equities market. What some traders have found is that when S&P 500, for example, is trending but slowly, in constant small increments each day, forex markets start to die out. 

In the picture above we can see whenever a gradual S&P 500 (red line) increase is present, the $EVZ (blue line) Index is slowly waning out. Immediately after a disruption in the equities market, the forex is full of currency flows. Downward equity moves are especially sensitive as people move the money out of equities and move into forex or other markets where investing is more lucrative. The negative correlation is evident, since 2017 the S&P 500 is slowly moving up and forex is not what it has been before 2014 where trend traders’ standard gain was around 200 to 300 pips a day. 

If we take a look at the ATR indicator, calm periods can also be spotted which can drive trend followers impatient. They will not get signals, the signals are not resulting in long trends or more likely they are fake moves. Trend following strategies have only one weak moment and that is until the Take Profit target is hit. After that, prop traders secure their wins by scaling out and moving Stop Loss orders to breakeven. Signals that end with a reversal before the TP is most likely a loss and are more common in dead markets. 

Trader’s psychology is at the test here. When you are in a dead market and you are losing, this is a good thing! It is time to take advantage of this. Understand these conditions happen and will happen again. The next time it happens your trading plan will be ready. Chaos theory applies, the order goes into chaos, and chaos back to order. In case you are a beginner and just testing your system for the first time in 2019, know your system will be adjusted to this dead market and may even be not as successful as you would want. On the other hand, since you are a beginner, you should be trading on a demo without any real capital to lose. To some traders, if you are trading in dead markets and still on breakeven, your system is on a good track to endure dead markets and reap consistent gains when it is not. When you are testing your volume indicators or tools, dead markets are extremely good for forwarding tests. Once you have picked your favorite volume indicator it should filter most of the flat mini periods in a dead market by keeping you from taking any trades and even give you small winners sometimes from rare trends worth taking. This element is crucial but some may find it is the hardest to find. 

If you are still struggling to find a good volume indicator then just go and use the $EVZ we have presented. Create a set of risk management rules for your trading and apply them to your trading system. As an example some prop traders use, whenever $EVZ value is below 8, reduce your positions to 50% of what you normally take. If it goes below 7, use only 25%, stop trading below 6. This measure alone will benefit your end line and filter 90% of bad signals when combined with your volatility indicator. When you realize you are losing consistently at some game or market, avoidance is one great and simple measure that will help. Avoidance or filtering your signals in an environment where you lose is the same principle, just formulated into a strict trading plan. Even though it is fun to be in action, your ability to avoid it is what will separate you from others. 

Another interesting conclusion prop traders made during the dead markets is that the USD pairs are just not good even for small trend signals. So their suggestion is just to avoid all signals from these markets once you measure a dead market. Sticking to cross pairs is also going to be tricky but you can make one adjustment to increase your odds. Scaling out principles explained in one of our articles where you leave out a part of a position to continue riding the trend may not be a good idea in dead markets.

Since trends are not going to last for very long, it is just better to take a whole position at your first take profit target. So whenever $EVZ is below 8, for example, make this adjustment to your system. Those 200+ pip trends are not going to happen, so all of your high percentage setups may just lack that extra mile that makes all the difference on your account. Just avoid aiming for big and cut everything at your first price target. If you are following our ATR based money management, your risk to reward ratio will be 1:1 in these conditions. This is not good money management for normal conditions and will not provide you with a positive account, it is just temporary. The risk of a reversal is increasing as you keep your position longer, so based on testing it is just better to end sooner.

Once the market is active again know that your volume indicator and system are still calculating historic movements and the signal is not there yet. More often than not, the first trend after the calm phase will be missed since your indicators are lagging. As mentioned in the Volume articles, these indicators need data and would be useless if too sensitive. Be ready to accept missing out on first movements after the dead market. Do not attempt to make indicators more sensitive just to grab the first trend, it will make your system susceptible to fake breakouts frequent in calm markets and you will face new losing streaks. Experts even say the first strong moves are likely to be corrected after a day or two, and that means 1 or 2 candles if you are trading on a daily chart. Relax and know your account endured the storm (calm market) of fake moves where other traders not accounting for the volume (which is quite often) lost their morale and most of their accounts. Robust trading plans with these elements are only a result of your hard work majority of traders just lack. 

Lastly, there is one more adjustment you can make when you are close to being out of the game. It is an extreme indication something went wrong with your plan, money management, or psychology part, but if you are on the line for some reason try changing your target timeframe. Daily charts may lack conviction but smaller time frames are certainly better. Here, your daily chart trading system (for example) will be performing in an environment it is not designed to so expect less impressive results. However, the system you have designed should be universal, if you are following the structure we have provided before. Smaller time frames have a lot of other factors you need to pay attention to. This also means you need more time, more nerves, and less sleep. News event moves here are bigger and more unpredictable, then we have trading sessions and more factors. The smaller time frames we go to, the more nuances can get our trends to reverse.

However, here is also where you will find your volume if you desperately need to trade. Such needs may come if you are expected to trade by your client or a prop firm and you are in a dead market. Sometimes it may happen because you need income. If you need income by trading forex with money you cannot afford to lose, know you will fail in the long term. Other reasons to change your timeframe such as impatience will also lead to failure. Simply know forex does not forgive, it can only serve those who put in the work in the system and train their mindset.

Categories
Forex Signals

Trend Pullback In USD/CHF Pair

Categories
Forex Basic Strategies

The Secret Formula for Successful Trend Trading

Why do trends work? The momentum-or inertia of prices to move in the same previous direction beyond what we might expect from a random path-is the oldest, most intense, persistent, and ubiquitous investment factor of all the discoveries and analyses to date.

Why do trends work? It is the oldest, most intense, persistent, and ubiquitous investment factor of all discovered. However, empirical evidence alone does not guarantee that this or that anomaly will continue to manifest in the future. As we saw earlier here, in emerging phenomena produced by human actions such as economics and markets, empirical evidence is never enough and we need to know and understand why things happen. We then ask ourselves a few key questions:

  • Why does this phenomenon occur in all markets and at all times?
  • Why does this phenomenon occur in all markets and at all times?
  • And most importantly when it is actually used to invest our money: will inertial prices continue to show in the future?

Understanding how and why price inertia is generated is essential because if the reasons behind it are inevitable, then inertia will also inevitably persist in the future and we can use it as a tool to invest. The good news is that there are at least three reasons for this inertia to occur, to last, and ultimately to be an inevitable phenomenon such as the existence of economic cycles:

Why Do Trends Work? Structural Reasons for the Collective Investment Industry

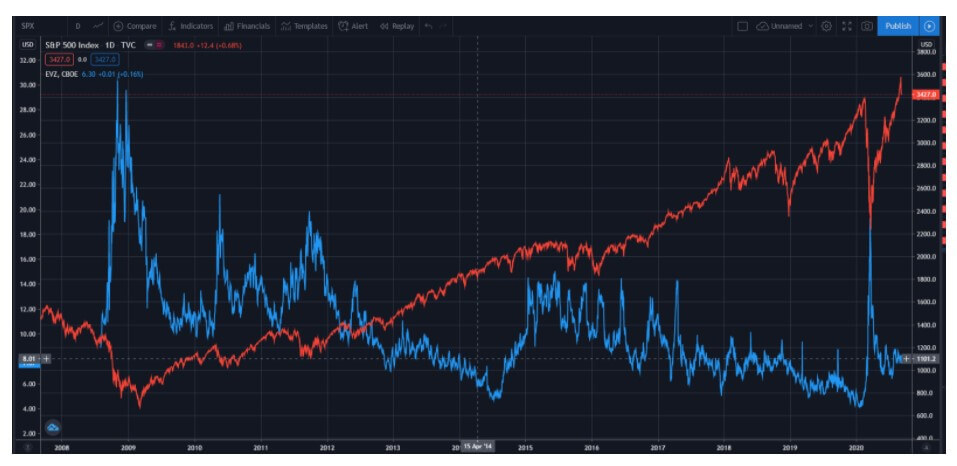
Most institutional investors responsible for funds or investment portfolios have to comply by law with pre-established market risk limits in their prospectuses. This forces them to reduce their exposure to those assets whose risk (usually measured by their volatility and/or VaR) is growing. I mean, to sell when volatility goes up. By complying with the legislation, their sales help the formation and continuity of bearish trends. On the contrary, a decrease in risk (a drop in volatility) leads them to buy more, in turn fueling the upward trends in assets that are rising in price.

But it is not only the regulatory control of risk that feeds trends. The professional managers, on a personal level, are prisoners of the benchmark that their funds try to overcome (without hardy success, as the works of Pablo Fernández and the SPIVA reports demonstrate), so they cannot “stay out” of the bullish movements. If you don’t buy the assets that are coming up and sell them when they go down (even if you don’t know why or disagree with the reasons for the move), you run the risk of walking away from your benchmark and getting fired. The fear of losing their jobs translates into feeding, to a greater or lesser degree according to their independence to the benchmark, bullish and bearish tendencies when they appear. As I have repeated on other occasions, the professional managers of large firms do not manage the money of their clients, but their professional survival.

The professional managers of large companies do not manage the money of their clients, but their professional survival. In addition, when a fund is surpassing its benchmark, it draws the attention of media and investors and attracts new subscriptions, which have to be invested in those assets in which the fund is already invested, further fueling previous upward trends. The same is true of those funds that are falling in the ranking behind the benchmark: they suffer refunds that force them to sell and thus feed the bearish tendencies.

In short, there are strong incentives for institutional actors to do what others do. That is, it is the very idiosyncrasy of the management industry (investment and pension funds, large insurers, etc.), coupled with the incentives of their own professionals, This obliges the major players who provide the bulk of the volume to the markets to align with the trends and to feed them inevitably. There are strong incentives for institutional actors to do what others do.

As we see, both legislation and the incentive structure in the industry should change radically so that this reason would lose influence on price formation and its inertia.

Why Do Trends Work? Macroeconomic Reasons

Regardless of the structural reasons for the industry we have just seen, the existence of economic cycles causes some assets to behave better or worse than others for long periods of time.

Each state of the cycle or combination of states-expansion, recession, inflation, and deflation-generates different underlying dynamics in the economy, causing some types of assets to revalue more than others in different periods. Depending on the time of the cycle in which the economy is polarized, there are therefore trends of several years usually called bullish or bearish markets (secular bull/bear markets). For example, during periods of economic expansion, which can last from one to twelve years (we have 10 years with the current one), the stock market as an asset is revalued more than the rest of the assets (as a manifestation derived from the economic boom itself), unlike during economic recessions. These secular trends are also unavoidable and exploited by some inertia strategies that focus on the long term of economic cycles.

In order for this phenomenon to cease to occur, economic cycles should die out, which is impossible due to the inevitable emergence and spread of imbalances throughout the economy, or at least the connection between the behaviour of certain assets and the phase of the cycle should disappear. However, it is precisely through objective observation of the prices of certain assets that we can measure with some precision the stage of the cycle in which the economy finds itself.

Why Do Trends Work? Behavioral Reasons (Biological and Evolutionary)

Why do trends work? The pervasiveness of fear and greed in financial markets is evident to anyone with a modicum of investment experience, as ultimately markets are made by people.

Everything that is developing in the world, at any time, resemble precedent. This depends on the fact that being works of men, always having the same passions, by necessity they must produce the same effects. -Machiavelli, Speeches (Book III, Chapter 43)

The human being is gregarious and fickle by nature. What costs you the most, especially when it comes to investing, is to be consistent and faithful to your principles and strategies. At the moment when the price of a certain asset begins to rise significantly, it becomes the topic of fashion, narratives are built to justify it and attract the attention of investors. Regardless of whether the reasons for such revaluation are more or less justified, new investors join the movement by buying in the hope that it will continue. This contributes to nourishing the upward trend in a virtuous circle of growing and widespread greed transformed into buying pressure.

This self-fulfilling prophecy also works in reverse. When a price falls steadily, doubts, negative narratives and fear of losses spread quickly among investors like a virus, producing a vicious circle of sales fed back by a growing fear that may eventually turn into selling panic. These phenomena alone, regardless of whether asset increases or decreases are rationally, structurally, or economically justified, are capable of providing sufficient inertia to prices and building trends on different time scales.

This is so today and it was already four centuries ago in Amsterdam that narrated the Cordovan José de la Vega in his book “Confusion of confusions”. In its pages, describing the regulars of the Dutch stock market of that time, we observe exactly the same type of behavior that we see today in real-time through our mobiles. Nothing has changed in four centuries, and it is unlikely that our nature will change in the next 400 years. We observe exactly the same type of behavior that we see today in real-time through our mobiles.

In fact, trends are a ubiquitous phenomenon, which is systematically found in all historical price series that have been found, going back up to 800 years in the past. Regardless of the time and more importantly, culture-trends can be observed in both the formation of the prices of rice in medieval Japan and in our contemporary stock exchanges. The same pattern of the tulip bubble in the early 17th century Holland is repeated in the bubble of the South Seas of England in the following century or the real estate bubble in Spain in the early 2000s. As if it were a melody underlying the music of the markets, inertia in prices appears in each and every culture that has developed free markets.

Trends are a ubiquitous phenomenon, systematically found in all historical price series.

The Stubbornness of Human Nature

The question we, as traders, must ask ourselves is: Will inertia strategies continue to work in the future? We can answer this question with another: what is the factor common to all markets, assets, and historical epochs? The answer is ourselves; the human being. What is the factor common to all markets, assets, and historical epochs? The answer is ourselves; the human being.

Markets are the product of human action and are therefore inevitably conditioned by their nature. As long as humans continue to negotiate freely in the markets, we will do so thanks to an organ that we cannot detach or dispense with: our brain and its nature. An extraordinary and unique tool in the Universe, but full of biases, fallacies, and emotions that interfere with its rational functioning.

Convex strategies using inertia will continue to work in the future because the human being born today has the same brain as the human being who traveled the steppes 50,000 years ago. Biological evolution has not had time to adapt to rapid cultural and biological evolution. We continue to come into the world today equipped with a brain prepared for a world that has ceased to exist. Our biological heritage will carry potential energy future trends that will inevitably continue to form in the future.

Why do trends work? Without being aware of it, it is ultimately our biological heritage that loads potential energy future trends that will inevitably continue to form in the future, thanks to the particularities of that «kilo and a half of gray matter» that we all transport into the skull. In any case, it is really surprising how certain incentives and biases to the human being can emerge and be identified through phenomena as complex and chaotic as financial markets.

The most important reason why inertia will continue to permeate the markets-and it will therefore be profitable and prudent to continue to take advantage of it when it comes to investing is that it is impossible to want to change the human condition overnight and its biological heritage of millions of years, as the medieval Japanese quote says at the beginning of this article. To become the perfectly rational machines that economic orthodoxy dreams of and produce that perfect random path in price formation in markets, we should lose our human nature; stop being human. Something that doesn’t seem feasible can happen soon.

Notes:

[1] Why do trends work? Investment factors are anomalies or deviations in the price behaviour of financial assets that, in theory, should not exist if they follow a perfectly random path. Although more than 600 factors have already been identified, the five most significant are a) Value, b) low-volatility stocks, c) high-growth or growth stocks, d) small-size stocks relative to the rest of the market, and finally, e) “inertia” of prices to continue their previous trend beyond the theoretical random trajectory proposed by academic orthodoxy. 

[2] Why do trends work? The investment industry uses price inertia (the “momentum”, also known as “Trend following” or “CTA strategies”) to seek or increase investment returns. In the case of momentum, it usually refers to investments that are limited to capturing only bullish trends (long-only), being able to be applied as absolute momentum (when only the inertia of the asset being measured is taken into account) or relative momentum (when comparing the relative momentum of an asset with others to decide which/is overponderar). The trend-following/CTAs or trend tracking is similar, but is open to capturing both bullish and bearish trends, in multiple markets, and in different time windows.

Why do trends work? We must remember that the different modalities of what I generally call “Funds or inertia strategies”-although implemented in sometimes very different and sophisticated ways-respond to the same underlying phenomenon that is dealt with here. Little known to the novice investor, there are currently more than $400 billion ($400 billion Anglo-Saxon) managed on the basis of this same common phenomenon. As with all investment factors, we must always remember that not by focusing on a factor «theoretically usable», a better return is guaranteed.

[3] Why do trends work? Let us remember something obvious but with profound consequences in the formation of market prices: people do not like to lose money at any time or under any circumstances. This is so even if temporarily losing is part of a larger and more profitable plan over a longer period of time. Let us recall, for example, the case of Peter Lynch’s Magellan fund, which, although it achieved an annualised return of 27% in the 13 years it was in operation, none of its investors achieved such a return and a large majority lost money by investing in that fund! (by always subscribing and repaying at the worst times and not allowing the strategy to converge to its long-term profitability).

Why do trends work? Although we understand it rationally, any temporary loss or potential produces a great suffering; a real pain that our emotional brain never fully comprehends. Inertia strategies, even if they work, require taking on inevitable and numerous losses along the way-sometimes for several years. It is inevitable and consubstantial to any convex strategy. But when it comes to starting to lose money, most people prefer to abstain and choose a type of strategy that best suits the biased emotional response of their steppe brain, rather than accepting the unpredictable and volatile nature of markets.

Categories
Forex Trade Types

Overview of Trend, Reversal, and Counter-Trend Trading

On their path to learning how to trade in the forex market, some traders may need time distinguishing between trend trading and reversal trading. Aside from these two, traders have become aware of counter-trends, which is yet another concept shared and discussed in the forex community. Although even its name contains the word trend, traders across the world express their concerns not wanting to face the reversals scenario. As a counter-trend always moves against the prevailing trend, the majority believes that the odds of it winning that trade are low. Today we are finally helping you to understand what a counter-trend is and how it can impact a trader’s account.

Traders normally take a look at any currency pair and compare the price on the left end of the chart to the price at this very moment, which helps them conclude whether they are in an uptrend (the price is now higher) or a downtrend (the price is now lower). However, determining whether you are looking at a counter-trend may be a tougher job than it seems at first. If we take into consideration the time frame we are using and how zoomed in or zoomed out we are, we can question whether a precise definition of a counter-trend exists.

If you compare the two images below, you will see the two images of AUD/CAD daily charts taken at the same moment. Based on what we see below, depending on how you look at the chart, any trade you are in can be both a trend and a counter-trend trade. If you observe any YouTube trading videos, you may discover that despite the analysis indicating a downtrend, that particular trade can be perceived completely differently once zoomed out. Therefore, how we decide to look at our charts will inevitably affect the direction a currency pair takes.

Another important factor that traders may sometimes overlook is the involvement of big banks, whose impact on prices is what essentially pushes them up or down. While traders care about whether a pair is trending or not, big banks share no such affection. What they are interested in actually is where the majority of retail traders’ money is headed. By knowing where all the money is going, big banks can move the price in the opposite direction, which is why looking at where the prices were two years ago seems irrelevant.

Traders’ fears about trading properly, i.e. trading with the trend rather than against it, are therefore only a matter of perception. From the big banks’ perspective, and as a matter of fact, counter trading has no role in price movement. What is more, from the viewpoint of a trader, trend and counter-trend can turn out to be the very same thing, further reducing the value of this concept. Based on these facts, why should we then even concern ourselves with counter-trends and their impact?

Since trend traders’ only goal is to discover when a new trend or a continuation of an old trend is about to take place, their main task is to get involved on time and stay in the game for as long as possible. Other pieces of information, such as where a trend is, fall short in terms of importance as long as any such trend is happening. What traders should definitely work on is developing a system which can firstly recognize these trends and get them in a trade under the best possible circumstances.

Naturally, understanding the difference between trends and reversals will further help traders see what is of vital importance for growing a forex trading account. The question of how we can know whether we are not trading reversals any longer is key here as well. Unfortunately, the answer to this is that we will never know in advance. What we will be able to do is make reasonable conclusions with the wisdom of hindsight. If you are entering a trade, at which point will that happen? What every trader is hoping is that the entry happened as early as possible, but we cannot know exactly. Nonetheless, the algorithm you worked to develop, including the indicators you chose and tested, will carry out the task of neither getting us too early in a trade, which is considered as reversal territory.

Moving Average Convergence/Divergence indicator (MACD), which is essentially a two-line indicator, gives out a classic reversal signal when both lines under the zero line cross upward. As reversal trading cannot possibly lead to prosperity long-term, you are better off ignoring signals such as this one. Moreover, if you wait just a little longer, you will be able to see the two lines cross the zero line which is precisely an indication that you have left the reversal territory. Therefore, although we do not have a precise definition of what a counter trade stands for, this example alone should serve as clear guidance on what traders should focus from now on.

Should we then enter a trade the moment we see that things are turning? The answer is no simply because we need to see whether it truly is a reversal or not. Only when an indicator tests whether a reversal was a false one and the price keeps moving in the same direction, will you receive the actual signal to go long or short. Therefore, we cannot truly know when a trend officially started until we reflect on what happened before, which is why we need indicators to show us the way.

As a conclusion, the question of whether you should focus on trends or counter-trends is not really important, unlike the distinction between trends and reversals. What you need to avoid difficulties of trading reversals is a good set of indicators that will get you in a trade right when a trend is happening, be it a continuation of an old trend or an entirely new one. You should, therefore, only worry about entering a trade at the best possible time and having a system that can provide that. All in all, whether you are following a trend completely or moving slightly against it, do not fear to put full risk on that trend as long as your system tells you to go forward.

Categories
Forex Basic Strategies

Should You Trade Against the Trend?

Every now and then, you will see the markets consistently move in a single direction, this is known as a trend, much like sheep, most people will jump on the trend, trading in the same directions which can potentially add to its momentum.

There is the argument that a trend cannot continue forever, and this is true, so if you are the sort of person that likes to try and predict the tops and the bottom of trends, then going against the trend could be pretty beneficial. The issue with this is that it is not exactly an easy thing to predict.

More often than not, when all points on a chart are pointing in the same direction, the market sentiment will also support this movement, so it is easy to see why the majority of traders would not want to go against it. The one thing that we need to consider though, is the fact that the majority of traders have their trading bias and may not necessarily understand why the markets are moving up or down, just following the trend without understanding the reason for the move, can be just as dangerous as going against it. This sort of hive mentality is one of the common mistakes that a lot of new traders, in particular, seem to make.

It can be a pretty scary prospect, going up against the rest of the markets, and we can understand why there would be some hesitation, after all, most people would be going in that direction for a reason right? What would you know more than they do? What you need to remember is that a strong momentum does not mean that those currencies are actually strong, it could just as easily mean that there was a large influx of amateur traders joining the markets and blindly following the trend.

There is a forex trading strategy that is known as contrarian trading, this is all about going against the current market bias, as the shift in market sentiment is inevitable at one point or another. It would involve buying a currency when it is weak or selling it as it becomes stronger. This may sound counterproductive, but it certainly has its merits.

People who trade against the trend have a much better understanding of an overpriced or oversold asset, when something is hugely over or under, it can often result in a number of different pullbacks or even price reversals as there is only so long that an asset or currency pair is able to remain in that condition. When something is overbought, it means that its price is being inflated, there is no way that it will be able to sustain that price or continued rise in price for a long period of time.

This strategy obviously has its dangers, when a currency is really strong and pushing the prices up, there is a good chance that it can actually run straight through the potential reversal points, continuing higher and higher, this can blow out a trade that a reversal hunter may have put in. So it is not something you should just try at any time, you need to be able to see the stages of the trend slowing or the main money makers pulling out, this is far harder to do that to say and so this is actually an extremely risky strategy unless you understand what you are doing.

If you have done your research, understand your fundamentals and are willing to lose a few trades, then the idea of trading against the trend can actually be a very profitable one. It won’t be for everyone, it certainly won’t be for newer traders, but there certainly are some potential of profits in it.

Categories
Beginners Forex Education Forex Trade Types

Reversal Trading vs. Trend Trading: A Different View

While reversals are deemed to be extremely useful in some other forms of trading, some successful forex traders go as far as to say that they could prevent you from becoming a professional in this market. Whether you have vast experience dealing with fiat or you have yet to get to that level in your trading, you probably understand how crucial having a stable foundation for your trading career is. On one of the key topics for thinking and development in this respect includes the question of what forex is essentially about – reversals or trends. Even if you feel that you already know the answer, you may find some new perspectives and information in today’s discussion, which can help you become a better trader earning a greater profit more quickly. There are essentially two ways to do trade with one being easy and the other one difficult, and today you can learn why this topic is believed to be so vitally important for everyone wishing to reach the pro level.

A number of individuals trying their luck in this market believe that trading reveals is the right approach to discovering lucrative opportunities. Nevertheless, the answer to the question of whether you should be doing reversal trading or trend trading is considered to be the exact opposite of what the majority of forex traders generally do. Most traders, who are either at the beginning of their trading careers or moving from another market to forex, typically rely on the buy low, sell high method, placing their focus on tops and bottoms. This tactic may have even lead to some profitable investments, making you feel that you are on the right track.

Naturally, the odds of choosing the bottom in this thriving market are stacked against anyone attempting to grow their trading strategy based on this approach, which is why, despite some beginner’s luck, it can be severely detrimental to traders from the long-term standpoint. What this essentially means is that one lucky win can instill flawed thinking which can make you put all your eggs in one very unstable basket, waiting on that second win like a slot-machine player hopes for the next winning combination. This can inevitably make you lose focus of your trading account, which can ultimately lead to three most probable scenarios – you can either reach your break-even point, barely earn some profit, or most likely experience a complete downfall at the end of the year.

The reason why so many traders seem to fail at forex trading often lies in the fact that they misinterpret currencies as stocks, commodities, or equities that, unlike fiat currencies, actually have real values. When you think of stocks, you naturally think of assets, balance sheets, and products, which all play a part in determining a stock’s price. Due to a large amount of downright inaccurate and misleading information, terms such as overbought and oversold are frequently incorporated in trading in the forex market while, in reality, they have little to do with currencies. Currencies are simply not affected by the factors which may be relevant for other markets as they are directly influenced by the big banks, which can alter the price whenever and however they want.

The greatest actors, which are nowadays considered to be Citibank, Deutsche Bank, Chase Bank, and HSBC, have the ability to control and move the prices up and down, which only supports the statements provided above. Even with big news events, it is always the big banks that have a final say on the direction and time of every price change, further highlighting the insignificance of individual impact. Interestingly enough, if we look at the comparison between the stock and the spot markets, we can conclude that a large money influx will always determine where the stock prices will go, while the opposite is true for currencies. The big banks have a vast array of information at their disposal, which helps them assess where the money is concentrated and how it should be directed. More often than not, to act in their best interest, these major players decide to take the price the opposite way. What this implies is that the money they take is redistributed into the market, which is essentially how prices go up and down in this market.

While reversal trading is not what most professional traders would recommend doing, it is what allows big banks to manipulate the prices. In reality, whenever there is a currency pair that has been trending down long, it naturally implies that quite a few reversal traders never ceased trying to call reversals all the way down. Interestingly enough, the reversals will not occur until the moment every reversal trader decides to stop. To put theory into practice, we are going to use an example of the USD/JPY pair which really happened a few years ago.

As you can see from the image above, this currency pair experienced quite a long downtrend only to go right back up, which only happened because the money kept going in the opposite direction. The traders in this case would not stop picking the bottoms, which basically left room for banks to keep bringing the price down. To provide additional proof for this statement, we are going to use the sentiment indication available at dailyfx.com, which can help us see the balance of short and long positions of all the traders for the particular asset.

The blue line in the chart stands for all (reversal) traders, whereas the price exemplifies where the money went in reality. As the task the big banks have is to grasp where the money is headed and whether those positions are long or short on any currency pair, we can see at the very onset of this chart how the traders tried to go long when the banks recognized this tendency and decided to go short. However this did not stop traders from attempting to do reversals and they kept going long, and the discrepancy between these traders’ activity and the money’s actual direction is clearly demonstrated by the divergence of the two lines in the chart above. Going further along the chart, we can see how these price whipsaws all the way, which only proves how banks carefully follow each step traders take and do exactly the opposite.

Reversal traders are always on the loss because their money is constantly exploited due to their lack of knowledge or understanding of how trends function. There will always be a vast number of individuals trying to pick tops and bottoms who will actually help the banks secure themselves better. Of course, they will be allowed to have their single occasional wins so as to keep investing more, but these traders will always be losing more and more money because this approach is simply not sustainable and it does not benefit anyone but the big banks. You may try to rely on some indicators, such as Stochastics, RSI, Bollinger Bands, or CCI, hoping that this will help you win the game.

Unfortunately, you will find that even the best reversal tools available at the moment will only do you a disservice as the house always wins. Therefore, in order to make consistent money, you should invest in understanding trends and learning how to interpret market activity. By relying on trends, not reversals, you can actually secure a much more stable profit and save yourself from being another pawn in the big banks’ game, which should altogether be the best motivation for anyone wishing to trade in the forex market.

Categories
Forex Assets Forex Trade Types

Trend Trading With Exotic and Volatile Pairs

Is there really anything to fear when trading exotic currencies and volatile pairs?

People tend to approach exotic currencies and volatile currency pairs with a kind of irrational, knee-jerk reaction. They’re either revolted and back away or they’re mysteriously drawn in like a moth circling a porch light. Is this irrationality merited? Does it get you anywhere? Let’s take a look. To unpack this properly, it’s best to approach these two ‘monsters’ separately – starting with exotic currencies.

Exotic Currency Pairs

So, is it worth trading exotic currency pairs? To the untrained observer, it might look like the short answer is simply ‘no, it isn’t worth it’. But this answer has to come with a disclaimer because, in reality, it depends on two other things. First thing’s first, what do we mean when we say “exotic currency? The problem is that one man’s exotic currency is another man’s daily bread. Ask any two traders what their definition of an exotic currency is and you’ll likely get two different answers because there is no actual definition that everybody sticks to. Some people will quite happily identify a less commonly traded combination of the eight major currencies as being exotic.

Take, for example, the euro-AUD combination. It’s easy to understand why they would think of that as exotic since the EUR-AUD pair is traded very rarely indeed compared to just about any pairing with the dollar that you can think of. Even if you pair the dollar with come currencies outside the major eight, like the Swedish krona or the Mexican peso, you will have a combination that is more frequently traded than euro vs. the Aussie dollar.

A better working definition – and one which we’re going to go with here – might be to say that any combination outside the eight major currencies should be considered exotic. And here’s why. The eight major currencies are all part of a network of developed, first-world economies. This isn’t a judgment call, by the way. We’re not saying here that any one country is better than another – what we’re looking for here is stability in terms of the news cycle and unpredictable fluctuations. The fact of the matter is that if you trade outside the major eight currencies, you run a greater risk of an anomalous news event sending the price spinning off in an unpredictable direction and blowing out your stop/loss.

That is simply bad news if you are a good technical trader. To be clear, it’s actually bad for any forex trader. When you step outside of the major eight currencies, it becomes increasingly difficult to keep on top of the news cycle. Of course, unusual news events are going to pop up from time to time no matter what currency combinations you trade but as you move outside the major eight, they will be both more frequent and more violent.

That is not to say that there isn’t something tempting about trading exotic currencies. Many readers will know that when you take a look at exotic pairs, it can look very exciting. This applies even to the currencies that you will most commonly encounter outside the eight major currencies. These include the Chinese yuan, of course, the Mexican peso, the Swedish krona, the Turkish lira, the Russian rouble, and the Indian rupee. Sometimes a pair with one of these can move thousands of pips at a time. It’s easy to look at a movement like that and say to yourself, “If I could just enter one big trade here for a few thousand pips, I could walk away rich!”

Unfortunately, that’s not how it works. It’s easy to get drawn into easy-looking trades like that but the problem – and it’s a big problem – is that some of these currencies can move very dramatically and with no warning and for no clear reason. A big win can be truly tempting but a big loss has the potential to completely wipe you out. The Chinese yuan is interesting here for a couple of reasons. There is no denying that it is traded against the dollar much more than it used to be. However, while we’re still in the US-China trade war, it is best to steer clear of trading the Chinese yuan. The ongoing trade war introduces too much risk into the equation.

How Does One Approach Trading Exotic Currencies?

Firstly, you should venture beyond the eight major currencies and all of the combinations of them only if you have a sufficient amount of experience. In short, there is not a whole lot of benefit to expanding beyond the 28 currency pairs that the eight major currencies offer unless you have completely mastered these first. If you have only been trading for a couple of years or less even, then you are not ready but, if you have a lot of experience under your belt, then venture a little further by all means. But proceed with caution.

Caution being the watchword here, because another thing you will have to do before you do try your hand at trading exotic currency pairs, is a little risk mitigation. One of the ways you can do this is to select a currency outside the major eight that you feel good about exploring and start testing it on demo mode. Your first step is to backtest it by applying your trading methodologies to it historically. Your next step is to forward test it by demoing it for a few months until you have built up both a good sense of how it behaves – especially in terms of its spread vs. ATR. Forward testing is a good way to iron out the kinks in your risk profile and to minimise any surprises that could crop up.

Where to Begin?

If you are determined to expand beyond trading the eight major currencies and feel ready to do so, your first task will be to identify a good currency to get started with. A good place to start might be the Singapore dollar. There are a few reasons that make SGD a good choice. For starters, in many ways, it behaves in a way that’s similar to the Japanese yen, at least for now. It is less volatile than the Japanese yen but we’ll touch upon volatility later in the article and you’ll see that it isn’t a big problem. As with the yen, the main advantage of SGD is that it is impervious to news events that relate specifically to it.

This means that it essentially acts as a kind of blank canvas for the currency you are pairing it with. In a sense, this releases you from having to worry about two currencies simultaneously and allows you to focus your attention on just one. This is as true for the Japanese yen as it is for SGD. Of course, this is how things are at the moment and how they have been historically. If Singapore were to be plunged into any kind of turmoil, this would change but, for now, it is surprisingly stable. News events just do not affect it at all.

A Note of Caution

The only real alarm bell regarding the Singapore dollar is that it has a high percentage of spread as compared with its ATR. It is, in fact, likely to have a more lopsided spread vs. ATR percentage than most other currencies you will be trading or even looking at right now. However, as we will cover later in this article, that does not necessarily have to be a problem. Particularly if you do your due diligence and backtest and forward test the currency as discussed. So, don’t let the spread vs. ATR percentages scare you off immediately and take a look at the Singapore dollar if you are keen on exploring exotic currencies.

Managing Volatility

Another one of those things that in many cases gives traders the heebie-jeebies, is trading volatile pairs. Fear is almost certainly a big factor. It’s almost as though it’s the word itself – volatility – that causes a lot of that fear. The good news is that that fear is irrational and can be managed and molded into something useful.

Speed-Phobia

Aside from the word volatility sounding scary, there are two main reasons that traders have an aversion to trading volatile pairs. We will tackle both of them here in turn. The first is that volatile pairs of currencies move fast. They move faster than currency combinations you are comfortable with and that, it seems, makes a lot of people back away. The thing is, there is no real reason it should. Understanding the percentages here and using them to your advantage is key. It sounds easy enough, doesn’t it? The thing is, if you understand the percentages then you will understand that trading a currency combination that moves slowly is exactly the same as trading one that moves quickly.

The key is risk profiling. If you are trading a fast pair, you will have to manage the risk by trading less per pip than you would on a slow pair. If you can manage the risk in that way, you should arrive at a situation where you stand to lose the same on a fast pair as you would on a slow pair, if things go south on you and you hit your stop/loss. Of course, you should never trade the same amount per pip on a slow pair of currencies and a fast pair – if you do, your trading problems are bigger than just accounting for volatility. So, to close down the risk of trading a faster pair of currencies, you have to have a good, well-thought-out risk profile in place. If you can do that, then trading fast-moving currencies should be almost the same as trading slower combinations.

Fear of Spreads

The second thing about volatile currencies that gives most traders pause is something we saw earlier with the Singapore dollar. Volatile currencies will have a high spread vs. ATR ratio. The way to combat that is to pull away from your five-minute chart and trade on a longer time-scale like your daily chart. Trading on a daily chart will negate almost all of the effects of spread vs. ATR from volatile currency pairs. If you trade the daily chart, particularly for volatile combinations, you just won’t have to worry about spreads anymore. You will never again look at a currency pair and decide not to trade it because it looks too volatile based on its spread vs. ATR. If you’re looking at it from a five-minute chart perspective, then the high spread vs. low ATR is certainly something you will want to avoid. But don’t forget that it is a hurdle that can be overcome with a different approach. That approach is to go to trade your daily chart.

So by applying the right kind of risk profiling and modifying your trading to take in the daily chart, you can turn the fear of volatile currency pairs into gold. And it won’t be because you overcame your fears like some zen master, through meditation and self-improvement, it will be because you’ve applied smart trading techniques and knowledge to overcome something that was otherwise irrational with a well-considered, methodological approach to a problem.

Time to Recap

Approach exotic currencies with a dose of caution. Make sure you have the experience to know what you are doing and do not trade outside the eight major currencies until you know the risks that go with exotic currency pairs and the knowhow to overcome them. Carefully choose your starting currency and make sure you do your due diligence by properly back and forward testing it thoroughly. Ultimately, if you’ve only been trading for a couple of years, there is no good reason to trade outside the major eight currencies.

Finally, there is no reason to fear volatility. If you approach what initially looks scary with a rational, considered approach, including careful risk profiling and an awareness of when to trade the daily chart, you never need fear volatility ever again.