A man named Hidenobu Sasaki brought Hosada’s Ichimoku system and the three principles to contemporary times. He worked for Citigroup in Japan when he published his 1996 book, Ichimoku Studies.
These three principles have shared characteristics of many various styles and theories in Western technical analysis. A couple of examples of those would be Elliot Wave Theory and Tom DeMark’s Sequential. I would encourage all readers to pick up Nicole Elliots 2nd edition of Ichimoku Charts – An introduction to Ichimoku Kinko Clouds. It is my opinion that her work is the most in-depth on these three principles – even though she reports she does not use them. I also do not use any of these three principles. Nonetheless, they are a component of the entire Ichimoku system.
Principle One – The Wave Principle
The Wave Principle is an enigma. It is both singular in its nature when compared to Western analysis but also very complimentary. Ichimoku is a very dynamic form of analysis with broad interpretation and flexibility available for the analyst/trader. Elliot Wave Theory is a very static form of analysis with strict rules that must be adhered too.
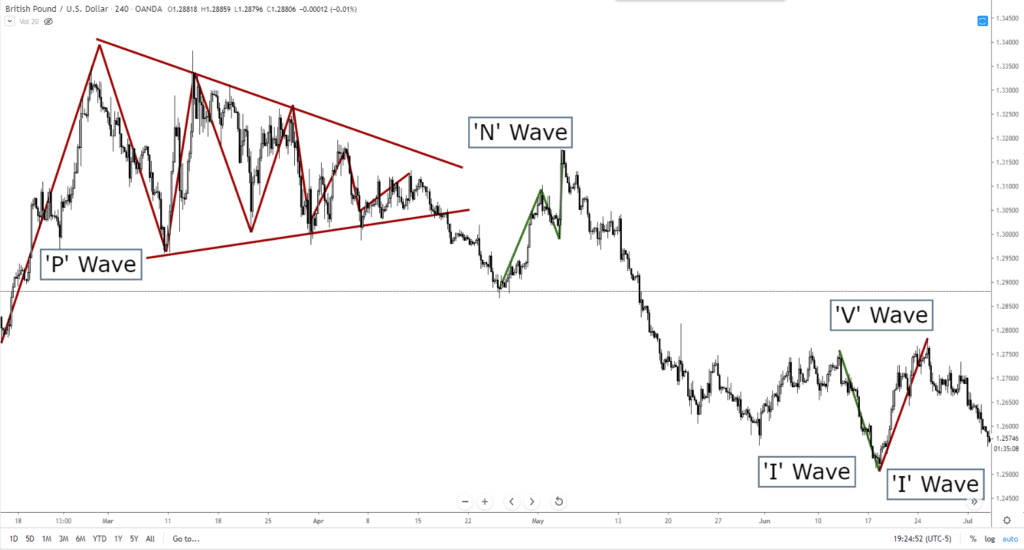
Much of these patterns are going to be very much the same patterns that new traders and analysts first discover when learning Western-style technical analysis. One of the more interesting elements of the Wave Principle is the naming of each pattern. I am not sure if it was Sasaki or Hosada who used English letters to identify the shapes of these patterns. Many of these patterns are self-explanatory and familiar.
One Wave – ‘I’ Wave
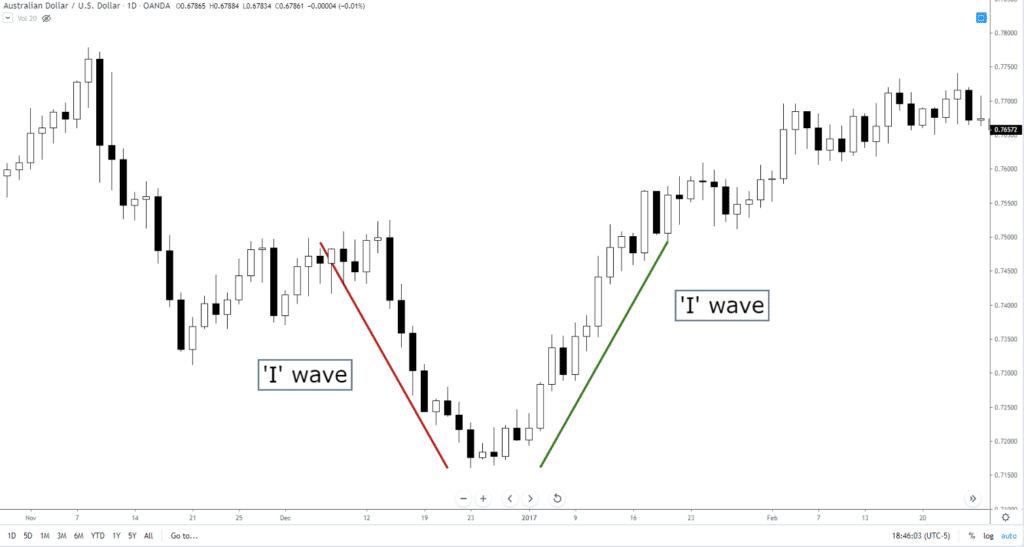
Called the ‘I’ Wave, it is a simple (probably overly simple) single wave. I would call it a trendline more than a wave, but that is what Hosada calls it.
Two Wave – ‘V’ Wave
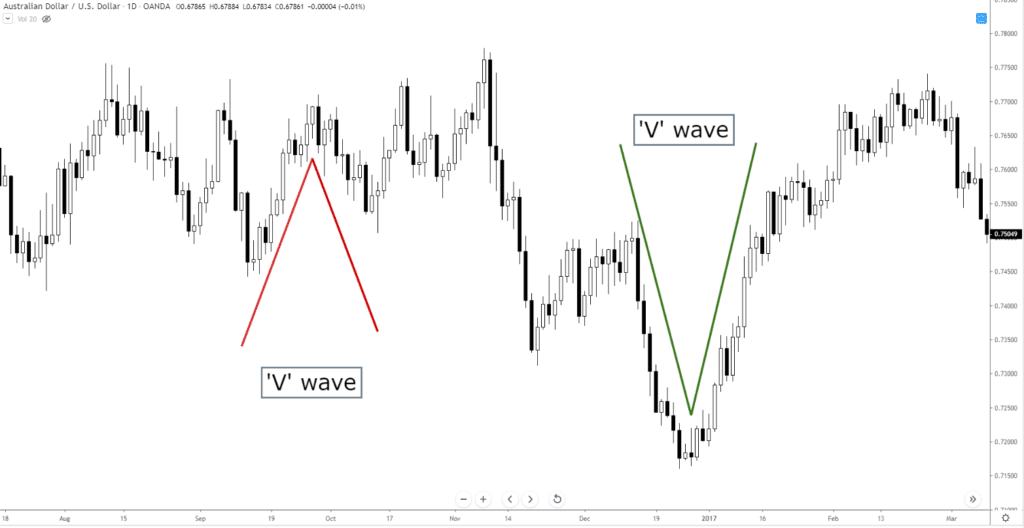
The ‘V’ wave is one of the most common patterns in technical analysis, it’s one of the first patterns we learn, but it’s not a specific pattern that we learn by itself. The ‘V’ wave is part of the M or W structure that makes up the majority pattern theory in technical analysis.
Three Wave – ‘N’ Wave
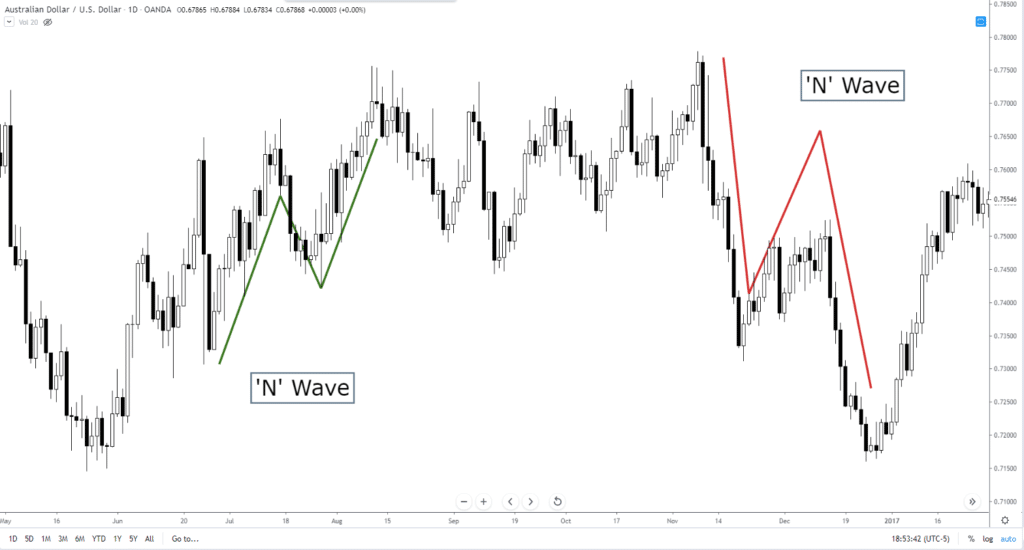
Again, this is a common pattern that most of you are already familiar with. The ‘N’ wave pattern in Nicole Elliot’s book shows symmetrical waves – which is important because the ‘N’ wave is essentially an AB=CD pattern, one of the building blocks of Harmonic Patterns. It is also a perfect description of what an A-B-C corrective wave in Elliot Wave Theory looks like.
Five Wave – ‘P’ Wave and ‘Y’ Wave
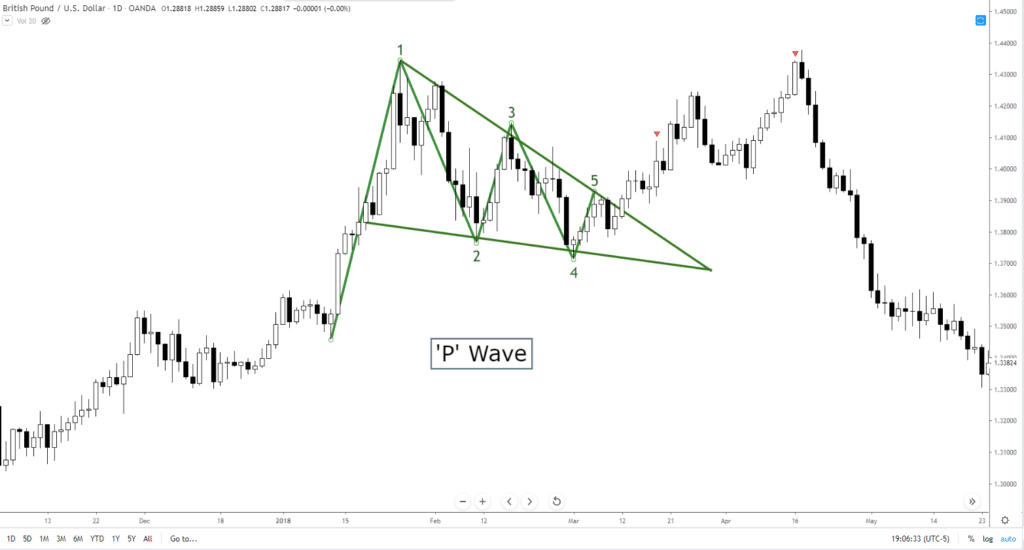
The ‘P’ wave is essentially another name for a popular and powerful continuation pattern known as a pennant. ‘P’ waves can also represent ascending or descending triangles. You will also see them in Ending Diagonals in Elliot Wave Theory. The pattern should also be called a ‘b’ pattern because the inverse of the ‘P’ pattern, a bullish pennant, is a ‘b’ shaped pattern – a bearish pennant.
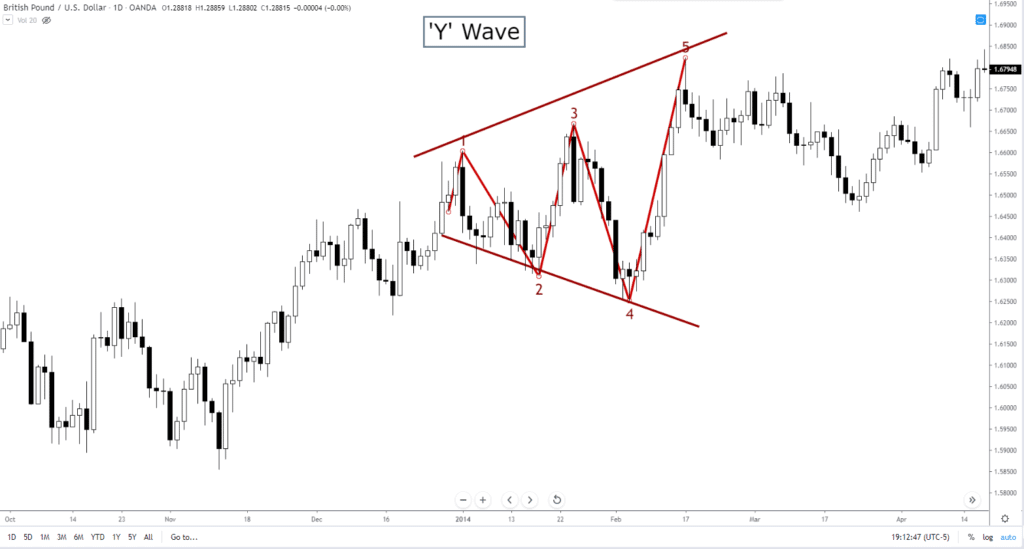
The ‘Y’ wave is probably more commonly referred to as a megaphone pattern, broadening top or broadening bottom.
Combined Patterns

Although it may not need to be said, charts will show multiple patterns at any given time. And due to the fractalized nature of technical analysis, patterns within patterns are normal.
Wave Counts
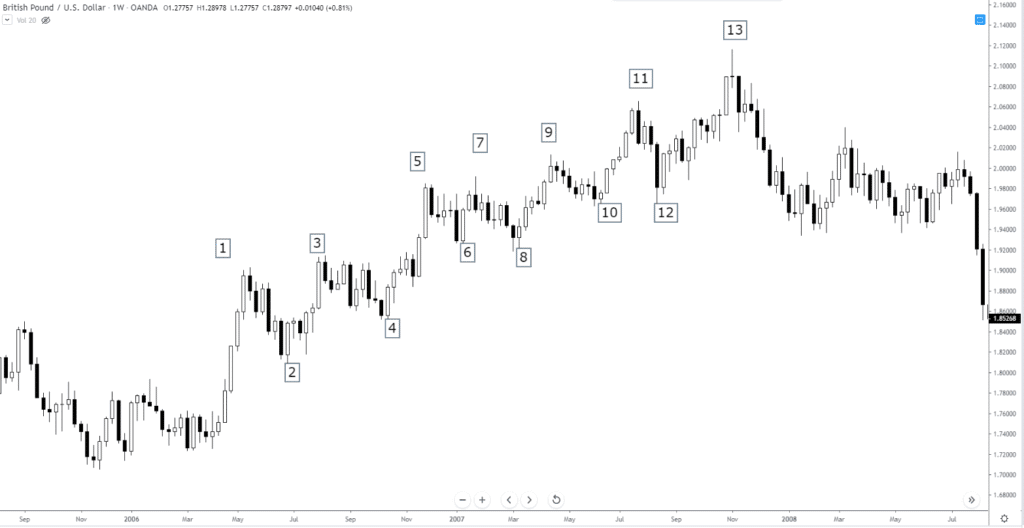
So this part is the one where it will either make little sense or no sense. If you are new to technical analysis and/or never learned Elliot Wave Theory, the wave count component of the wave principle will make little sense. If you know the Elliot Wave Theory, then the wave count component will make no sense. Waves in Ichimoku are measured by time – a very Gann based approach. Trends are either Long-term or Short-term with no delineation between whether it is a bull market or bear market. There is no limit to the number of waves that can exist in a Long-term trend, but Short-term trends must be in single, double, or triple waves. The Ichimoku wave count is similar and very different from how we measure wave counts in the Elliot Wave Theory. In Elliot Wave Theory, moves occur in either three (corrective) or five (impulse) waves.
Sources: Péloille, Karen. (2017). Trading with Ichimoku: a practical guide to low-risk Ichimoku strategies. Petersfield, Hampshire: Harriman House Ltd.
Patel, M. (2010). Trading with Ichimoku clouds: the essential guide to Ichimoku Kinko Hyo technical analysis. Hoboken, NJ: John Wiley & Sons.
Linton, D. (2010). Cloud charts: trading success with the Ichimoku Technique. London: Updata.
Elliot, N. (2012). Ichimoku charts: an introduction to Ichimoku Kinko Clouds. Petersfield, Hampshire: Harriman House Ltd.