Introduction
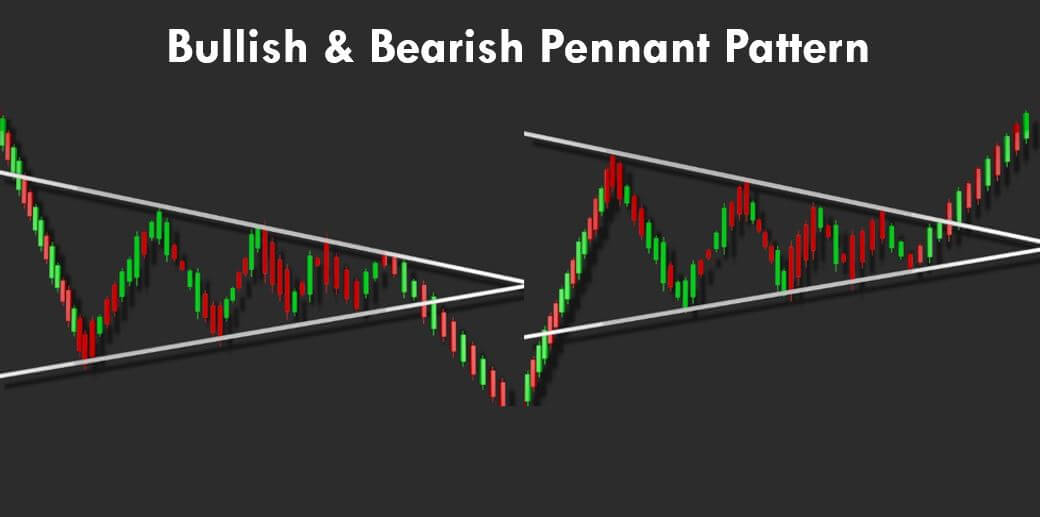
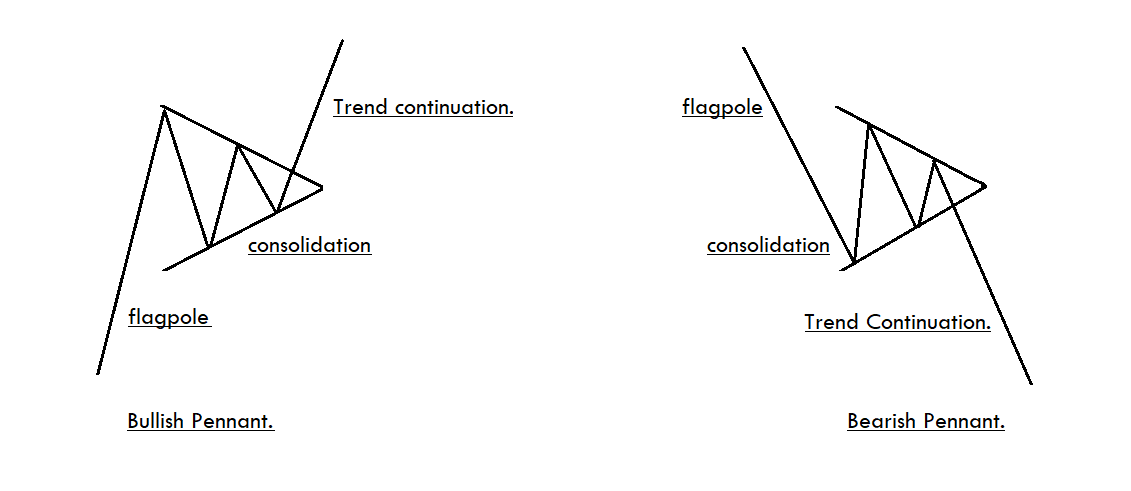
The Pennant is both a bullish and bearish continuation pattern that is used by technical analysts across the globe. This pattern can easily be identified on the price chart and is typically used for trading the upcoming price movements. In an ongoing trend, when the instrument experiences a significant upward or downward movement, followed by a brief consolidation, the Pennant pattern is formed.
Pennant Pattern’s Key Characteristics
A Flagpole – The Pennant pattern always begins with a flagpole, and that is the initial strong move.
Breakout Level – Two breakouts should occur in this pattern. The first one will be at the end of the flagpole, and the second one should be after the consolidation period.
The Pennant Itself – A triangular pattern is formed when the market consolidates between the flagpole and the breakout, and we call that a Pennant.
How To Trade The Pennant Pattern?
The Pennant is a relatively simple and easy-to-spot pattern on the price charts. We will find this pattern on all the timeframes, and the strategies that we are going to discuss will work on any timeframe you trade. In the below examples, we have used 15 minutes, Daily, and Weekly charts to prove the same. All you need to do is to train your eyes well to spot the pattern. Once we master this pattern, we can easily increase the probability of our winning trades.
Trading The Bullish Pennant Pattern
Example 1
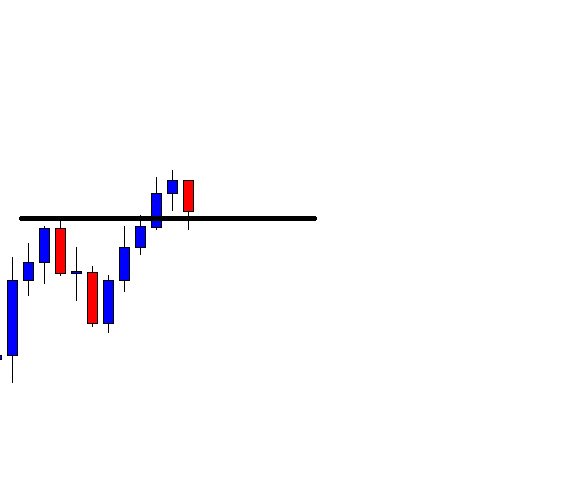
In the below EUR/GBP chart, we have identified the formation of a Bullish Pennant Pattern.
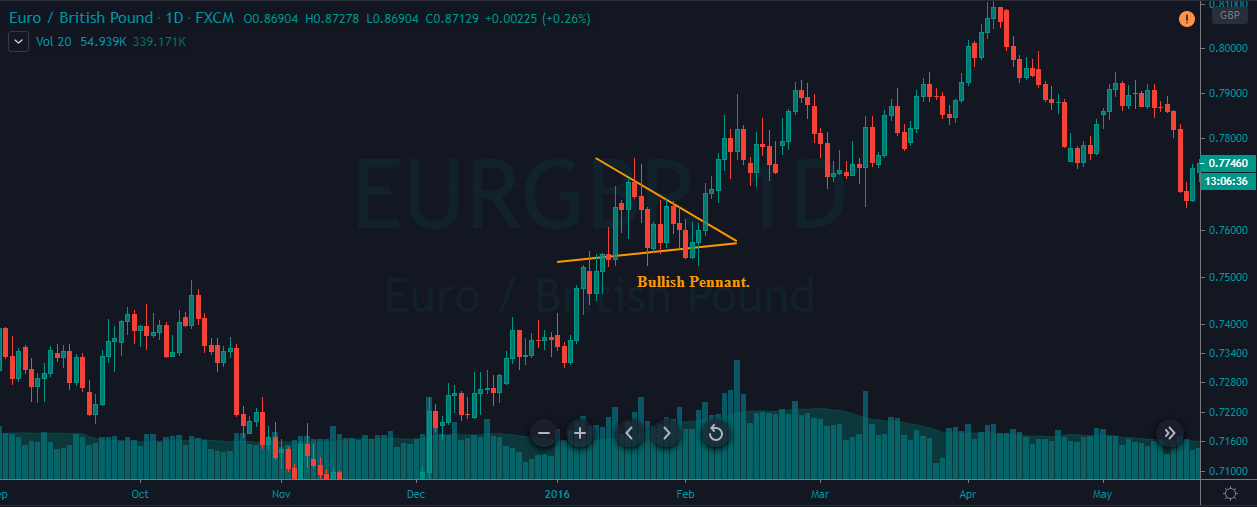
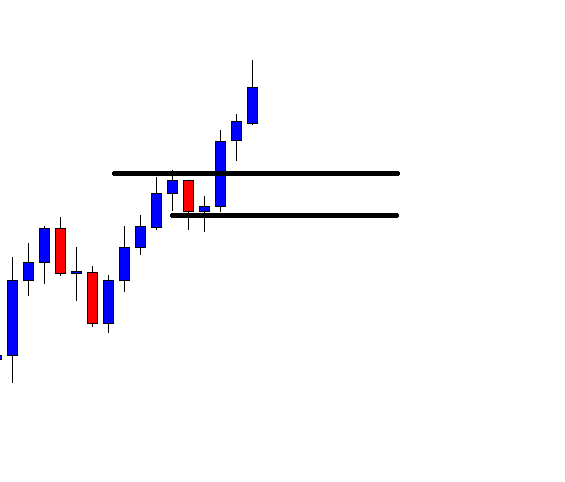
We must always look to take long or short positions depending on the breakout in the Pennant chart pattern. If we find a bullish Pennant pattern, we must wait for the price action to break out in the north direction to take a buy trade.
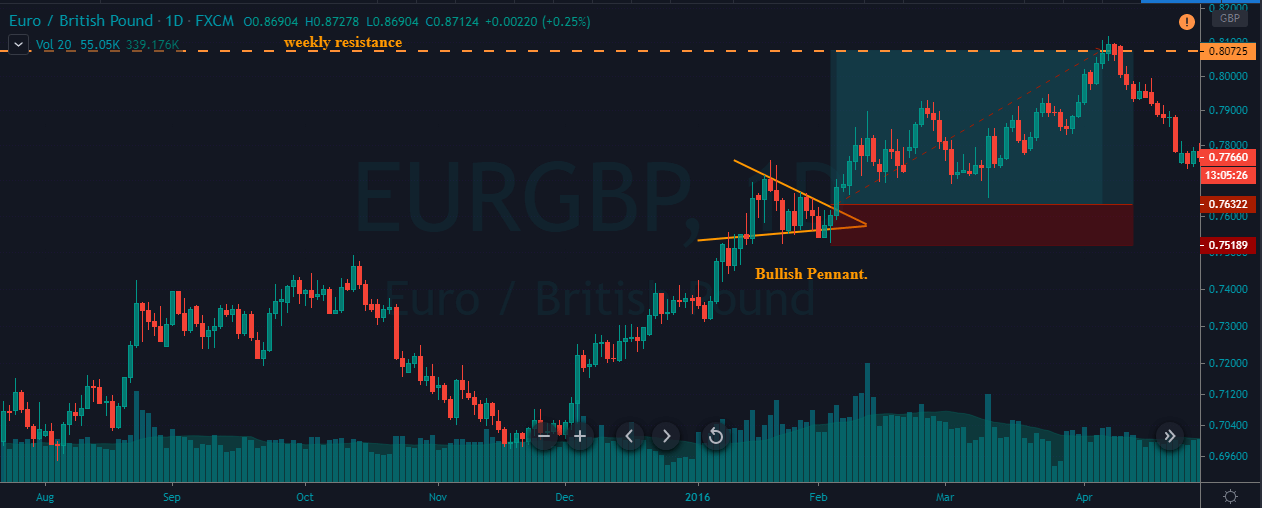
In the below chart, you can see that when have placed a buy order after the price action broke the Pennant’s upper trend line. The take-profit should be placed at the higher timeframe’s resistance area, whereas the stop-loss order should be below the lower trend line. The best part about trading this pattern is that it offers a good risk to reward ratio, and most of the trades hit the targets within a few hours.
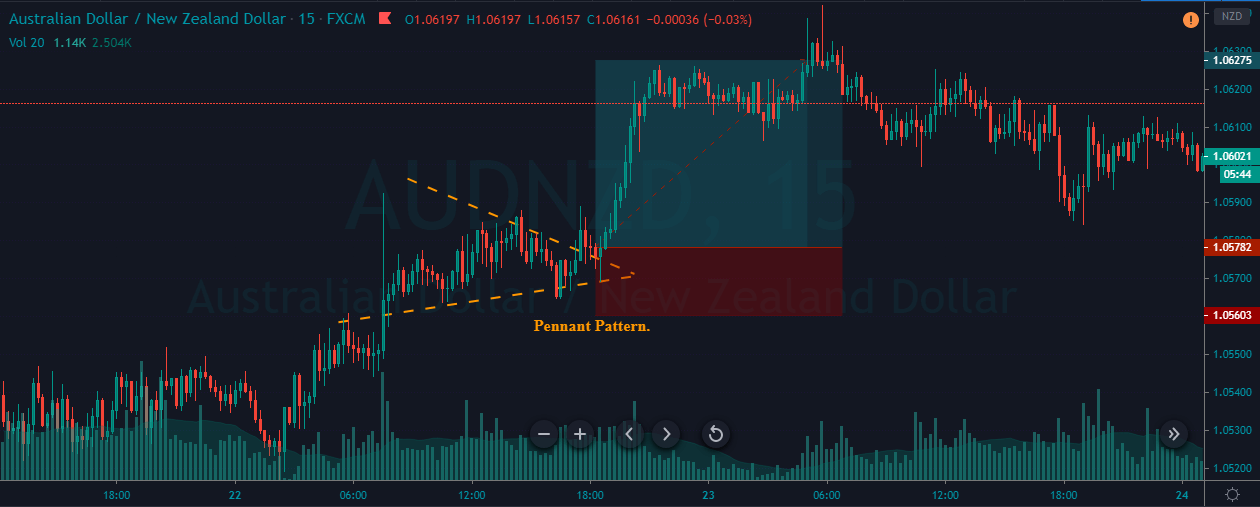
Example 2
In the below AUD/NZD chart, we have found another Bullish Pennant pattern.
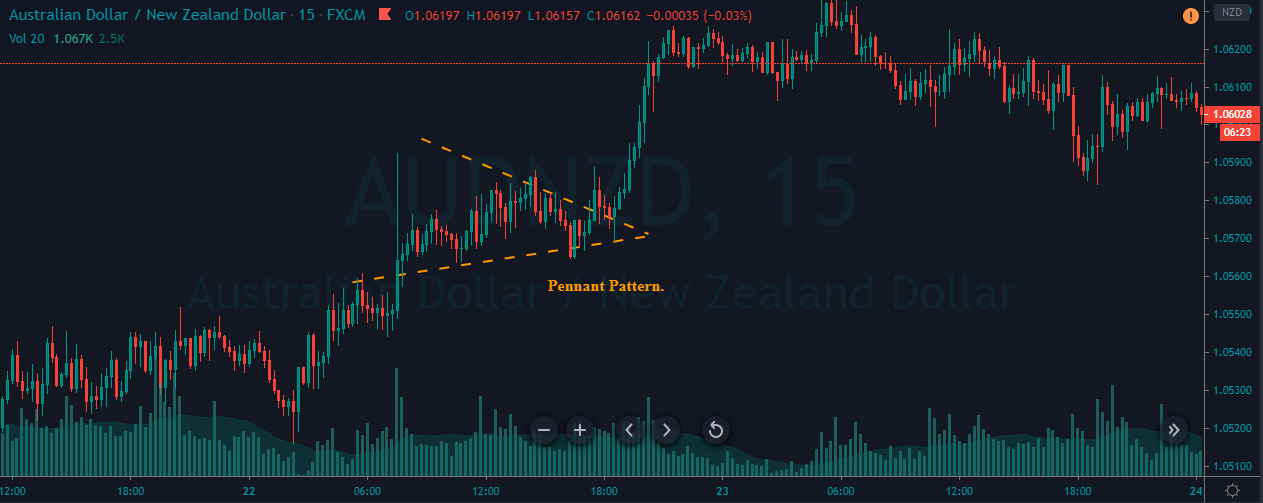
Here, we can see the market has started a new downtrend, and we have placed a buy order right after the price broke the upper trend line. We can see our trade hitting the TP within a few hours. If we find this pattern in active trading hours, or when any trading session is about to begin, it is advisable to take bigger trades because opening trading hour breakouts have higher chances of succeeding.
Trading The Bearish Pennant Pattern
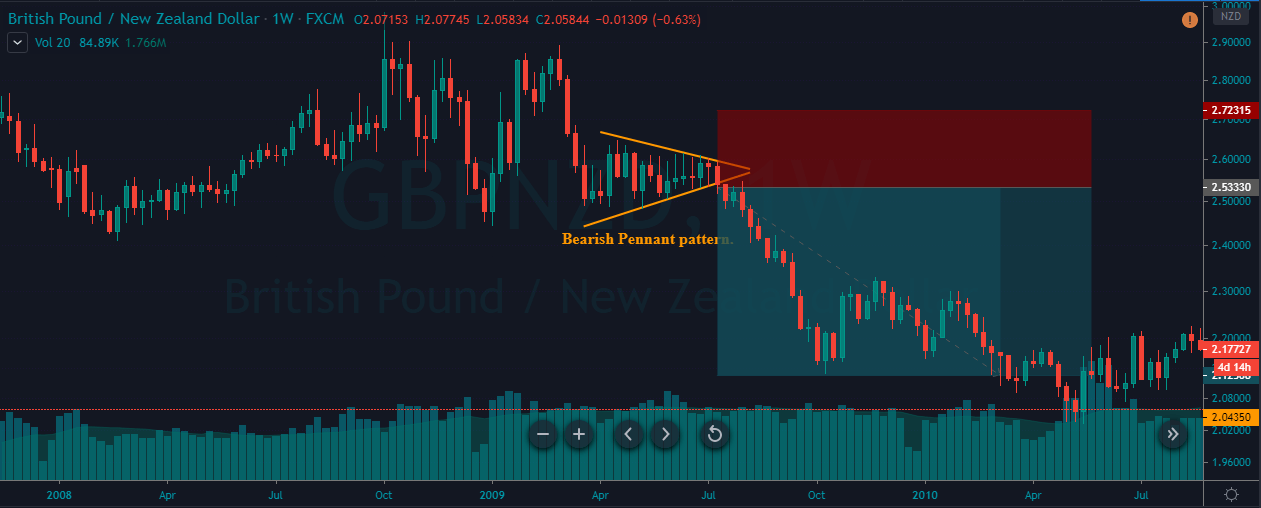
In the image below, you can see that we have identified a Bearish Pennant pattern on the GBP/NZD pair.
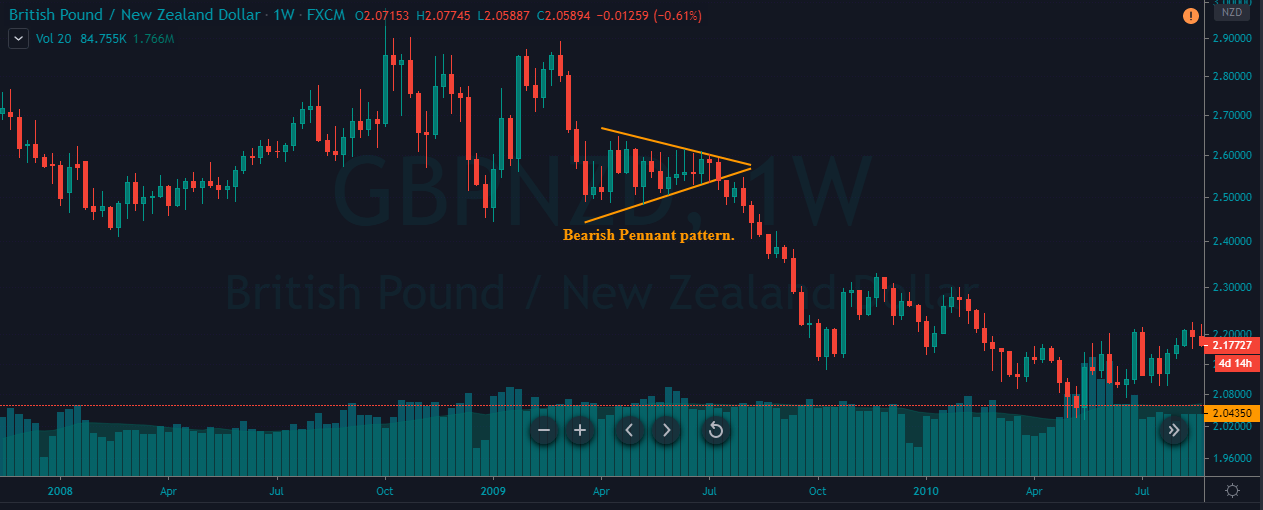
In the below chart, we can see that a brand new downtrend has just begun. The first leg of the pattern (flagpole) was quite strong. When the price action broke below the lower trend line, it is an indication for us to go short in this pair. The take-profit is as placed as same as the size of the flagpole, and stop-loss was just above the pattern formation.
That’s about Bullish and Bearish Pennant pattern and how to trade them along with appropriate risk management. Following money management principles is as crucial as entering the market at the right time. If you have any questions, let us know in the comments below. Cheers!
[wp_quiz id=”72786″]