Categories
Ichimoku

The Three Principles – Timespan Principle

The Three Principles – Timespan Principle

In another correlation to Western analysis, Hosada’s Ichimoku Kinko Hyo system has a timing component within the system. The numbering system used in Ichimoku is unique when compared to Western analysis. The reason for the numbering and counts in Ichimoku is related to the cultural importance of some numbers in Japan versus others. Numbers that would be considered ‘lucky’ in Japan are the same numbers in the West and many other cultures – particularly 7 and 9. But those numbers themselves are not what is important. How, exactly, this numbering and count system came to be developed in the fashion that it was developed I do not know. The following is directly from Ichimoku Chats – An Introduction to Ichimoku Kinko Clouds by Nicole Elliot – I heavily suggest getting her book (the 2nd edition). The important numbers are:

9, 17, 26, 33, 42, 65, 76, 129, 172, 257

If you ever study the work of WD Gann, then these numbers are not only familiar but non-random.

Numbering

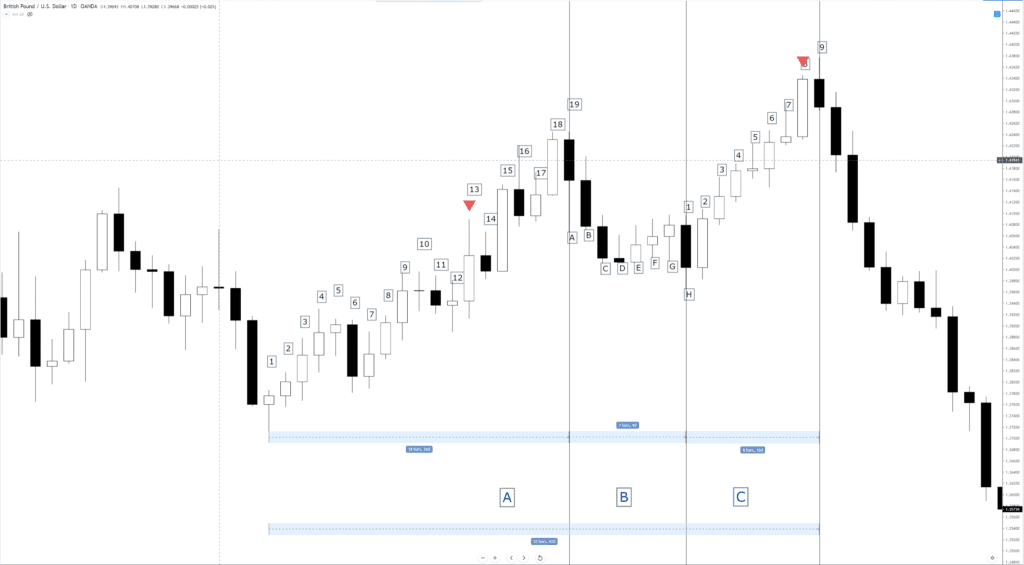
Numbering the candlesticks in a pattern is done with traditional Arabic numbers (1,2,3,4,5, etc.) and English letters (A, B, C, D, E, etc.). When counting how many candles are in a trend/wave, the last candle in an uptrend is counted as the first in the down wave and vice versa. See below:

Timespan Principle - Candle Counts
Timespan Principle – Candle Counts

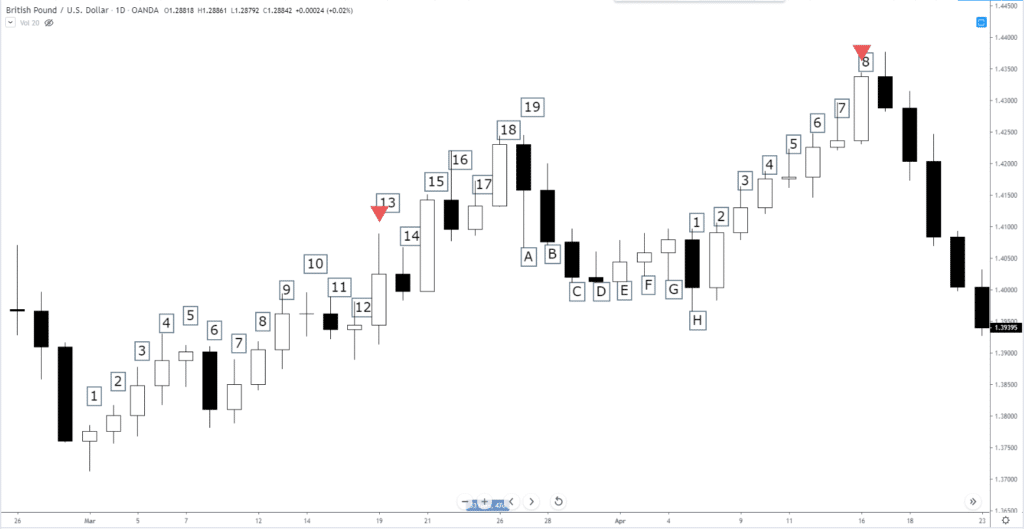
Notice that candle 19 is also A, candle H is also 1. Also, notice that the time counts (total number of candles) in this ‘N’ wave all represent essential numbers in the Ichimoku number system. 19 is close to 17, H is close to 9, and 8 is close to 9.

Kihon Suchi – ‘Day of the turn.’

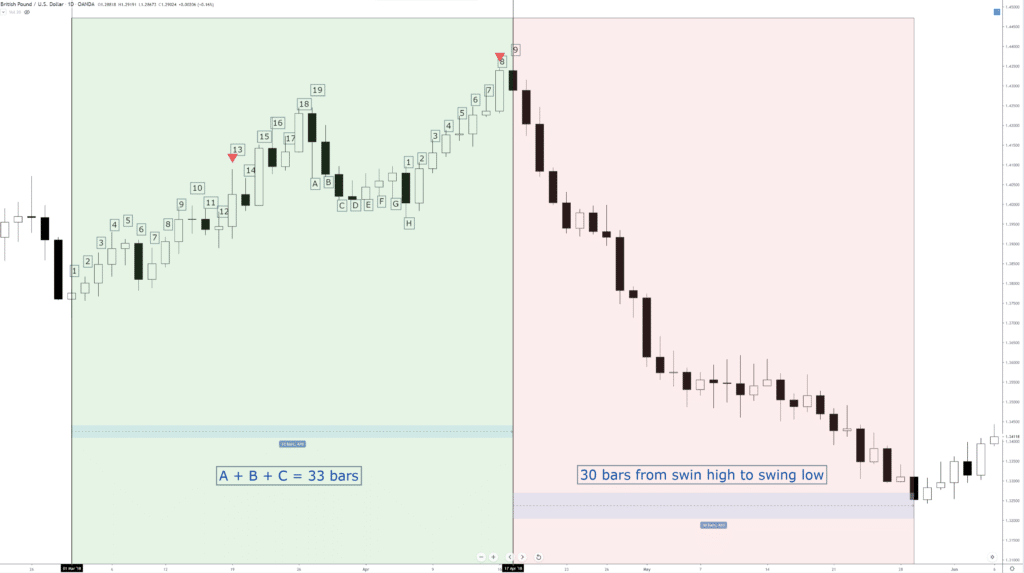
Nicole Elliot’s work is fantastic – it’s refreshing to read an analyst and trader who updates her work and goes through the grueling process of keeping it relevant. Kijun Suchi (‘the day of the turn’). The Kihon Suchi is the Hosada’s Timespan Principle put into practice. It is very similar to the use of Gann’s cycles of the Inner Year or horizontal Point & Figure counts to identify turns in the markets. Let’s use the image above again as an example. Below, I’ve separated the ‘N’ wave into A, B, and C.

Timepsan Principle - Combined Counts
Timespan Principle – Combined Counts

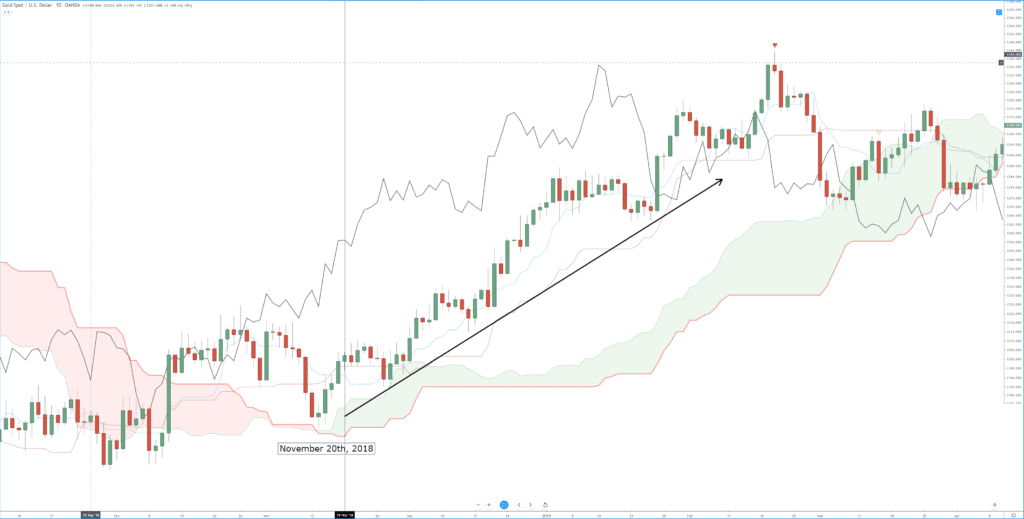
When adding the number of bars in A, B, and C, we always subtract 1 from each wave after the first. For example, if we counted five waves and the total was 100 bars, we would subtract 4 from 100; 96. On the chart above, the total number of bars of A, B, and C is 33 bars. We subtract 2 from 33 to get 31. This is where the Timespan Principle using Kihon Suchi comes into play. We should be able to project the end of the down drive that will occur after wave C. Does it work? Let’s see.

Timespan Principle - A+B+C = D
Timespan Principle – A+B+C = D

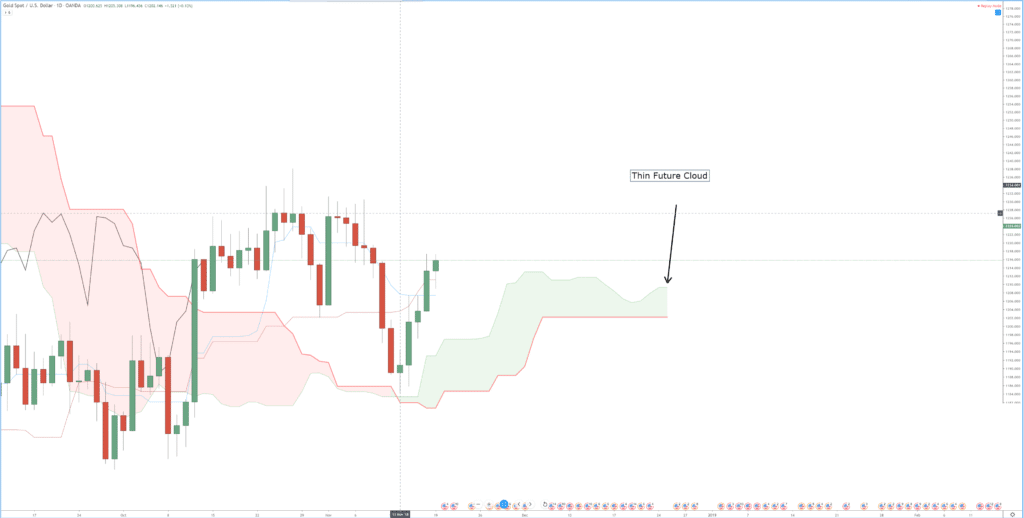
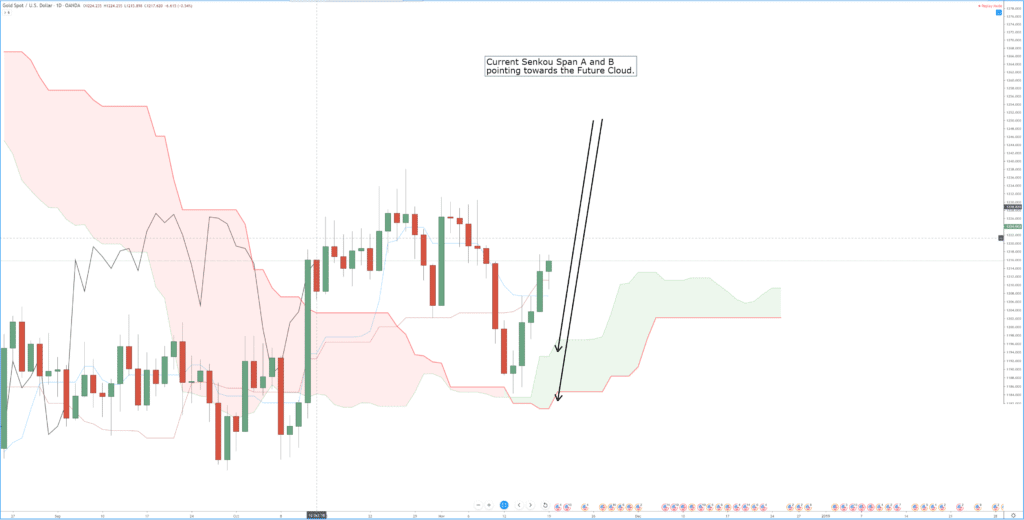
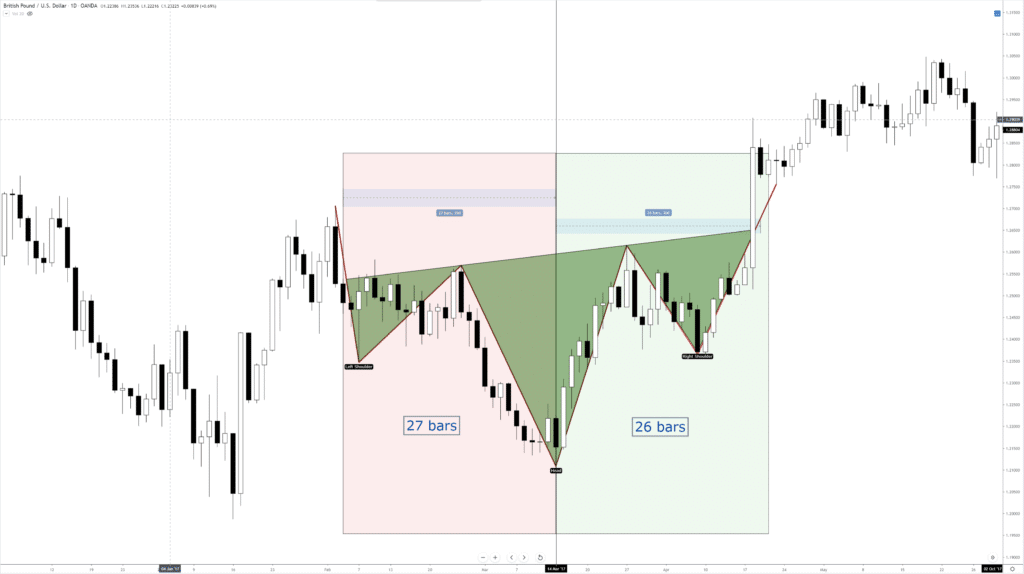
Below is another example. In reality, the use of the Timespan Principle is a very simplified version of a phenomenon known as a foldback pattern. But Japanese analysis focuses on the quality of equilibrium, so it makes sense to see this kind of behavior from a method that focuses on balance in all things.

Timespan Principle - Symmetrical Inverse Head & Shoulder Pattern
Timespan Principle – Symmetrical Inverse Head & Shoulder Pattern


Sources: Péloille, Karen. (2017). Trading with Ichimoku: a practical guide to low-risk Ichimoku strategies. Petersfield, Hampshire: Harriman House Ltd.

Patel, M. (2010). Trading with Ichimoku clouds: the essential guide to Ichimoku Kinko Hyo technical analysis. Hoboken, NJ: John Wiley & Sons.

Linton, D. (2010). Cloud charts: trading success with the Ichimoku Technique. London: Updata.

Elliot, N. (2012). Ichimoku charts: an introduction to Ichimoku Kinko Clouds. Petersfield, Hampshire: Harriman House Ltd.


Categories
Ichimoku

Ichimoku – The Two Clouds Discovery

The Two Clouds Discovery

In Manesh Patel’s book, Trading with Ichimoku Cloud – The Essential Guide to Ichimoku Kinko Hyo Technical Analysis, he made a fantastic discovery. When I first read his work, I almost missed it. Whether he knows it or not, Mr. Patel made a discovery and an observation that his peers have not written about in their work. I call this the ‘Two Clouds Discovery.’ It’s one of those moments where you know you’ve probably been aware of this phenomena, but no one put words to it. It’s one of those things where you go, ‘huh, why didn’t I think of that?’ or ‘I can’t believe no one else noticed this.’

Two Clouds

The Two Clouds discovery puts a label on the component we already know: the Kumo (Cloud). The names we are giving to these two components are the Current Cloud and the Future Cloud. The Current Cloud is where price action is currently trading. The Future Cloud is the further point of Senkou Span A and Senkou Span B – so Future Senkou Span A and Future Senkou Span B. It’s important to think of it this way:

The Current Cloud is the average of the Tenkan-Sen and Kijun-Sen from 26 periods ago.

The Future Cloud is the current average of the Tenkan-Sen and Kijun-Sen.

And here is the main point and of the Two Clouds Discovery: When a significant trend change occurs, the Future Cloud is thin with both the current Senkou Span and Senkou Span B pointing in the direction of the Future Cloud.

The image below is Gold’s daily chart. Using the market replay feature in TradingView, I have used November 20th, 2018, as the starting point for this article. It’s important to remember what we are looking for: Current Senkou Span A and Current Senkou Span B pointing in the direction of Future Senkou Span B and Future Senkou Span A.

First, we look to see if the Future Cloud is thin. The thickness or thinness of the Cloud is going to be very subjective, but I believe most people can determine whether something is thick or thin based on the instrument they trade and the timeframe they are trading in. For Gold, this is a thin cloud.

Thin Future Cloud

Next, we want to see if the Current Senkou Span A and Current Senkou Span B are pointing in the direction of the Future Cloud – they are.

Current Senkou Span A and Current Senkou Span B

Now, let’s see what happens when we populate the screen with the price action that occurred after November 20th, 2018. What we should see if a significant trend change is occurring when both the Current Senkou Span A and Current Senkou Span B are pointing in the direction of a thin Future Cloud.

Bull Move

Go through any Daily or Weekly chart and find a thin Cloud and then utilize the market replay – odds are you will see what I have discovered: a high positive expectancy rate of markets trending strongly when price is trading near where the current Senkou Span A and current Senkou Span B are pointing towards the direction of a thin Future Cloud.


Sources: Péloille, Karen. (2017). Trading with Ichimoku: a practical guide to low-risk Ichimoku strategies. Petersfield, Hampshire: Harriman House Ltd.

Patel, M. (2010). Trading with Ichimoku clouds: the essential guide to Ichimoku Kinko Hyo technical analysis. Hoboken, NJ: John Wiley & Sons.

Linton, D. (2010). Cloud charts: trading success with the Ichimoku Technique. London: Updata.

Elliot, N. (2012). Ichimoku charts: an introduction to Ichimoku Kinko Clouds. Petersfield, Hampshire: Harriman House Ltd.


Categories
Forex Indicators

Let’s Trade Divergences!

Trading with Divergences

Almost all forms of technical analysis involve the use of lagging indicators – or lagging analysis. There are very few indicators that use any type of leading analysis. That is because we don’t know what will happen. All we can do is interpret what kind of future behavior may occur based on past events – this is the basis of all psychology and significant portions of medicine: we can only predict future behavior by analyzing past behavior. Now, just because most of the tools and theories used in technical analysis are lagging in nature – it doesn’t mean that there is no method of leading analysis.

Divergences are one method of turning lagging analysis into leading analysis – it’s not 100% accurate, but divergences can detect anomalies and differences in normal price behavior. Divergences are useful in identifying when a significant trend may be ending or when a pullback may continue in the prior trend direction. Let’s review some of those now.

Divergences are easily one of the most complex components to learn in technical analysis. First, they are challenging to identify when you are starting. Second, it can be confusing trying to remember which divergence is which and if you compare highs or lows. It is essential to know those divergences themselves are not sufficient to decide whether or not to take a trade – they help confirm trades.

When we look for divergences, we are looking for discrepancies between the directions of highs and lows in price against another indicator/oscillator. The RSI is the oscillator used for this lesson. We are going to review the four main types of divergences:

  1. Bullish Divergence
  2. Bearish Divergence
  3. Hidden Bullish Divergence
  4. Hidden Bearish Divergence

Bullish divergence

Bullish Divergence

A bullish divergence occurs, generally, at the end of a downtrend. In all forms of bullish divergences, we compare swing lows in price and the oscillator. For a bullish divergence to happen, we should observe price making new lower lows and the oscillator making new higher lows. When bullish divergence occurs, prices will usually rally or consolidate.

Bearish divergence

Bearish Divergence

A bearish divergence is the inverse of a bullish divergence. A bearish divergence occurs near the end of an uptrend and gives a warning that the trend may change. In all forms of bearish divergence, we compare swing highs in price and the oscillator. For a bearish divergence to happen, we should observe price making new higher highs and the oscillator making new lower highs.

Hidden divergences

The last two divergences are known as hidden divergences. Hidden does not mean that it is difficult to see or hard to find – rather, it shows where a short term change in direction is actually a continuation move. Think of it as a pullback or a throwback in a larger uptrend or downtrend. Hidden divergences tell you of a probable continuation of a trend, not a broad trend change. If you combine these with common pullback and throwback patterns such as flags and pennants, then the identification and strength of a hidden divergence can yield extremely positive results.

Hidden Bullish Divergence

Hidden Bullish Divergence

A hidden bullish divergence can appear in uptrends and downtrends but is only valid if there is an existing uptrend. It’s easier to think of hidden bullish divergences as pullbacks or continuation patterns. For hidden bullish divergences, we should observe price making new higher lows and the oscillator making new lower lows. The expected price behavior is a continuation of higher prices.

Hidden Bearish Divergence

Hidden Bearish Divergence

Our final divergence is hidden bearish divergence. Just like hidden bullish divergence, hidden bearish divergence can appear in both uptrends and downtrends but is only valid in an existing downtrend. Hidden bearish divergence is identified when price makes lower highs, and the oscillator makes new higher highs. We should observe a resumption in the prior downtrend when hidden bearish divergence is identified.

Key Points

Regular Bullish Divergence
  • End of a downtrend.
  • Often the second swing low.
  • Price makes new Lower Lows, but the oscillator makes Higher Lows.
  • Trend changes to the upside.
Regular Bearish Divergence
  • End of an uptrend.
  • Often the second swing high.
  • Price makes Higher Highs, but the oscillator makes Lower Highs.
  • Trend changes to the downside.
Hidden Bullish Divergence
  • Valid only during an uptrend.
  • Price makes Higher Lows, but the oscillator makes a Lower Low.
  • The trend should continue to the upside.
Hidden Bearish Divergence
  • Valid only during a downtrend.
  • Price makes Lower Highs, but the oscillator makes Higher Highs.
  • The trend should continue to the downside.

Final words

It may be confusing trying to remember which divergence is which and you’ll find yourself asking questions such as, “do I use highs on this divergence or lows?” It’s easier to think about measuring divergences like this:

All Bullish divergences are going to compare lows to lows – lows in price and lows in an oscillator.

All Bearish divergences are going to compare highs to highs – highs in price and highs in an oscillator.