Categories
Forex Indicators

Everything You Need to Know About Using MACD (Moving Average Convergence Divergence)

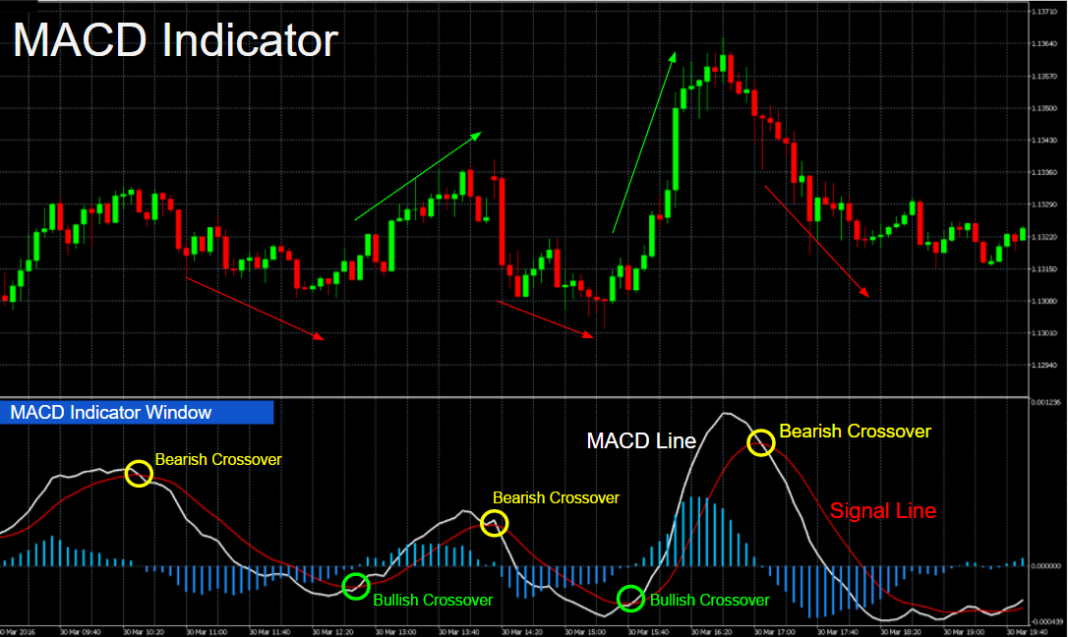
Moving averages identify trends when filtering price fluctuations. Under this idea, Gerald Appel, an analyst and portfolio manager from New York, developed a more advanced indicator. He called it Moving Average Convergence Divergence indicator MACD, which consists of not one but three exponential moving averages. It is seen in the graphs as two lines, whose intersections between them provide trading signals. One is called a MACD line and the other is called a signal line.

This oscillator has been involved in some controversy as to its classification. Mainly because there are analysts who classify it as a trend tracking indicator and others who consider it a follower of the cycle. We can be sure of the following: we are talking about the most effective oscillator after long-term cycles, hence the fact that it can be considered a follower of short- and medium-term trends.

Creating MACD

The MACD indicator originally consists of two lines: a solid line (called a MACD line) and a “strokes” line (called a signal line or signal). The MACD line develops from two exponential moving averages. It responds to price changes quite quickly. The signal line is developed from the MACD line, smoothed with another exponential moving average that responds to price changes in a slower way.

Buying and selling signals are given when the MACD line crosses above or below the signal line. The MACD indicator is included in most technical analysis software and is also on the DIF platform. Nowadays, no analyst needs to calculate it by hand as did its creator, Gerard Appel, because computers do this work faster and with greater precision. The MACD indicator is included in most technical analysis software.

Creation of the MACD:

  1. Calculate an exponential 12-day moving average at closing prices.
  2. Calculate an exponential moving average of 26 days of closing prices.
  3. Subtract the 26-day MME from the 12-day MME and draw its difference, as a continuous line. This is the MACD line.
  4. Calculate an exponential 9-day moving average of the MACD hotline and draw the result as a dashed line. This is the signal line.

Additional MACD Applications

Many operators try to optimize MACD by using other moving averages instead of the more commonly used MME for 12-26 and 9 days. Another option is to use MME 5-37 and 7 days. Some traders try to establish MACD links with market cycles. In the case of using cycles, the first MME should be one-quarter of the duration of the dominant cycle and the second MME should be half of the cycle. The third MME is a smoothing instrument, the length of which does not need to be connected to a cycle.

MACD Trading Rules

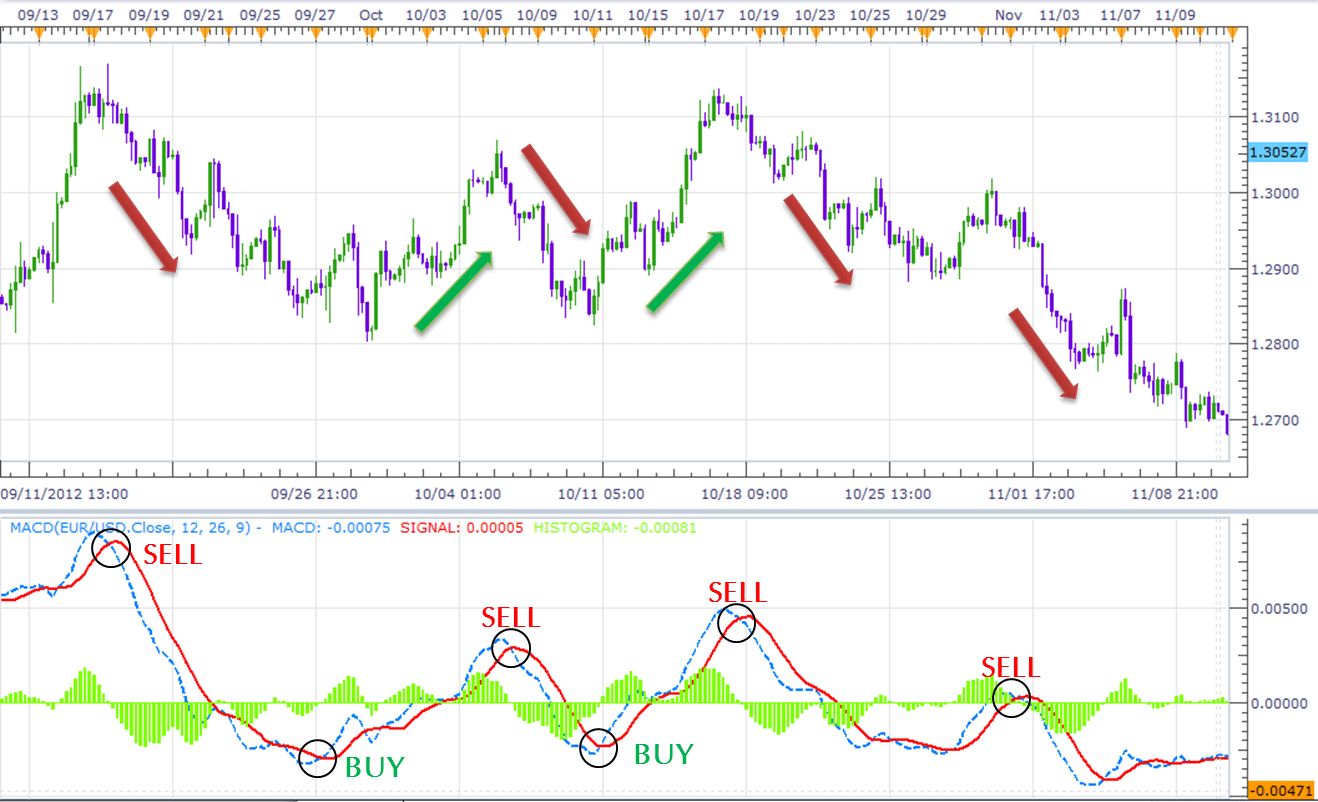
The intersections or intersections between the MACD and the signal lines identify changes in the market trend. Trading in the direction of crossing these lines means following the flow of the market. This system generates fewer operations and signal investments than an automatic system, based on an MMS.

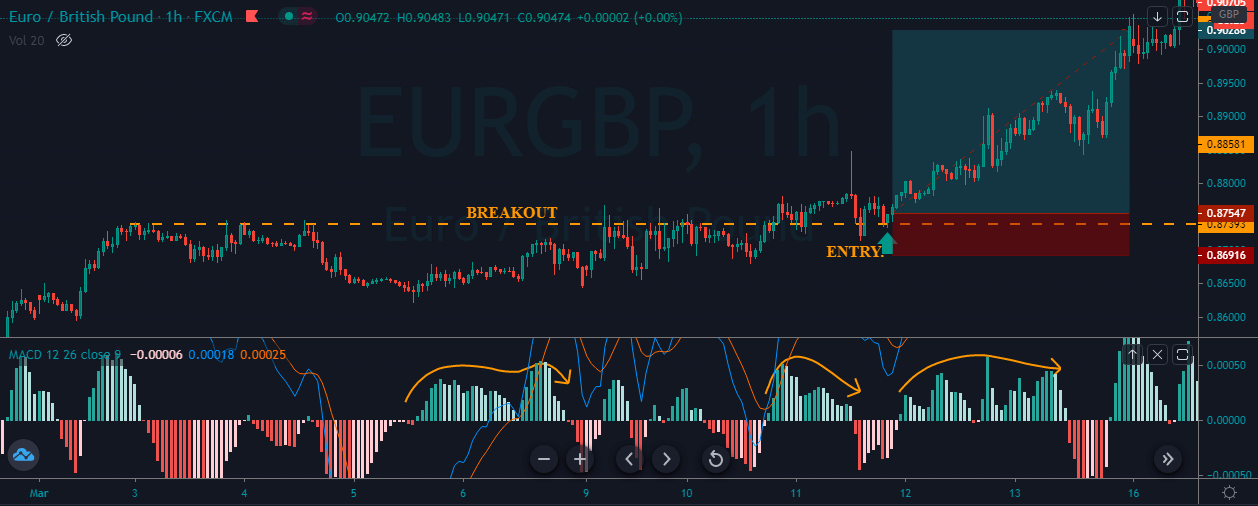
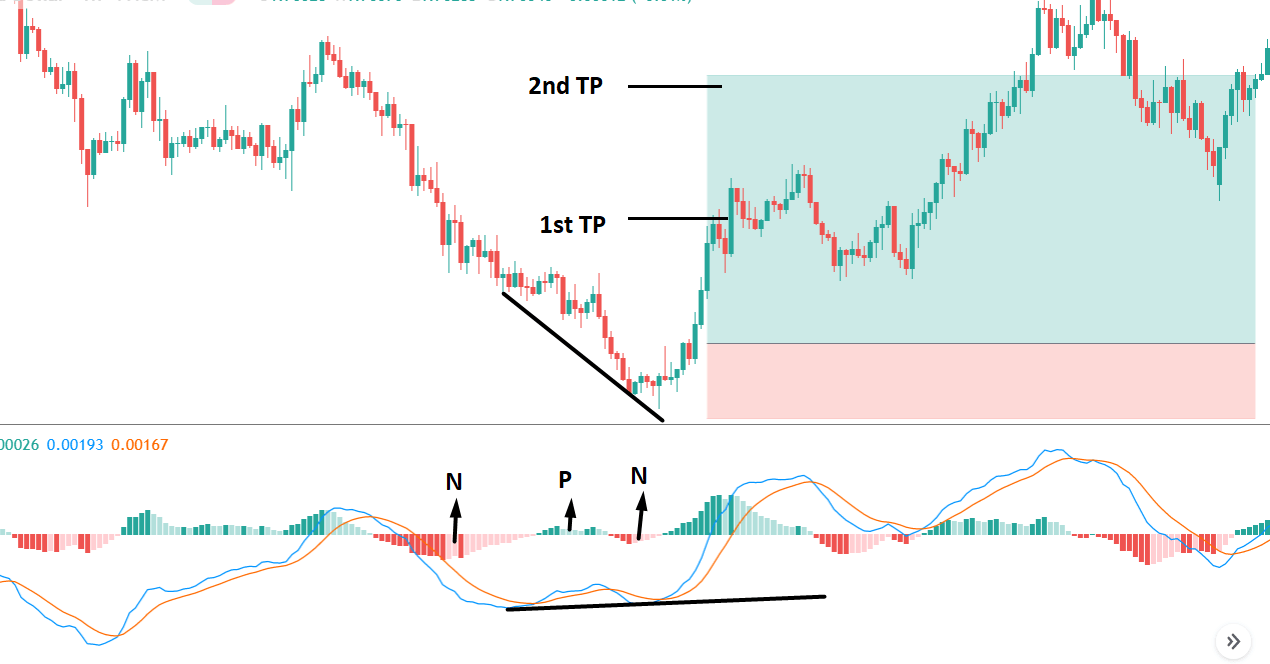
  • When the MACD indicator passes the signal line, it gives a buy sign. Enter long and place a stop loss below the last minimum.
  • When the MACD indicator passes below the signal line, it gives a sell signal. Enter short and place a stop loss above the last maximum.

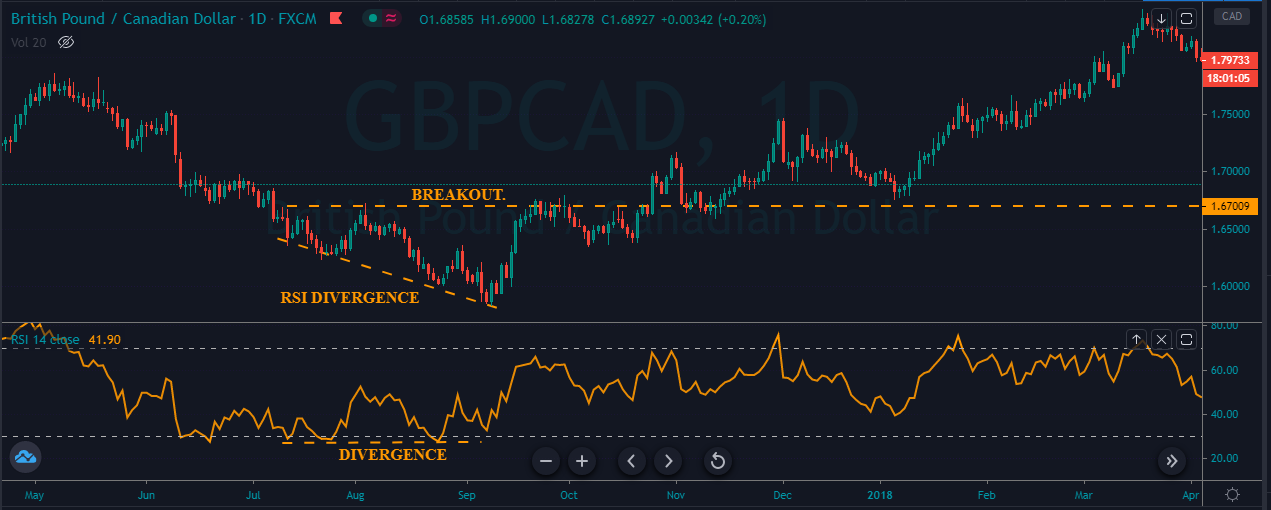
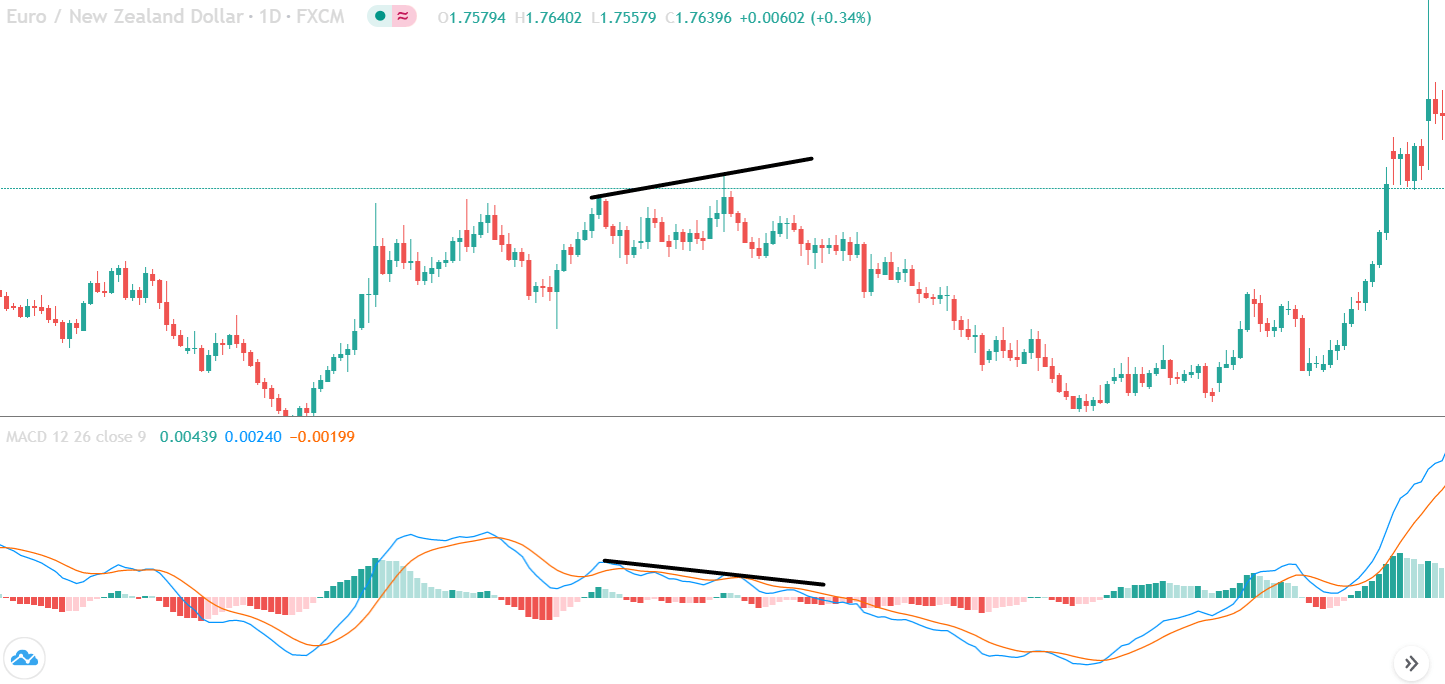
This type of oscillator has two uses. It helps to point out divergences. It also helps to identify short- and long-term variations, not only when the short average moves far above or below the larger average, but also by crossing the two.
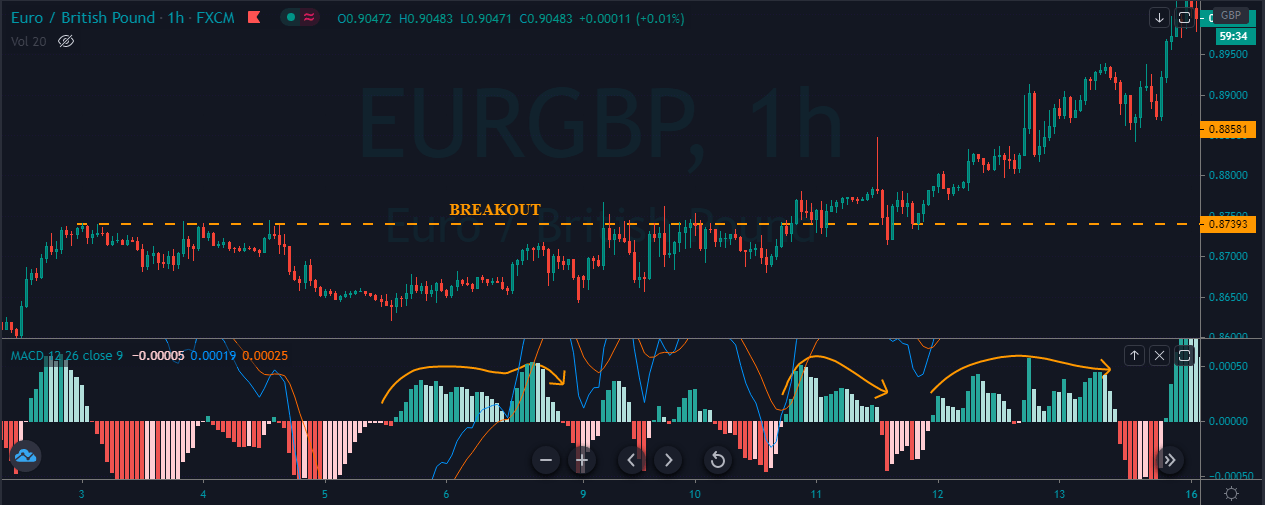
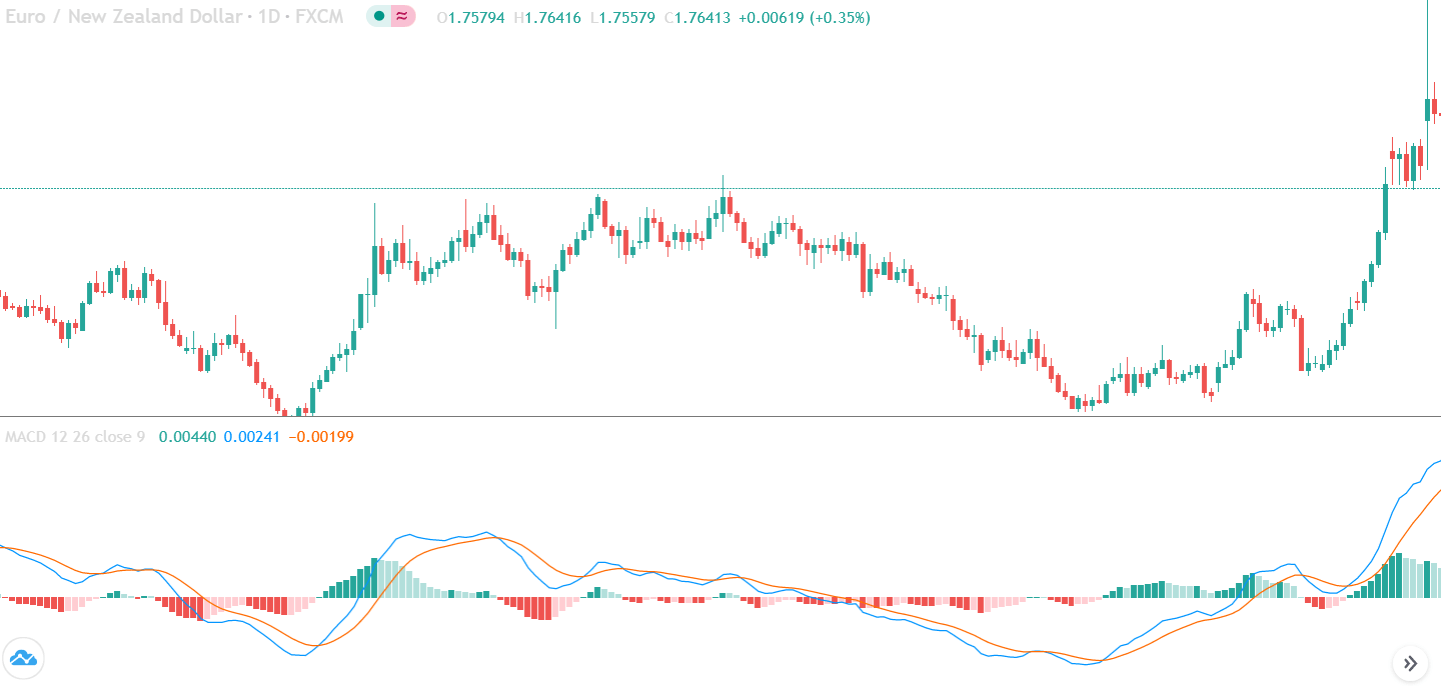
MACD Histogram

The MACD histogram offers a deeper understanding of the balance of power between buyers and sellers than the original MACD. It shows not only who controls the market, buyers or sellers, but also whether they are strong or weak.

MACD histogram = MACD line – Signal line

The histogram of the MACD indicator shows the difference between the signal line and the MACD line. It graphically represents that difference as a histogram, a series of vertical bars.

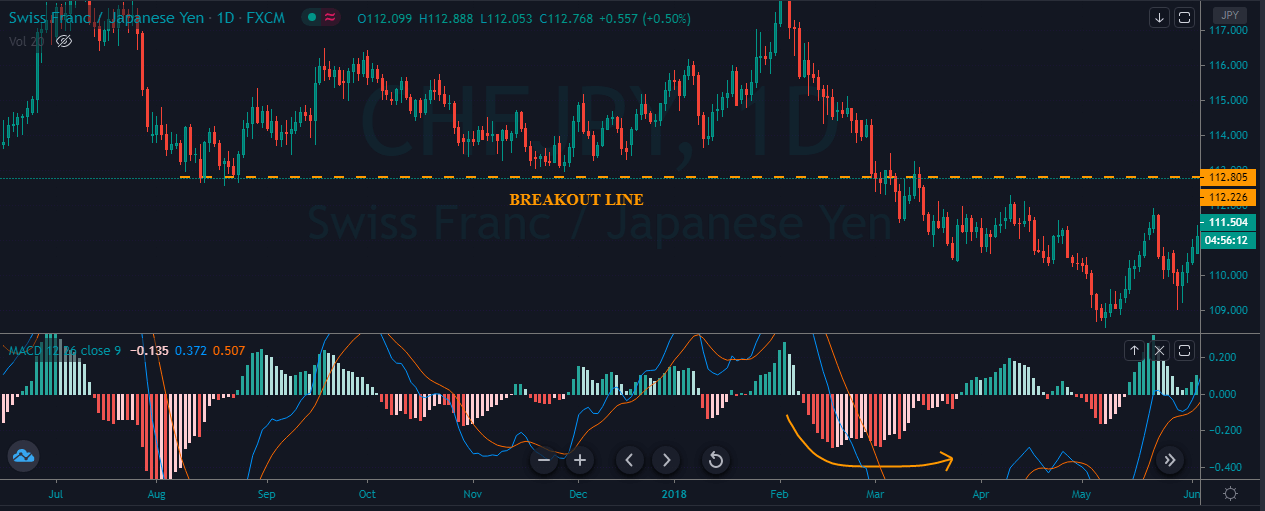
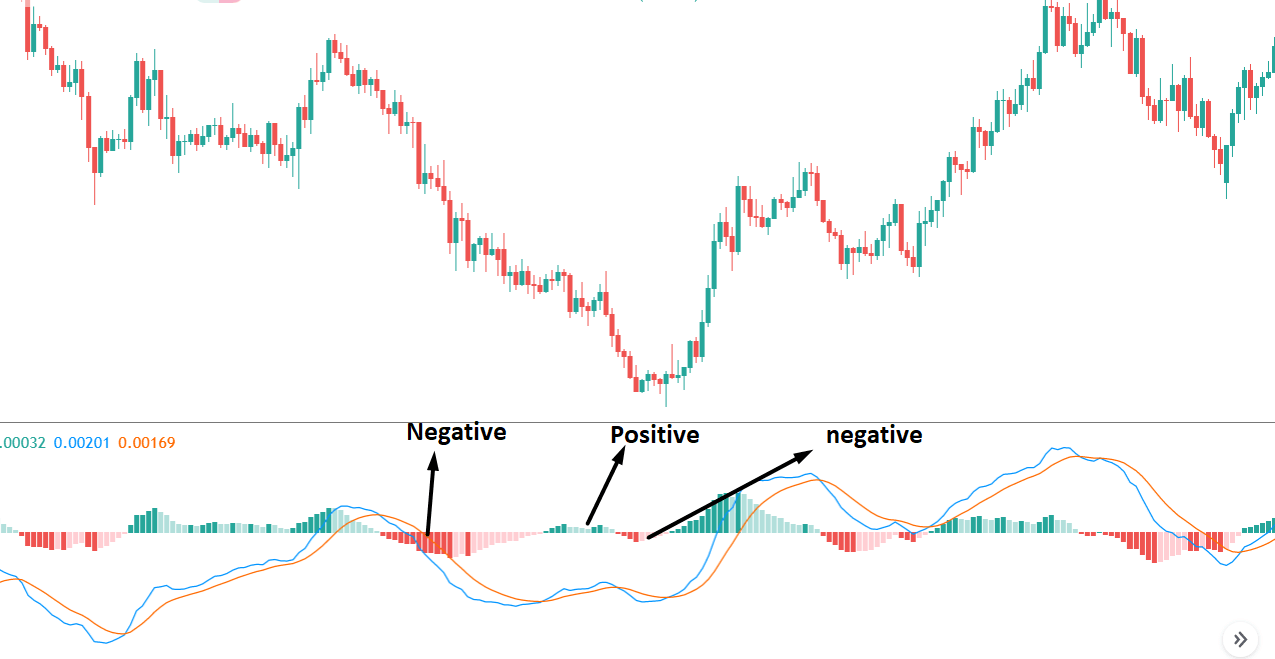
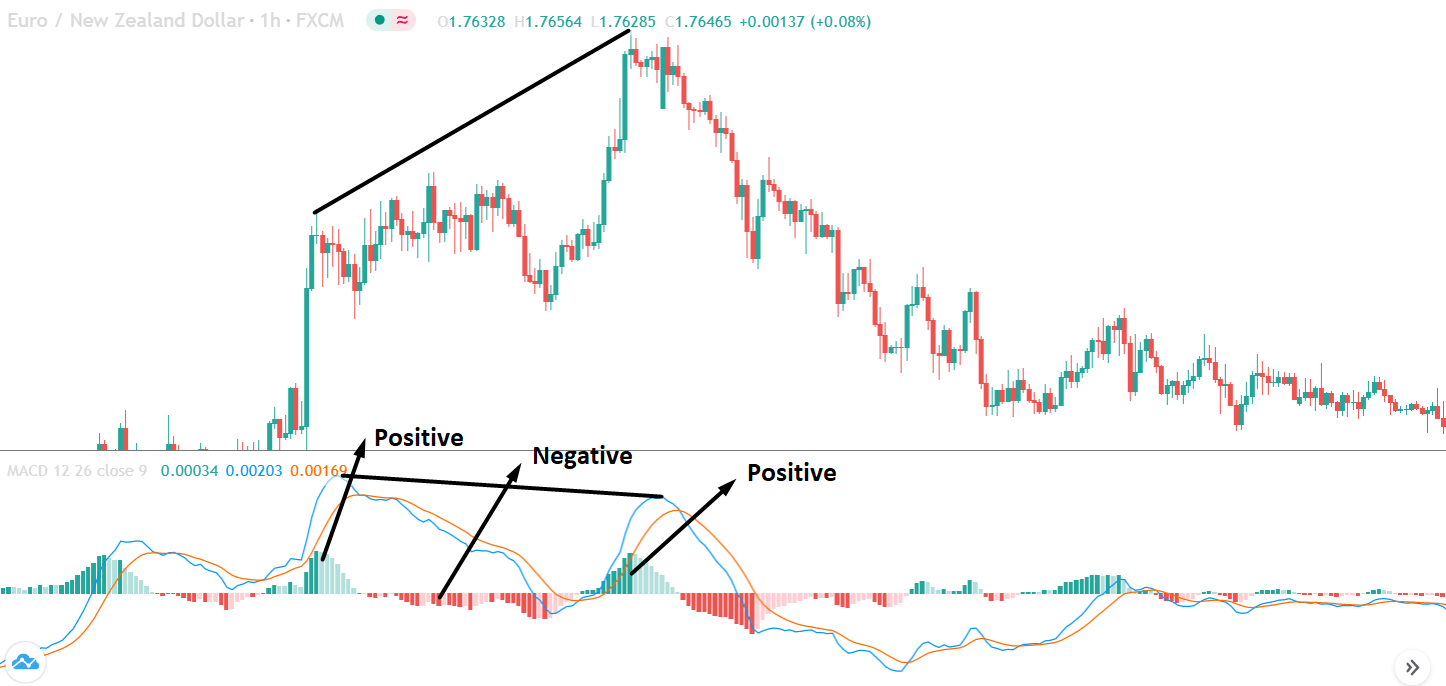
When the MACD fast line is above the slow signal line, the MACD histogram is positive and is represented above the zero line. When the MACD fast line is below the slow signal line, the MACD histogram is negative and is represented below the zero line. When the two lines are touched, the MACD histogram is equal to zero.

Each time the distance between MACD and the signal lines increases, the MACD histogram expands. Each time the two lines join, the MACD histogram is shortened. The slope of the MACD histogram identifies the dominant market group. A growing MACD histogram shows that buyers are starting to strengthen. A decreasing MACD histogram shows that vendors are starting to strengthen.

The slope of the MACD histogram is more important than its position above or below the center line. The best-selling signals are when the MACD histogram is above zero but its address is bearish, showing that buyers are starting to sell out. The best buy signals occur when the MACD histogram is below the zero center line and its slope is bullish, showing that vendors are starting to tire.

However, there are systems that consider buying and selling signals at points where the MACD histogram cuts the zero line. In this case, the buy signal is given when the oscillator crosses from the bottom up, while the sell signal is given when the oscillator crosses the reference line from the top down.

Categories
Forex Course

146. Measuring The Strength of a Breakout

Introduction

When you can see the momentum of the market slowing down, you can soon expect a reversal breakout in any underlying currency pair. Knowing this info will boost your confidence to pull the trigger, and to scale your positions without any hesitation.  Conversely, to trade the trend continuation breakout, knowing the strength of the breakout is also crucial.

In this course lesson, we will learn how to measure the breakout’s strength and take appropriate action according to the information which the market represents.

Using The MACD Indicator To Measure The Momentum

MACD is one of the most common momentum indicators in the Forex market. There are many different ways to use the MACD indicator, and in our case, we suggest you look at the histograms of the indicator to gauge the market strength. As the price moves, if the histograms get bigger, it is indicating that the market momentum is increasing. In this case, we can expect a breakout in the direction of the trend. Conversely, if the histogram gets smaller, it means the momentum is getting weaker, and we can soon expect a reversal in the currency pair.

Buy Example

The image below represents a buy trade in the EUR/GBP Forex pair.

Please observe the first arrow in the MACD histogram. The upsurge lines indicate the strong trend in this Forex pair. When the price action goes above the breakout line with the rising histogram bars, it is a sign of a strong breakout. After the breakout, we took a buy-entry, and the pair printed a brand new higher high.

Sell Example

The image below indicates a sell trade in the CHF/JPY Forex pair.

The image below represents the entry, exit, and stop-loss placements. The price action breaks below the significant level with the rising histogram lines. This shows the sellers are real, and they are ready to make a brand new lower low. After our entry, prices went down, making a brand new lower low. Therefore, when the breakout indicates strong strength, we must go for smaller stops and hunt significant returns.

Using The RSI Indicator To Measure Market’s Strenght

RSI stands for Relative Strength Index, and it is a popular indicator which oscillates between the 0 to 100 levels. When the indicator reaches the 70 levels, it means the market is overbought, and a reversal is expected. When it reaches the 30 levels, it means the market is oversold, and an upside reversal is expected.

In this article, we are not going to use the RSI indicator, like how it is typically used. Instead, we will use the RSI divergence to measure the strength of the trend. A divergence is when the price moves in one direction, and the indicator moves in another. Divergence shows that the indicator is not satisfied with the price action, so in this case, a reversal should be expected.

Buy Entry

  1. Find out the divergence in a downtrend.
  2. Wait for the price action to break above the significant resistance level.
  3. Wait for the hold above the breakout level to confirm the breakout.
  4. Hit Buy.
  5. Place the stop-loss below the breakout.
  6. Go for brand new higher high.

The image below indicates the buying trade in the GBP/CAD Forex pair.

The image below represents our entry, stop loss, and take profit in this Forex pair. As you can see, the trend was down, but on the other hand, the RSI indicator failed to make the higher high. This indicates that the buyers are strong, and after any breakout, we can confidently go long.

Sell Entry

  1. Find out the divergence in an uptrend.
  2. Wait for the price action to break below the significant support level.
  3. Wait for the hold below the breakout level to confirm the breakout.
  4. Hit sell.
  5. Place the stop loss above the breakout.
  6. Go for a brand new lower low.

The image below represents the selling trade in this Forex pair.

As you can see, when the price action and indicator gave the divergence, it means the indicator didn’t like the upward spiral anymore. Also, the buyers are exhausted, and we can expect a strong downward reversal. Soon after the breakout, we took short entry and exited our position when printing the brand new lower low.

[wp_quiz id=”86201″]
Categories
Forex Basic Strategies

Divergence Trading – MACD Regular Divergence Forex Strategy

Introduction

MACD regular divergence is a trading strategy that considers the relationship between Moving Average Convergence Divergence and the price.

MACD, a technical indicator, invented by Gerald Appel in 1979. It is very famous among professional and institutional traders; therefore, it can provide a reliable trading opportunity. On the other hand, divergence is a significant concept in trading that happens between the price and oscillator.

In most of the cases, oscillators like MACD or RSI move with the price. However, there is some condition where MACD does not follow the same direction of the price and creates divergence.

What is the MACD Divergence Strategy?

MACD is a Momentum based indicator that shows the correlation between two moving averages. Traders use this indicator in stocks, bonds, and forex trading as a trend continuation and reversal indicator. If you want to become a successful forex trader, MACD would be the best indicator to follow.

If you use a momentum-based strategy, MACD is the best available technical indicator for you. If you trade using the MACD divergence strategy, it will show you the proper entry and exit points.

There are several types of divergence, but in most cases, investors use the following types of divergences:

Hidden Divergence

It happens when the MACD histogram creates divergence with the price. It indicates a minor market reversal and significant trend continuation.

Regular Divergence

It happens when MACD EMA moves to the opposite direction of the price. Regular divergence from a significant support or resistance level indicates a potential market reversal.

In the example below, we can see a naked chart with a MACD indicator.

If you look at the image, you can see several lower lows, and higher highs in the price and MACD EMA also followed the same direction. However, there is some point where the price and MACD did not follow the same direction as indicated in the image below.

This is how divergence forms in the price. It indicates a potential market reversal if it happens from significant support or resistance levels.

Bullish MACD Regular Divergence Trading Strategy

Bullish MACD regular divergence happens when the price of a currency pair moves to the opposite direction of the MACD histogram from a significant support level. Therefore, bullish MACD divergence strategy is considered as the positive divergence signal.

Timeframe

In this trading strategy, there is no specification of the timeframe. However, this trading strategy works well in H1 and H4 timeframe.

Currency Pair

The MACD divergence trading strategy works well in most major and minor currency pairs, including EURUSD, GBPUSD, USDJPY, and AUDUSD.

Location of the Divergence

It is essential to identify the location of the price. In this bullish divergence trading strategy, the price should form the divergence in a critical support level. Any divergence from a random place rather than a vital level would not provide good profitability. Before moving to the entry point, we should find Negative Positive and Negative (NPN) MACD histogram to form.

Entry

After forming the divergence, we should wait for a bearish reversal candlestick to enter the trade. Make sure to enter the trade as soon as the candle closes.

Stop Loss and Take Profit

In the bullish divergence trading strategy, stop loss would be below the reversal candlestick candle with 10-15 pips buffer.

The first take profit level would be based on 1:1 risk: reward, where you should close 50% of the trade and move the stop loss at breakeven. Later on, the 2nd take profit level would be based on near term event level from where the market is expected to show some correction.

However, as part of the trade management, you can extend the take profit level based on the market momentum. If the price shows an impulsive bullish pressure near the resistance level, it may break the level by creating a new high. In that case, you can extend the take profit level if your trade management system allows.

Bearish MACD Regular Divergence Trading Strategy

Bearish MACD regular divergence happens when the price of a currency pair moves to the opposite direction of the MACD histogram from a prominent resistance level. It is also considered as a negative divergence signal.

Timeframe

Similar to the bullish divergence, this trading strategy works well in H1 and H4 timeframe. You can use this trading strategy in all timeframes, but the higher timeframe provides a reliable result. On the other hand, traders often find it challenging to observe the price in daily and weekly timeframes. Therefore, H1 and H4 are ideal for swing traders.

Currency Pair

The bearish MACD divergence trading strategy works well in most major and minor currency pairs, including EURUSD, GBPUSD, USDJPY, and AUDUSD.

Location of the Divergence

It is essential to identify the location of the price. In this bearish regular divergence trading strategy, the divergence should format a significant resistance level. Any divergence from a random place would not provide good profitability.

Before moving to the entry point, we should find Positive Negative Positive (PNP) MACD histogram to form.

Entry

After forming the divergence, we should wait for a bullish reversal candlestick to enter the trade. Make sure to enter the trade as soon as the candle closes.

Stop Loss and Take Profit

In the bullish divergence trading strategy, stop loss would be above the reversal candlestick candle with 10-15 pips buffer.

The first take profit level would be based on 1:1 risk: reward, where you should close 50% of the trade and move the stop loss at breakeven. Later on, the 2nd take profit level would be based on the near term event level.

Summary

Let’s summaries the MACD regular divergence trading strategy:

  • Find the divergence based on NPN and PNP from a significant level.
  • Enter the trade after a reversal candlestick formation.
  • Stop-loss should be below or above the reversal candlestick with 10 to 15 pips buffer.
  • The first take profit would be based on 1:1 risk: reward ratio, and the second take profit would be based on the price action on the next event level.

There are more ways to use divergence as a trading strategy. Besides the divergence formation, you should focus on how the price is approaching a critical level. Any weakness at a significant level would indicate the first impression of market reversal. Later on, the divergence would indicate the final try of the opposite party. Happy Trading!