Price action traders are to get clues from what the price has been doing. Horizontal Support/ Resistance, Trend Line Support/Resistance, Fibonacci Levels, Equidistant Channel along with Candlestick Pattern are price action trader’s main weapons. A trader must know how to use these tools as far as price action trading is concerned. Moreover, traders often need to adjust to marking levels, which are to be integrated with price action and market psychology. In today’s lesson, we are going to show an example of that.
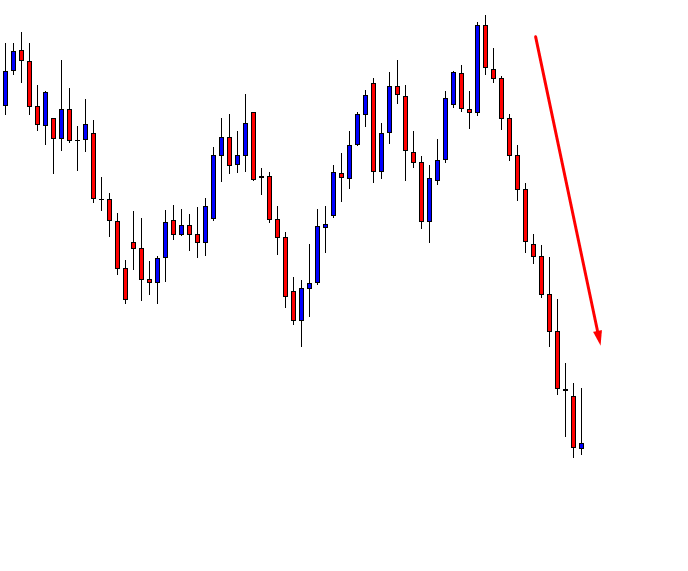
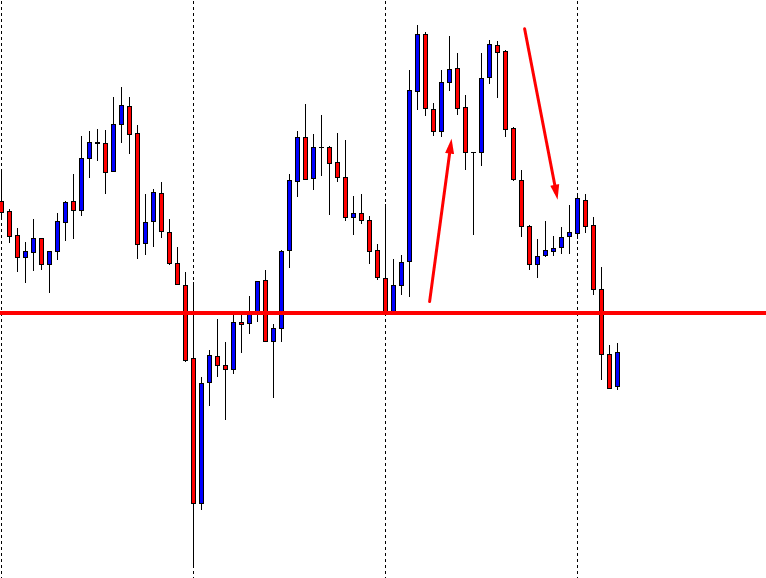
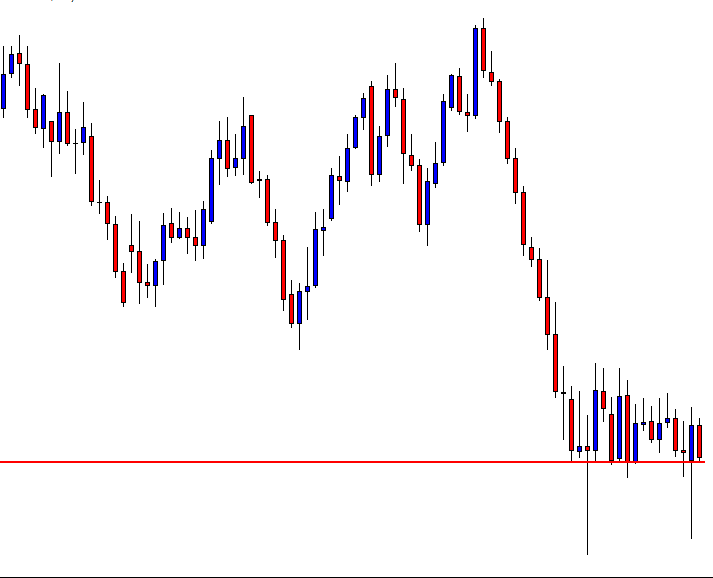
The price has been heading towards the downside with strong bearish momentum. Ideally, traders are to look for short opportunities at upside pullback. See the first reversal candle. The candle closes within the support of the last bearish candle. Thus, the traders must wait to go short since the support holds the price. Let us see what happens next.

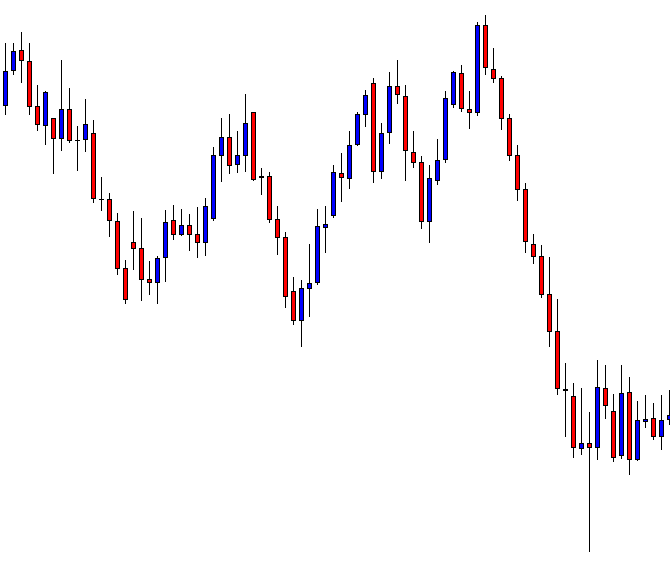
At the last candle, the price goes towards the downside but comes back within the support again. Equations are different now. Long lower shadow and proven support suggest that the traders may have to wait longer than they thought.
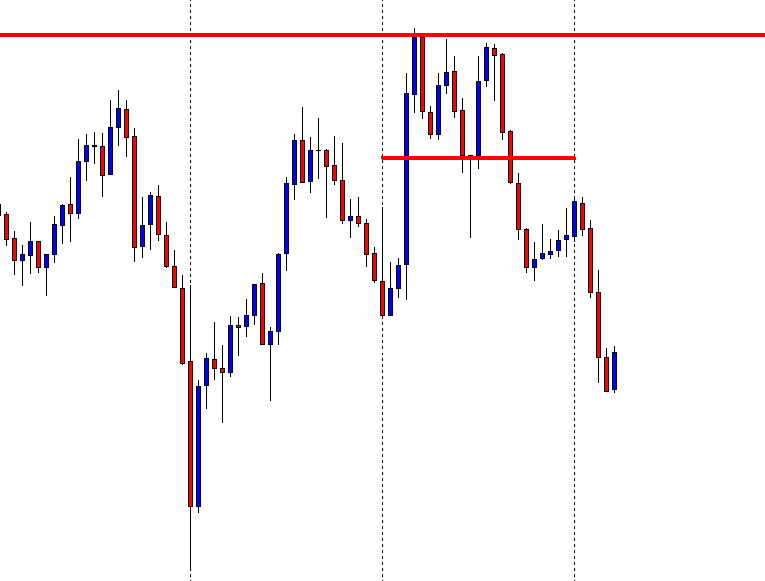
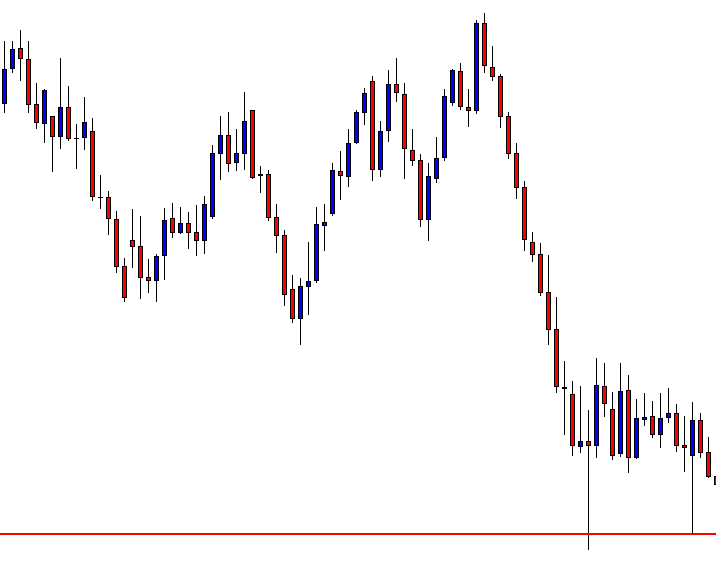
As expected, the price consolidates on choppy price action, which makes traders wait. Traders find horizontal support. Let us draw it.
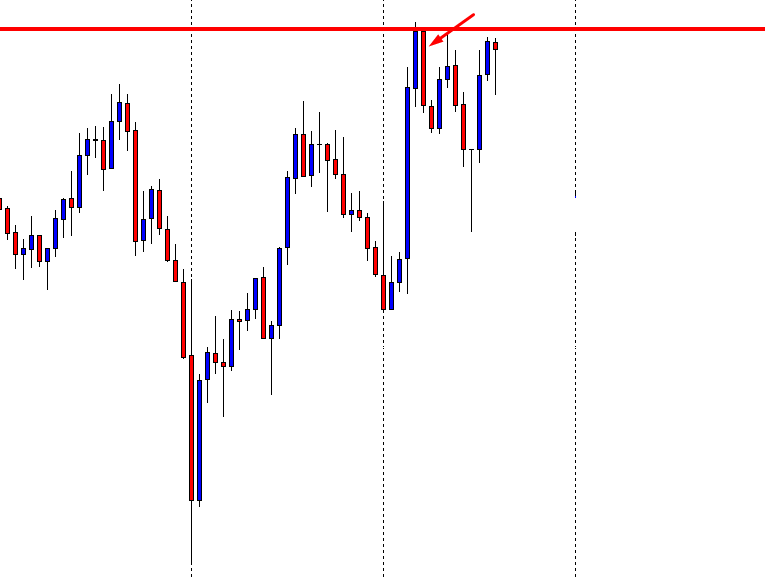
The price obeys the support level several times. However, do not forget that the price had a strong rejection. This is where traders may need to make an adjustment.
The price has been heading towards the adjusted support. Risk-Reward does not look right here. It is better to wait for either a downside breakout or a bullish reversal to go long. Let us see what happens next.
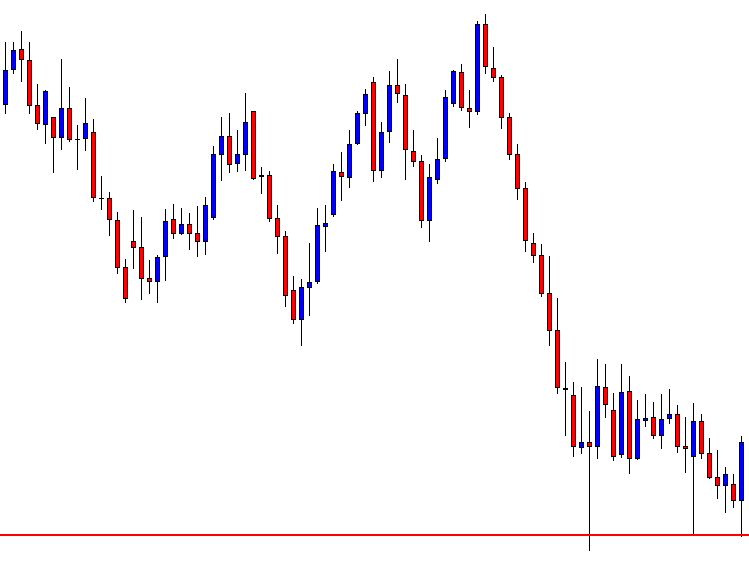
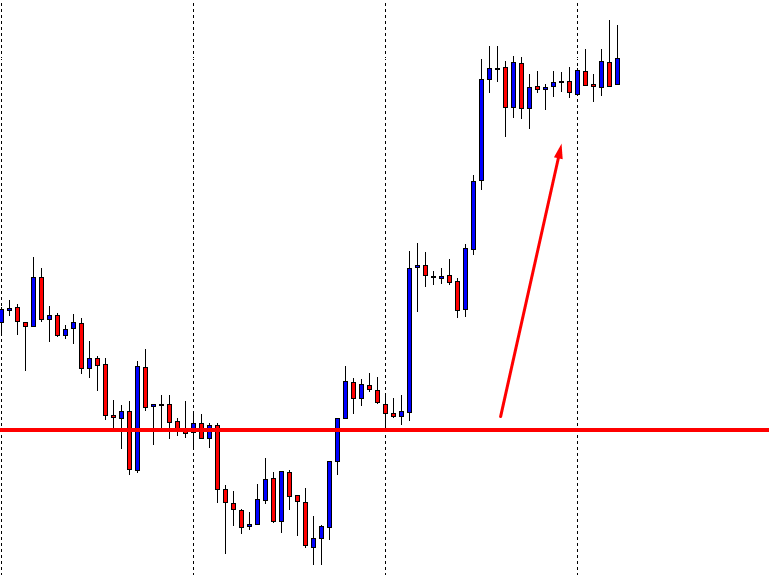
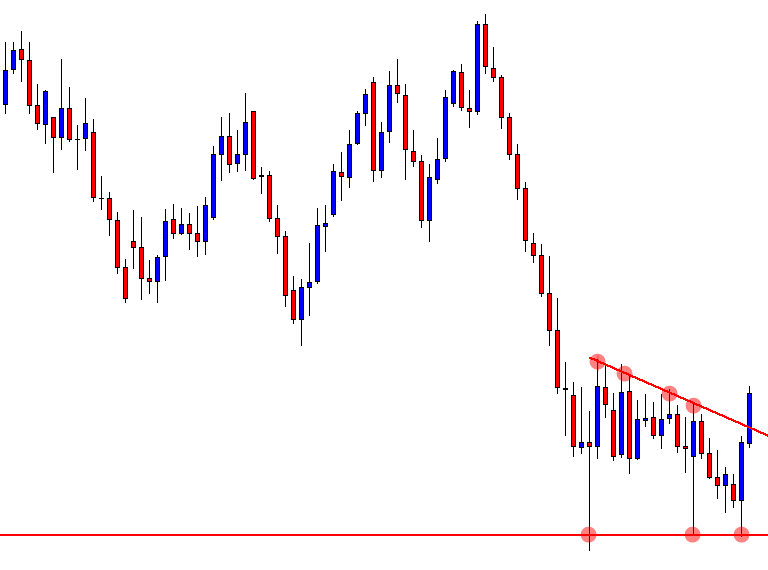
We have a bullish reversal here. A bullish engulfing candle right at the support level suggests that the traders may have to look for long opportunities here. The question is, shall we take an entry right after the last candle closes or not. The answer is ‘No”. We have to wait for an upside breakout. Can you guess where the breakout level is? Think for a minute, and then proceed to the chart below.
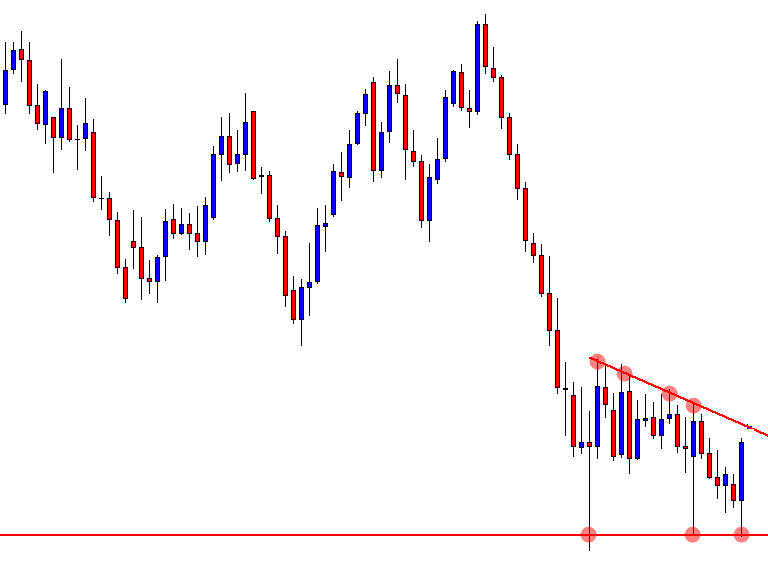
The price has been obeying a down-trending Trend line producing a Descending Triangle. Thus, the breakout at the Trend line resistance is a signal to go long here. All the buyers need here a breakout by a bullish Marubozu candle.
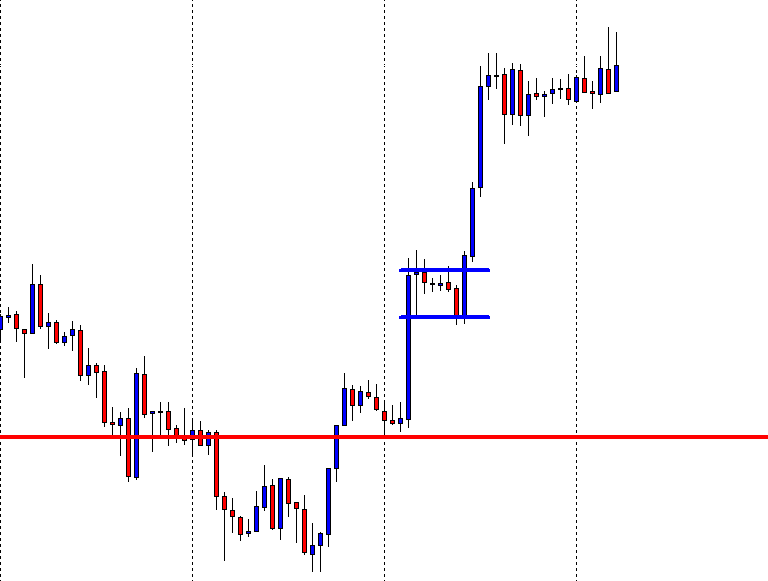
Here comes the breakout that the price action traders shall wait for. The buyers may trigger a long entry right after the breakout candle closes. Stop Loss is to be set below the horizontal support. Let us find out how it proceeds.
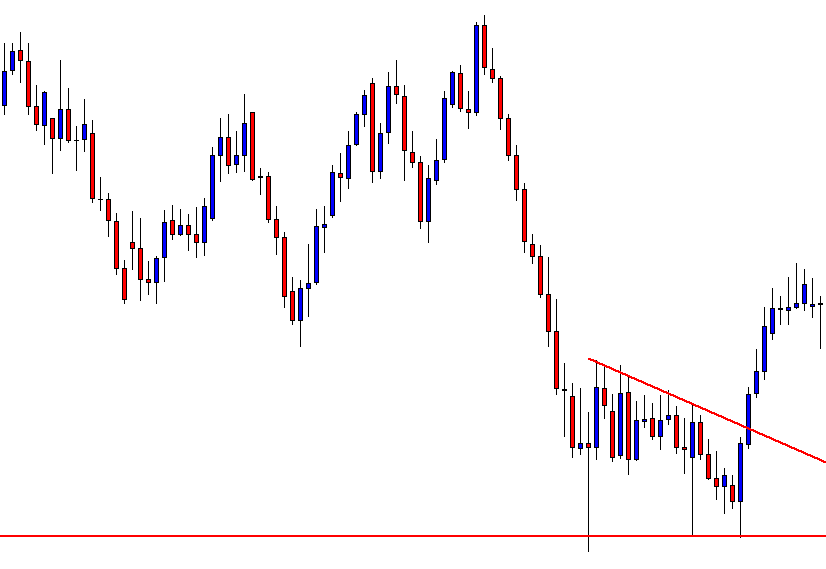
The price heads towards the North and provides 1:1 Risk-Reward. So far here, it seems that it is having consolidation. Some traders may want to come out with their profit. Some may shift their Stop Loss at the breakeven and take some profit out targeting to go all the way towards the swing high. This depends on how a trader wants to manage his trade. With these above charts and examples, we have realized the importance of adjustment in marking support/resistance.