Price Action traders are to look at a chart and make a trading decision according to that. They have to understand the language of it, which reflects the psychology of the market. In today’s lesson, we are going to demonstrate the importance of trading according to the chart’s price movement.

On 17.10.2019, the AUD did well against its counterparts in almost all the pairs. However, in AUDNZD, the AUD did not do well. It rather had a bad day against the NZD. On the day, the AUD was strong against other currencies, but why did it underperform against the NZD?
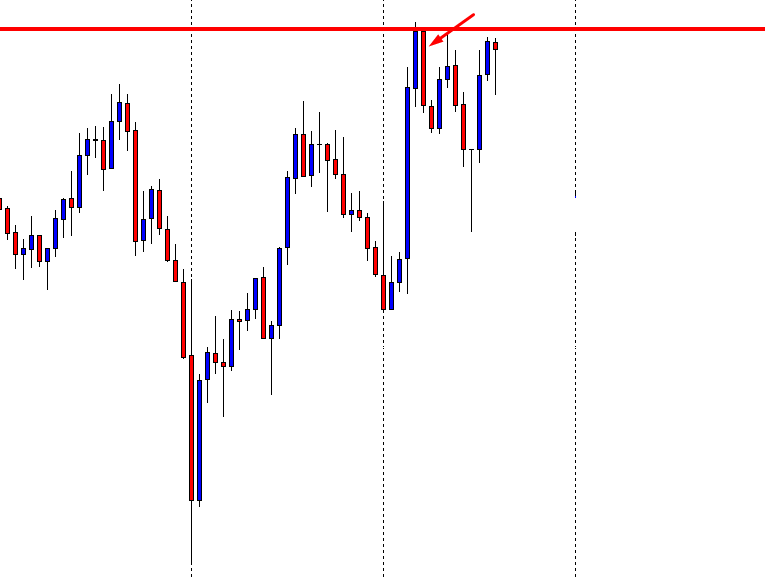
To start with, let us have a look at the H1-AUDUSD chart.
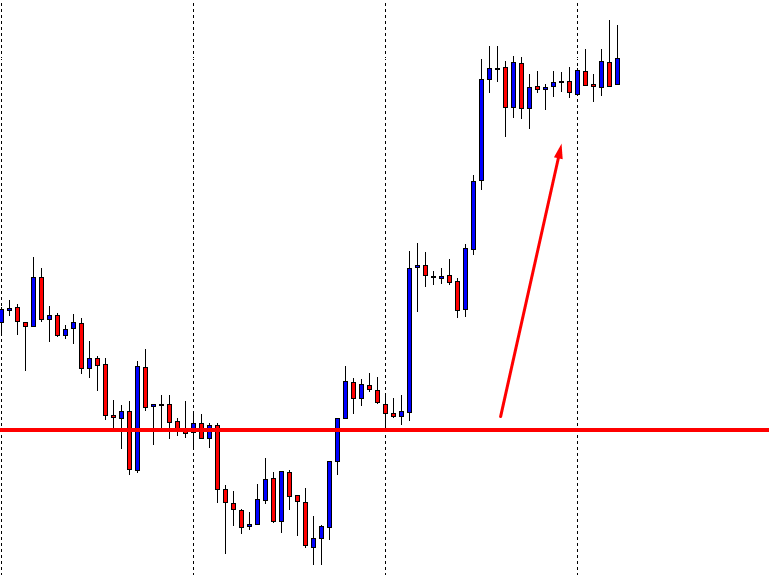
After finding the support at the red-marked line, the price heads towards the upside. It consolidates and continues the move towards the trend. The daily candle closes with a strong bullish tone, barely having an upper shadow. Let us have a closer look at the consolidation.
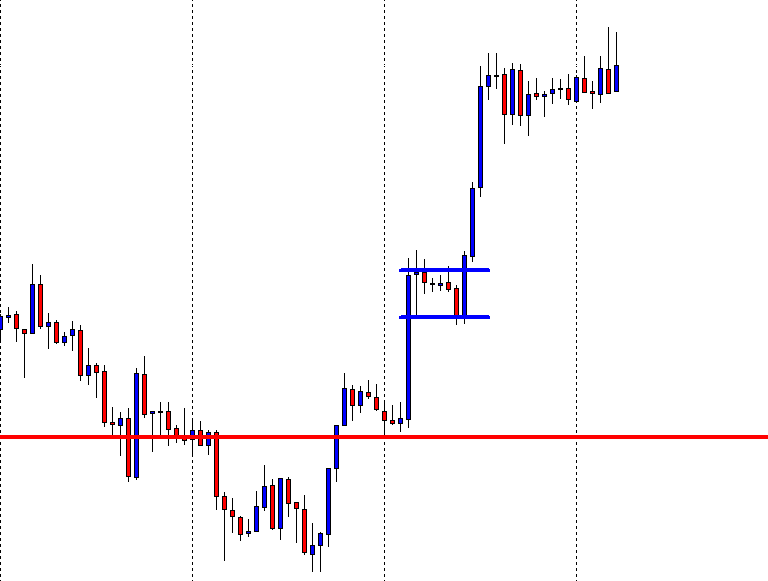
The first reversal candle is bearish. However, it closes within the wick of the last candle, which is a Spinning Top. The price finds support, and after producing an engulfing bullish candle breaching the resistance, it continues its bullish journey.
As mentioned earlier, the AUD was weak against the NZD. Let us now have a look at the H1-AUDNZD chart.
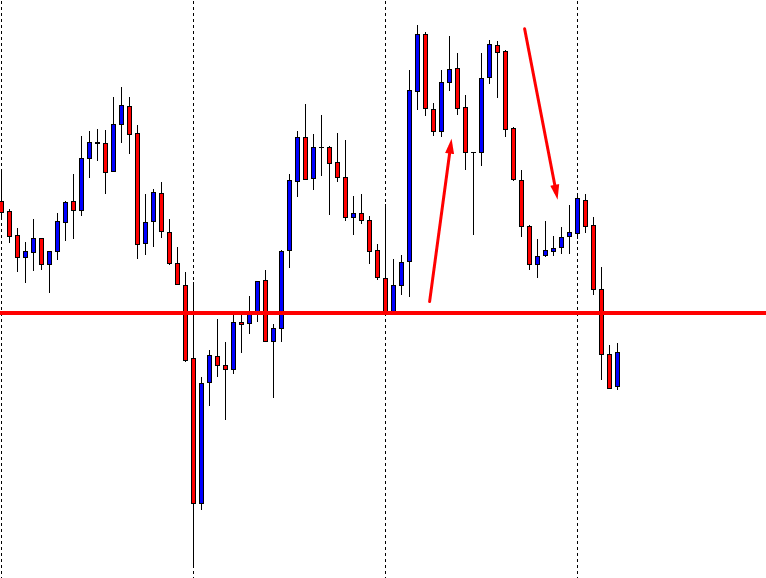
Look at the chart, the price heads towards the North (up arrowed) and comes down. You can assume how the daily candle would look like for that day. In the end, it makes a breakout at the support level and makes a new lower low. Things are completely different here with the AUD. Do you spot out the difference? Let us investigate on the chart.
The price heads towards the North as it does in other pairs. However, look at the first reversal candle (arrowed). This is a bearish engulfing candle. When the consolidation starts with such a candle, the minor time frames’ sellers shall keep their eyes to go short. This often makes a chart look choppy. Even after producing a good bullish reversal candle, the price does not make a breakout at the resistance. It rather comes down and gets choppy. After some hours, this is what happens.
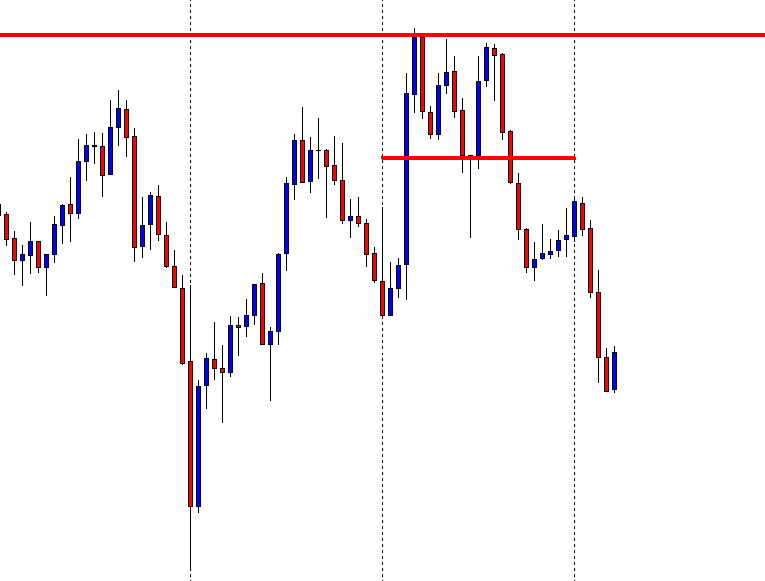
A Double Top and breakout at the neckline drive the price towards the South. The consolidation followed by the breakout at the support makes the price bearish on the following day. We now understand the reason, despite having a good day, the AUD did not do well against the NZD.
To sum up, traders must understand the chart, price action, candlestick formation, and trade according to those to be consistent in making a profit.