
Cryptocurrencies had a steady day, with most of them being in the slight green. Bitcoin is currently trading for $11,768, which represents an increase of 1.22% on the day. Meanwhile, Ethereum gained 4.32% on the day, while XRP gained 1.85%.
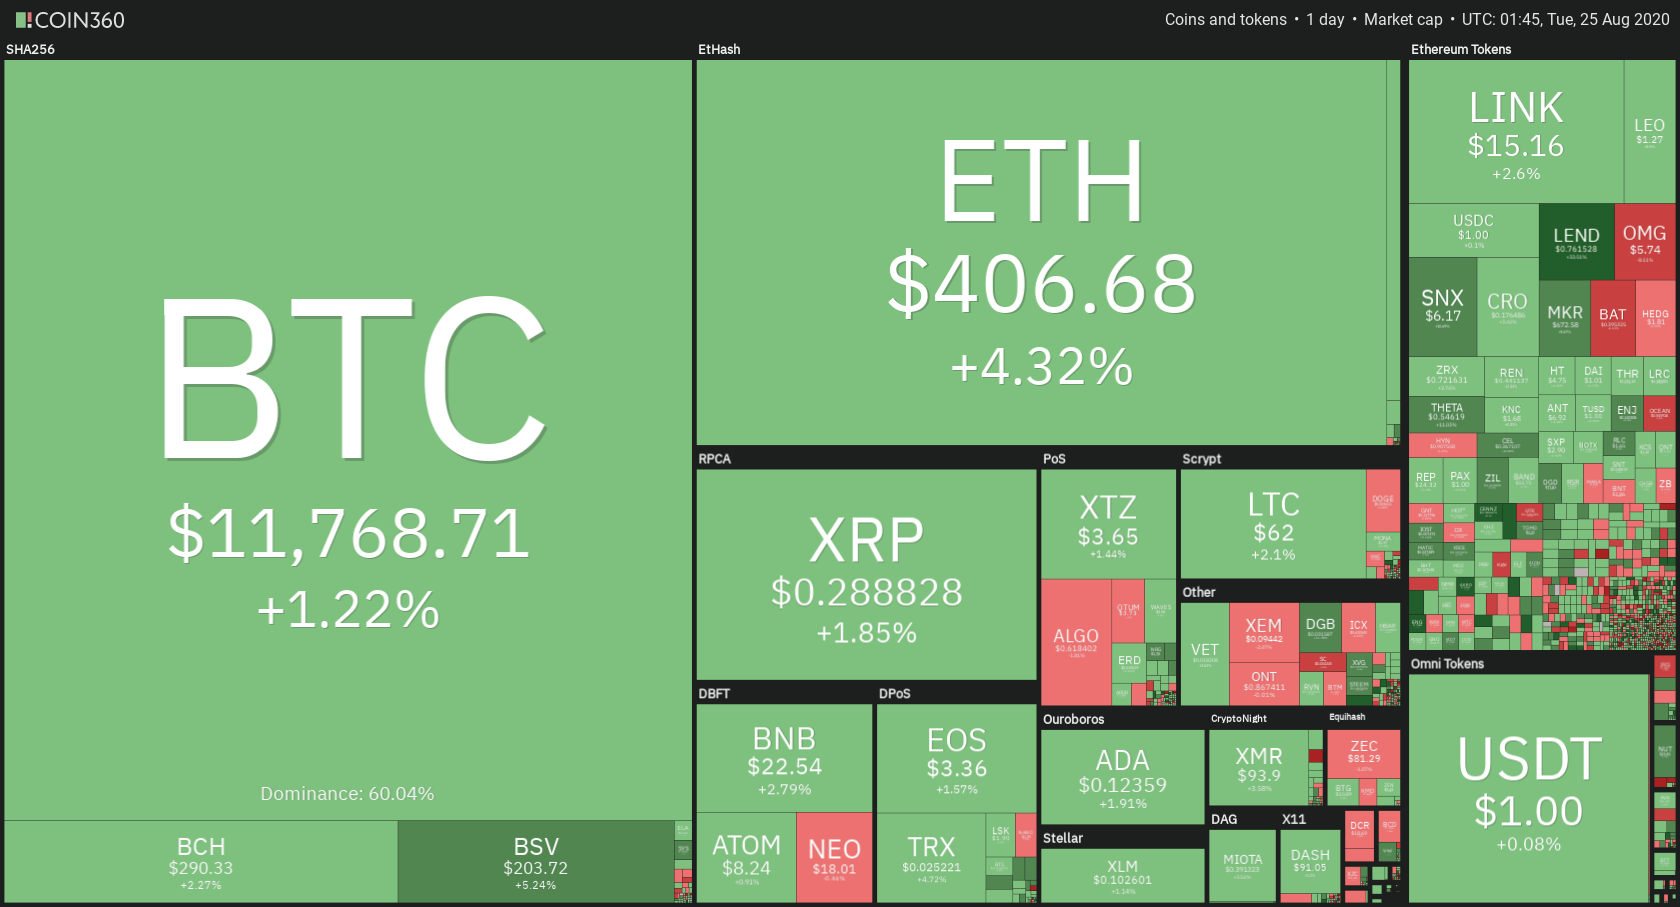
Daily Crypto Sector Heat Map
When taking a look at top100 cryptocurrencies, Aave gained 33.55% on the day, making it the most prominent daily gainer. Kusama (26.13%) and The JUST (17.30%) also did great. On the other hand, Nervos Network lost 7.95%, making it the most prominent daily loser. It is followed by OMG Network’s loss of 7.59% and Siacoin’s drop of 7.53%.
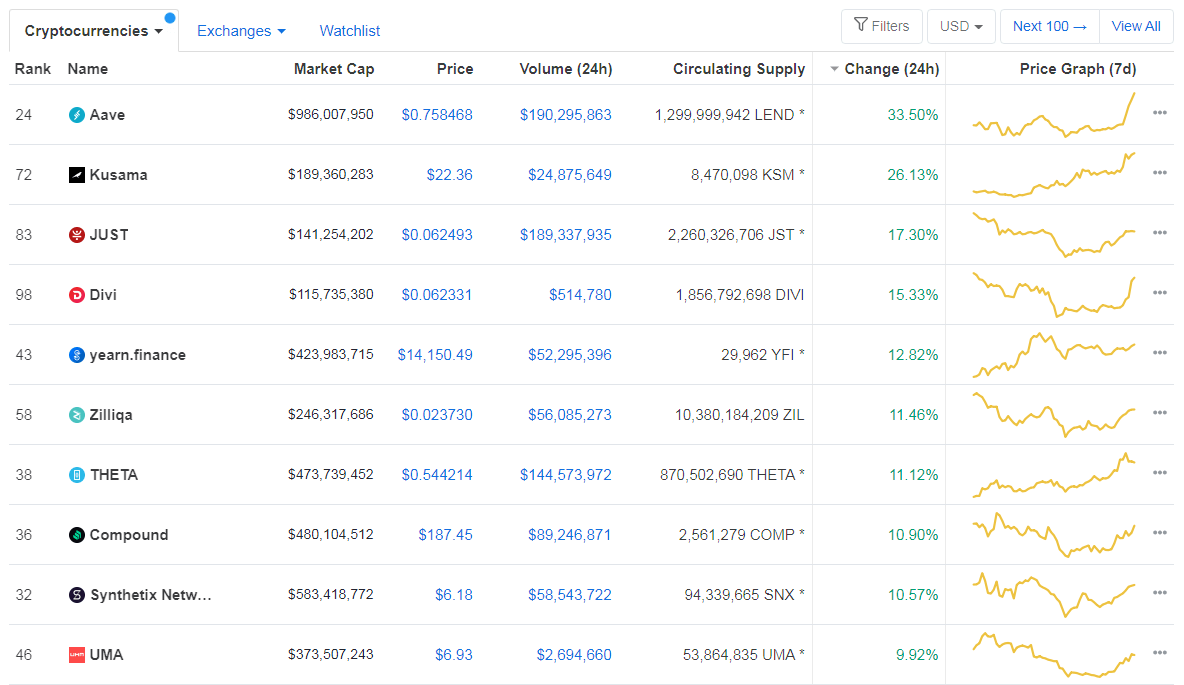
Top 10 24-hour Performers (Click to enlarge)
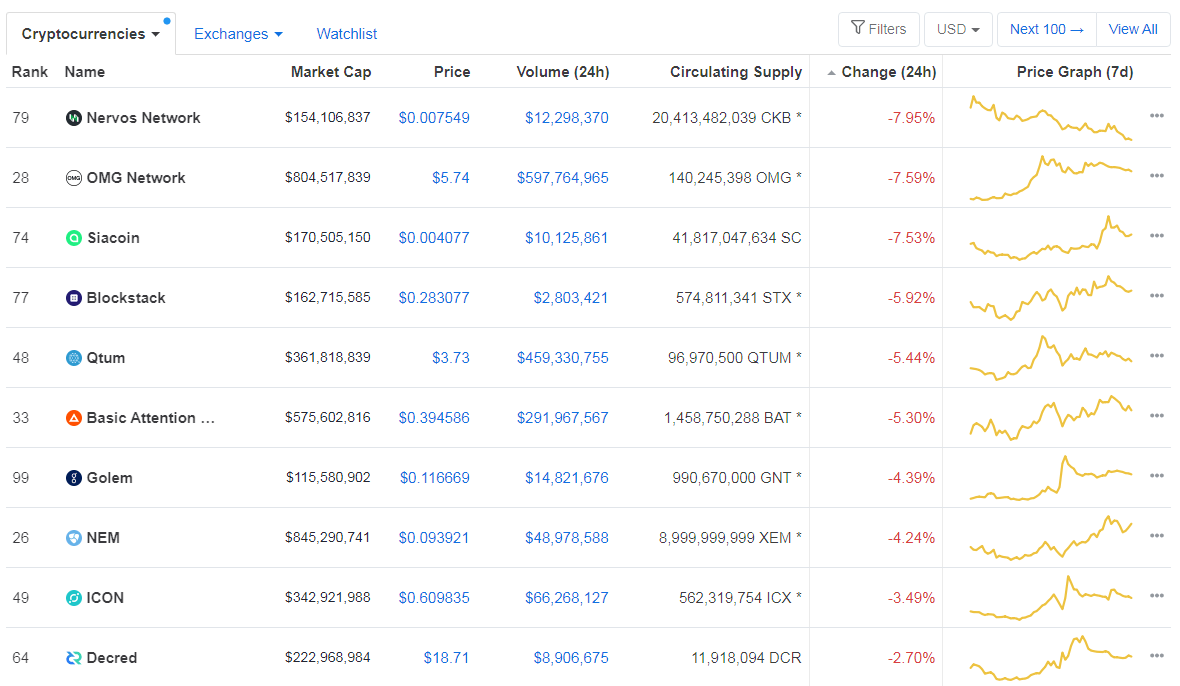
Bottom 10 24-hour Performers (Click to enlarge)
Bitcoin’s dominance level has decreased slightly, with its value currently at 60.04%. This value represents a 0.16% difference to the downside when compared to our last report.
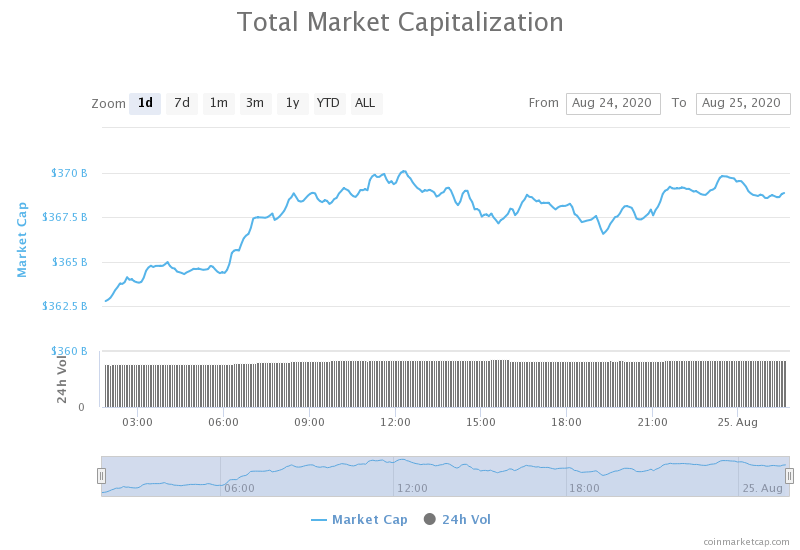
Daily Crypto Market Cap Chart
The cryptocurrency market cap increased in value over the course of the day. Its current value is $368.97 billion, which represents an increase of $6.26 billion when compared to our previous report.
_______________________________________________________________________
What happened in the past 24 hours?
_______________________________________________________________________
- Bitmain inks a $17.7 million dollar deal with the Riot Blockchain for next-gen bitcoin mining hardware (The Block)
- FTX launches perpetual contract tied to Uniswap’s top 100 liquidity pools (The Block)
- Aave granted an Electronic Money Institution license by the U.K. Financial Conduct Authority (The Block)
- Crypto trading platform INX announces SEC Form F-1 approval (The Block)
- Cosmos Token Moons 50%, But Near-Term Technicals Spell Trouble for ATOM (Cryptobriefing)
- Coinbase CEO says Apple is too “restrictive” towards cryptocurrencies (Cryptoslate)
- ‘Bitcoin Rich List’ Reaches All-Time High (Coindesk)
- The Iranian government took down over a thousand crypto mining farms (Cointelegraph)
- I would never invest one cent in Bitcoin, says Ryanair CEO (Cointelegraph)
- China’s digital yuan trials reportedly limited to small retail transactions (Cointelegraph)
_______________________________________________________________________
Technical analysis
_______________________________________________________________________
Bitcoin
Bitcoin is at an important crossroad that will decide its short-term future. While it is currently stuck between $11,630 and $12,000, the largest cryptocurrency by market cap will soon have to decide on its direction. Even though a retest of the $11,630 support seems much more plausible, that does not mean that BTC will make a sharp move towards the downside. If the level holds, Bitcoin might have a good chance of bouncing towards $12,000 yet again.
The low volume also shows that a bigger move is on the horizon.
Traders should look for what BTC will do after it hits one of its support/resistance levels before making a trade.
BTC/USD 4-hour Chart
Technical factors:
- Price is below its 50-period EMA and below its 21-period EMA
- Price is slightly above its middle band
- RSI is neutral (50.15)
- Volume is below average and stagnant
Key levels to the upside Key levels to the downside
1: $12,015 1: $11,630
2: $12,300 2: $11,460
3: $12,900 3: $11,090
Ethereum
Unlike Bitcoin that’s preparing for a move and trading with reduced volume and volatility, Ethereum had a great day and ended up making good gains. The second-largest cryptocurrency by market cap had a small volume spike, which was significant enough to push the price up and past the descending trend it was in for a couple of days.
Ethereum is now stabilizing at around $400, while its volume is decreasing.
Ethereum traders should look for Bitcoin’s next move, which ETH will most likely follow.
ETH/USD 4-hour Chart
Technical Factors:
- Price is currently above its 21-period and its 50-period EMA
- Price is at its upper band
- RSI is neutral (52.30)
- Volume is slightly increased from the previous days
Key levels to the upside Key levels to the downside
1: $415 1: $400
2: $445 2: $361
3: $496 3: $340
Ripple
XRP spent the day consolidating above $0.285 level, which is regained the previous day. The third-largest cryptocurrency by market cap focused on stabilizing above $0.285, but without much success. While it is still technically above it, XRP would need a small move towards the upside (or some other sort of a decisive move) to confirm its position.
XRP traders should be careful around the $.285 level and pick their trade carefully based on where XRP will go.
XRP/USD 4-hour Chart
Technical factors:
- Price is above its 21-period and below its 50-period EMA
- Price is slightly above the middle band
- RSI is neutral (48.63)
- Volume is below average and stable
Key levels to the upside Key levels to the downside
1: $0.31 1: $0.285
2: $0.32 2: $0.266
3: $0.332 3:$0.2454
Related posts
 Daily Crypto Review, Feb 20 – Sudden selloff puts crypto market in the red; Bitcoin under $10,000 yet again
 Daily Crypto Review, Nov 19 – Ethereum 2.0 Most Likely Not Launching on Time; Crypto Sector Consolidating
 Daily Crypto Review, Nov 23 – Ethereum Exploding as its 2.0 Update Launch Approaches; Crypto Market in the Green
 Daily Crypto Review, Nov 24 – XRP’s Push to $0.9 Manipulated? Ether Breaks $600 on Amazing News
One reply on “Daily Crypto Review, August 25 – Bitcoin Whales List Reaches All-Time High; DeFi Projects Still Booming”
Crazy times at the minute