
In this article, we shall be covering the Turtle soup strategy by fading the Donchian channel, and Connor’s RSI strategy.
What is the Donchian Channel indicator?
The Donchian channel is an indicator that considers the high and low for N number of periods. For this particular Turtle Soup strategy, we will be setting the value of N=20, which accounts for the most recent 20 days.
This indicator works based on the highs and lows made by the market. The channel makes a stair-stepping pattern for every high or low made in a period of 20 days.
Below is a chart that shows the Donchian indicator applied to it.
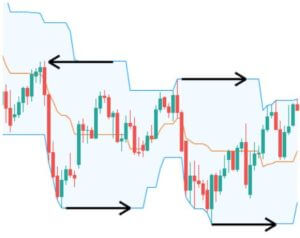
From the above chart, we can clearly see that the top and bottom lines (blue lines) are moving in the form of a stair-stepping pattern representing the highs and lows over the past 20 days. Precisely, the black arrows represent the highs and lows in a look back of 20 days.
Trading the Turtle Soup Strategy
The Turtle Soup is a strategy developed by a trader and author Linda Bradford-Raschke. She published this strategy in one of her books named “Street Smarts: High Probability Short-Term Trading Strategies.” Talking about history, this strategy was taught to a set of novice traders (called the Turtles) by Richard Dennis and William Eckhardt in the 1980s. Also, this strategy is in reference to a well-known strategy called ‘Turtle Trading.’ Over the years, Linda Bradford-Raschke inverted the logic and reasoning behind this strategy and came up with a short-term trading method using this strategy.
Strategy 1: Adding confirmation to Donchian Channel breakout
This is the typical Turtle strategy.
The Turtle strategy using the Donchian channel is simple. When the market breaks above the resistance line, we can prepare to go long. Similarly, when the market goes below the support line, we can go short.
Here are some of the tips and tricks for using this indicator.
- When the market breaks above/below the lines, make sure that the price is holding above/below it.
- The candle that breaks the line must be quite strong.
Trading Example
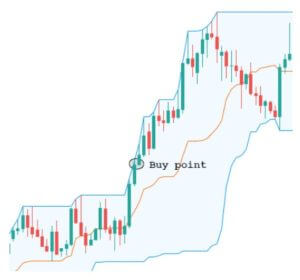
Consider the below figure. Reading from the left, we can see that the market was holding at the upper line of the channel. Later, a huge green candle broke above the channel. Many would hit a buy at this moment, but we wait for a confirmation. When another candle shows a bullish sentiment as well, we can hit the buy at the point shown on the chart.
According to the original Turtle trading strategy, a stop loss of ‘two volatile units is kept,’ which is equal to n-period ATR x 2.
However, to keep it simple, you can keep the stop loss a few pips below the candle, which broke the channel.
Let’s do the converse
In the above example, we saw the typical way of trading the Turtle strategy. In this set of examples, we shall reverse the logic. That is, we will look to go long when the price breaks below the channel and short when the price breaks above the channel. Let’s consider a few examples for the same.
Buy strategy
Let’s say the market makes a 20 day low and is visible on the Donchian channel. Later, the price comes down to that low and even tries to break below it. Once the price shoots right back up to the line, we anticipate on the buy.
Rules:
- The new 20 day low must be at least four days apart from the previous 20 day low. So, you cannot compare the low of yesterday and the low of today as the difference is just one day apart.
- Entry must be 5-10 pips above the previous 20 day low.
- Stop loss must be placed 1-2 pips below the low of today.
- Aim for a take profit of 1R.
Sell strategy
The sell strategy is just the opposite of the strategy discussed for a buy. When a 20 day high is challenged for the second time having a gap of at least four days from the previous low, we can look to go short.
Rules:
- The 20 day high must be at least four days in the past.
- Entry must be placed 5-10 pips below the 20 day low.
- Stop loss must be placed 1-2 pip of today’s low.
- Aim for a take profit of 1R.
Trading examples
Buy example
Below is the chart of the EUR/USD on the Daily timeframe. Starting from the left, we can see that the market came down and made a 20 day low (indicated by the black dotted line). Now that we have the first low, we wait for the price to down to that low in more than four candles (days). And when the price spikes below the prior low and comes back up, we can hit the buy at the encircled region.
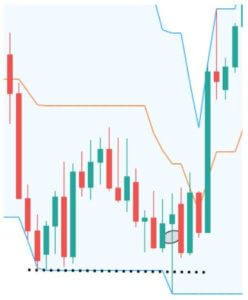
As far as the stop loss and take profit is concerned, we can keep a stop loss 2-4 pips below the low of the present candle and aim for a good 1:1 RR on this trade.
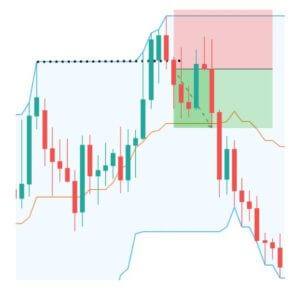
Sell example
In the below chart, the market made a 20 day high up to the black dotted line. Later, the price goes above the previous 20 days high yet again. Here, the price holds above the line and then drops below the next candle. So, once it’s below by 5-10 pips from the previous 20 days high, we can go short. And the stop loss and take profit are self-explanatory.
Conclusion
With no disrespect to the turtle trading strategy, we can conclude that this strategy can be used in both ways. This strategy is backtested and proven by a number of experienced traders. Try this strategy in your trading activities and let us know if you have any questions in the comments below. Happy Trading!


2 replies on “How To Trade The Infamous Turtle Soup Strategy?”
What is this statement mean ? “The 20 day high must be at least four days in the past.”
1. Is it mean that the 20 candle start from LAST CANDLE APPEAR ?
2. What’s is the meaning of AT LEAST FOUR DAYS IN THE PAST ? is it mean that we must use the D1 TIME FRAME and the HIGH must within 4 days ?
Explain me
Hello, thanks for your comment. Once you are on the Daily time frame, you must find the 20-day high as represented by the Donchian channel. A trade can be taken only if the price touches the same 20-day high after four candlesticks. If you see our entry point, we have entered the trade only after confirming that four candlesticks have touched the same 20-day high. We hope that we have answered your question.