How to trade the Australian Dollar
The Australian Dollar is one of the six major currencies traded against the USD and is also popular with cross pairs, such as against the British pound, Euro and Yen.
So far this year, the Australian Dollar has been one of the worst-performing assets among major currencies. A combination of domestic weakness and other external factors such as, more recently, the Coronavirus in China has heavily impacted on this currency.
While Australia’s gross domestic product growth has been recovering since and a low point in 2018, the only expanded very moderately in 2019, the international monetary fund has lowered its forecast in 2020 from 2.8% to 2.3. This may be further impacted the longer the coronavirus goes on because Australia’s gross domestic product is heavily influenced by its commodities exports to China: its largest trading partner with 29.2% of total exports in 2018.
If the virus is contained quickly, Australia can fall back on its low unemployment rate, which has been steady around 5% and it’s housing market which has been turning around since a drop in 2018, and where the more recent upturn is supported by rising house prices.
The Royal Bank of Australia has been doubled in its stance and hinted at depot rate cuts growth remain subdued. It is possible that the Central Bank could roll out extraordinary policies including negative interest rates and large-scale quantitative easing in order to stimulate the economy.
Therefore, the overall sentiment against the Australian Dollar should be considered dovish.
Let’s look at a couple of charts to try and determine the short to the medium-term direction for this currency.
Example A
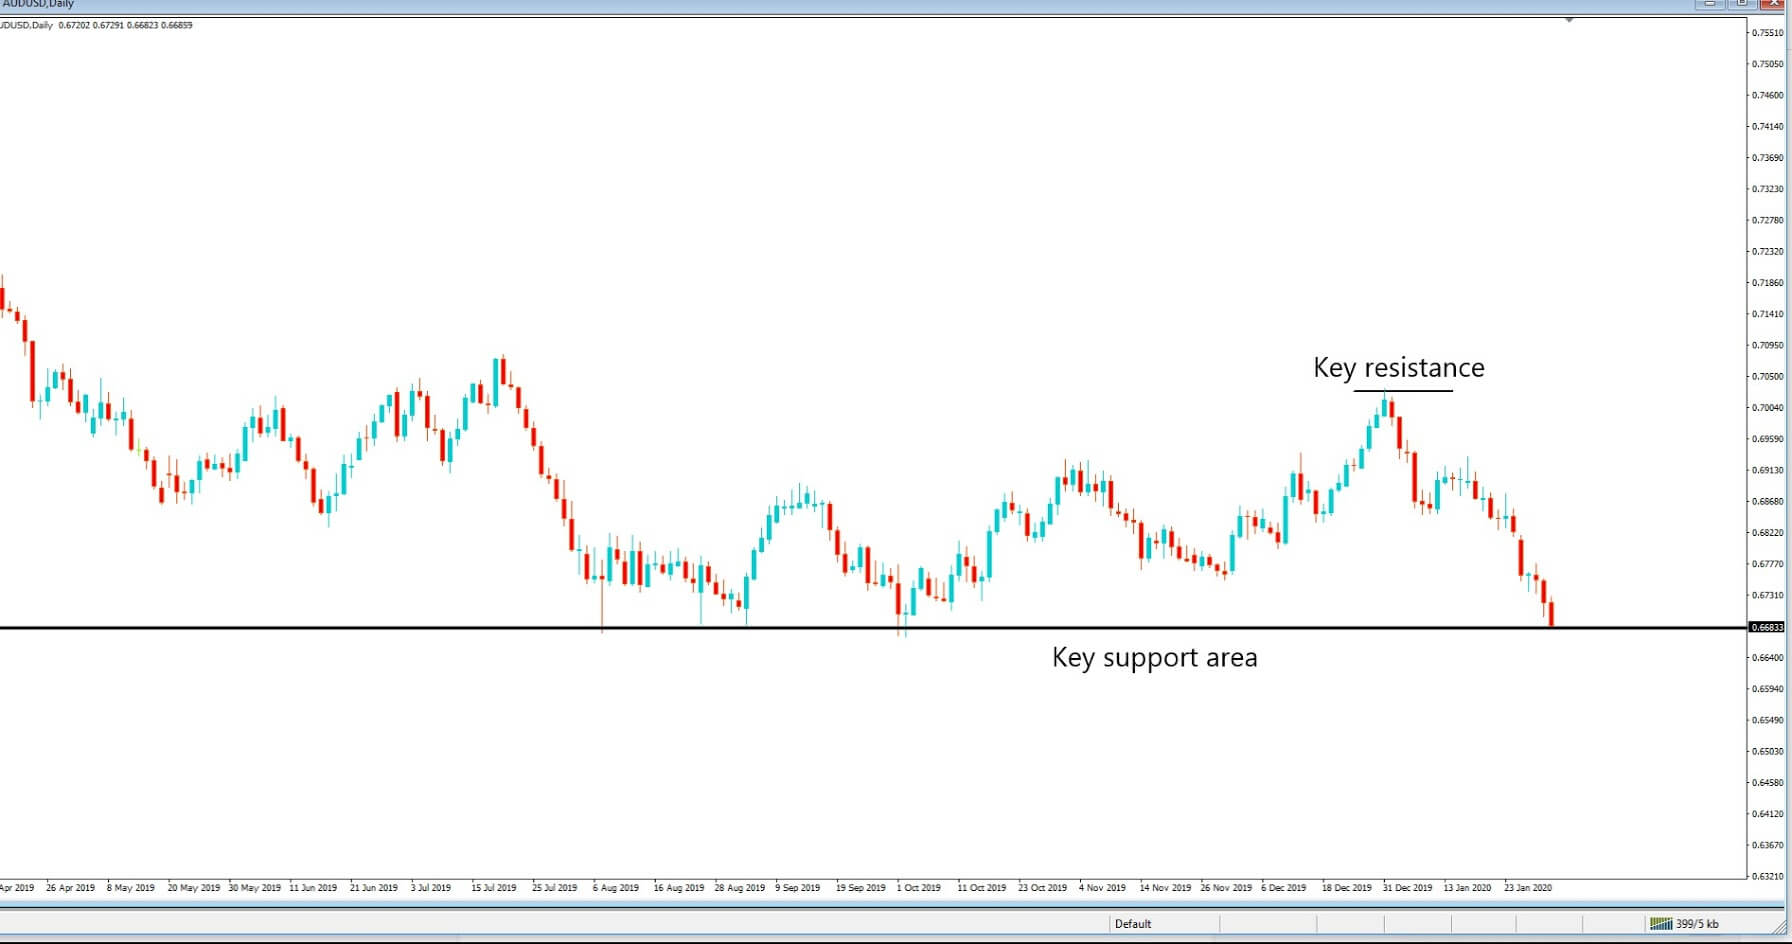
Example A is the daily chart for the AUSUSD pair. After a rally to the key resistance line of 0.70 in December, the pair has been on the back foot and has declined to a key area of support at 0.6880 at the time of writing. We predict that because there does not seem to be any improvements with the Coronavirus situation and where 50 million people are in lockdown in China. And with no vaccine in sight, we see short to medium term problems for the Australian Dollar continuing. Especially where this major pair is concerned, we expect major stop losses to be breached at its current level and a continuation to the downside due to weakness in the Australian Dollar and strength in the US dollar.
Example B
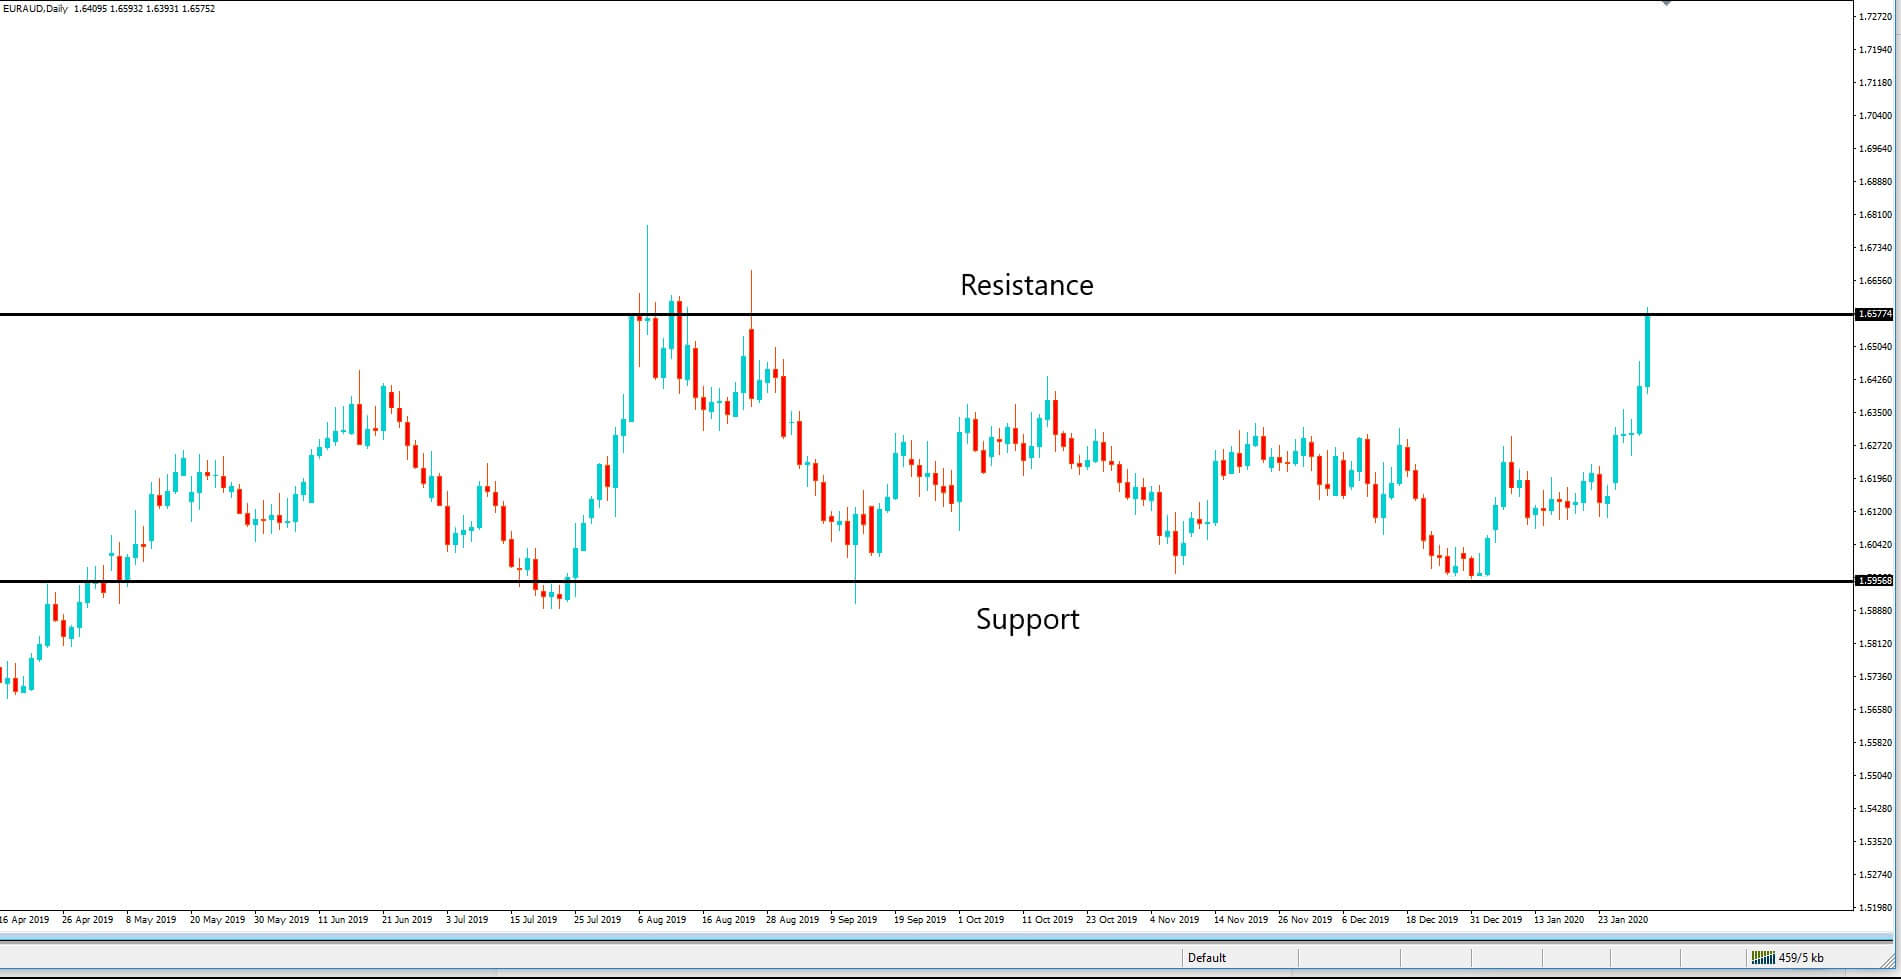
Example B is a daily chart of a popular cross pair: the Euro against the Australian Dollar.
This pair has been fluctuating from two areas of support and resistance in this time frame at 1.5955 and its current position at 1.6577 since May 2019. The rather sharp uplift in this pair over the last two days from the 1.6227 level, confirms general weakness in the Australian Dollar. Again this is an area where we would predict stop losses to be triggered should it move above the 1.66 key level. In the short term, we believe that traders will recognize this is a major level of resistance and where we might expect a pullback in the short term. And whereby Fibonacci technical analysis may help to determine if the pair will continue moving higher. Remember that the euro area has its own problems in terms of growth slow down, which may curtail this move much higher.
Example C
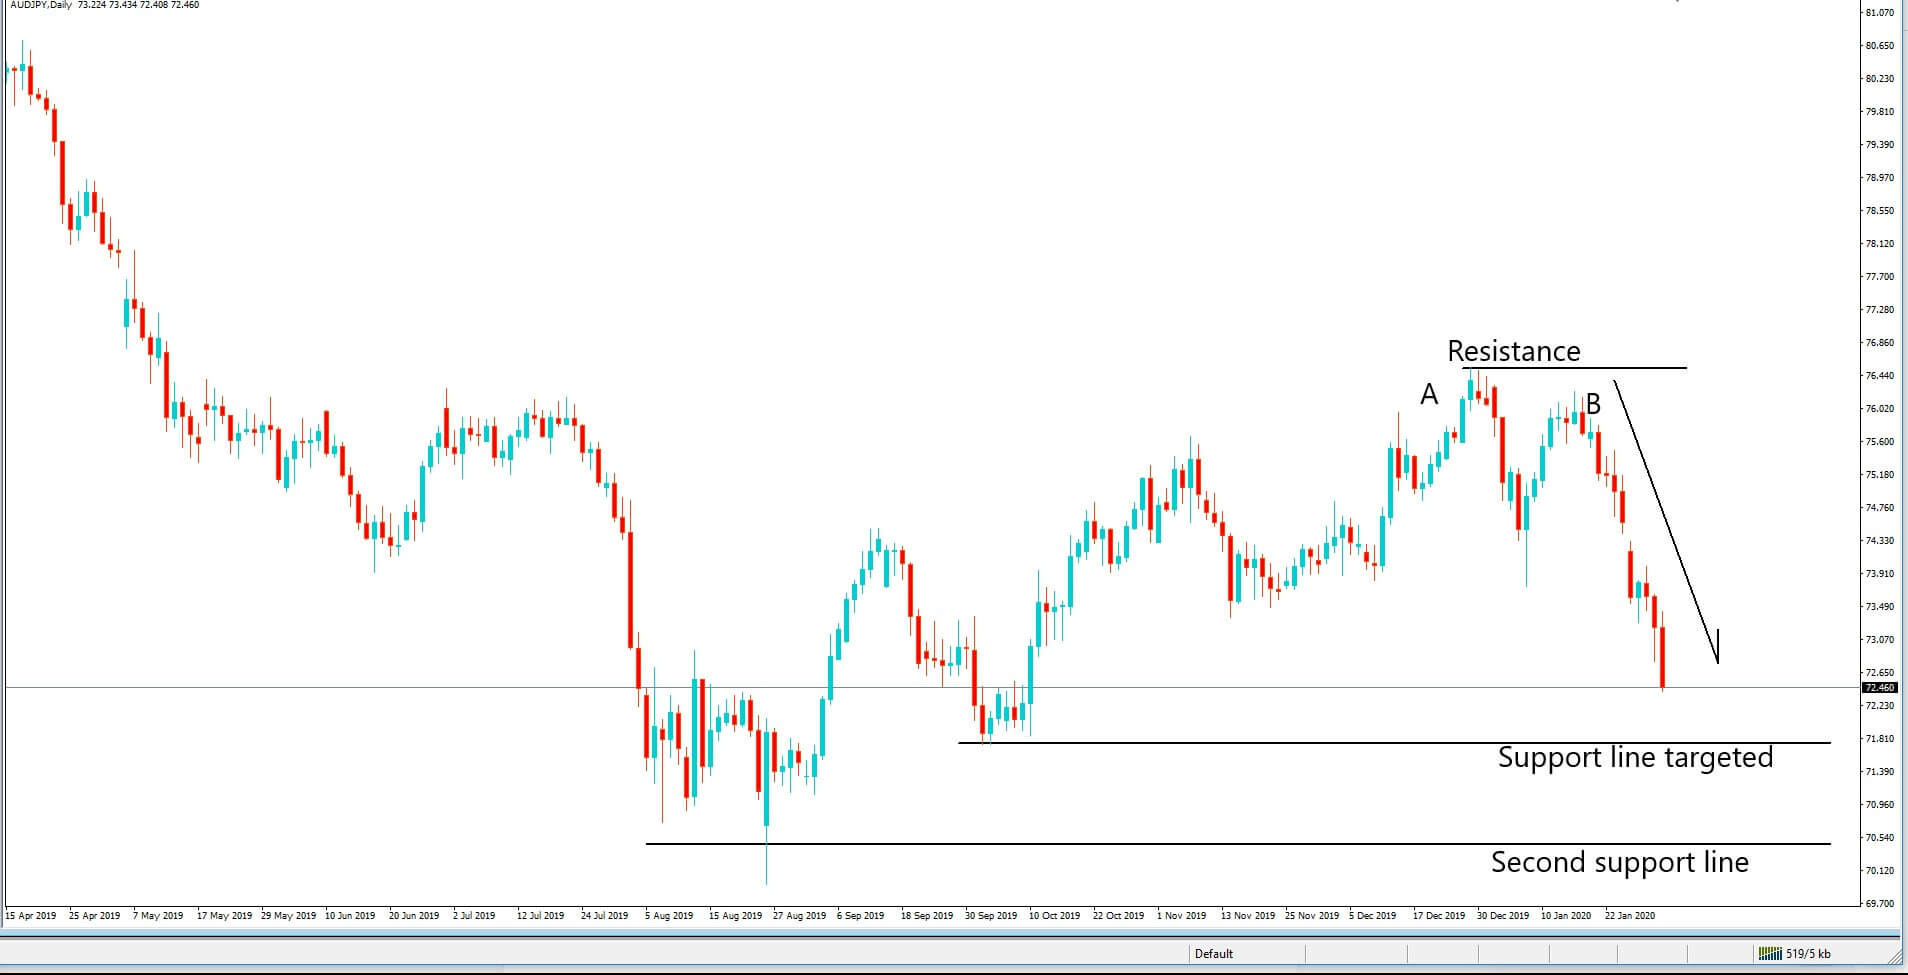
In example C, we get even further clarification of a general weakness in the Australian Dollar with a daily chart of the Australian Dollar against the Japanese yen. After rejecting the resistance line at position A around the 76.50 level, traders failed to reach it again again at position B, and where we have seen an acceleration to the downside. Traders will now be targeting the support line at around 71.80 level, and if
this is breached, stops will be triggered and price action will drive the pair lower to their next target which is around the 70:50 level. The hypothesis is based again on the weakening Australian Dollar and the fact that the market is buying Yen as a safe haven currency, and therefore the emphasis and sentiment is that this pair is due to declining further.

