
The cryptocurrency sector has exploded to the upside as Bitcoin keeps paving the path towards highs only seen during the bull run of 2017/2018. The largest cryptocurrency by market cap is currently trading for $15.632, representing an increase of 10.1% on the day. Meanwhile, Ethereum gained 7.74% on the day, while XRP gained 4.5%.
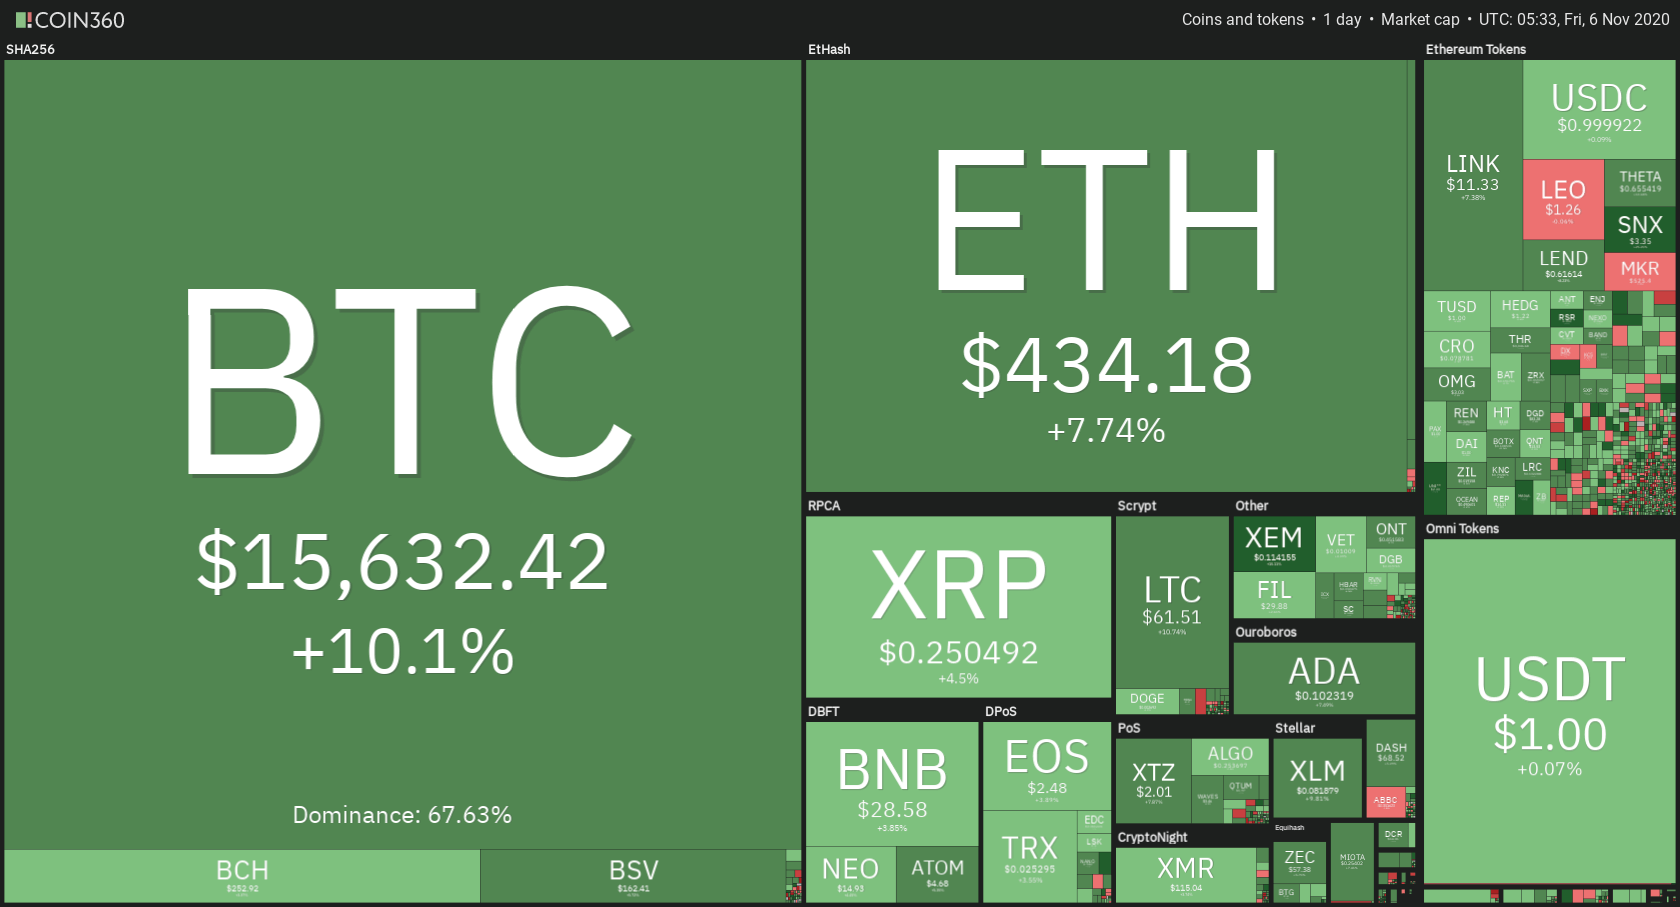
Daily Crypto Sector Heat Map
Uniswap gained 28.39% in the past 24 hours, making it the most prominent daily gainer out of the top100 cryptos ranked by market capitalization. It is closely followed by Aave’s gain of 25.21% and NEAR Protocol’s 23.87% gain. On the other hand, The Midas Touch Gold lost 6.16%, making it the most prominent daily loser. It is followed by Numeraire’s loss of 5.03% and Celo’s loss of 3.94%.

Top 10 24-hour Performers (Click to enlarge)
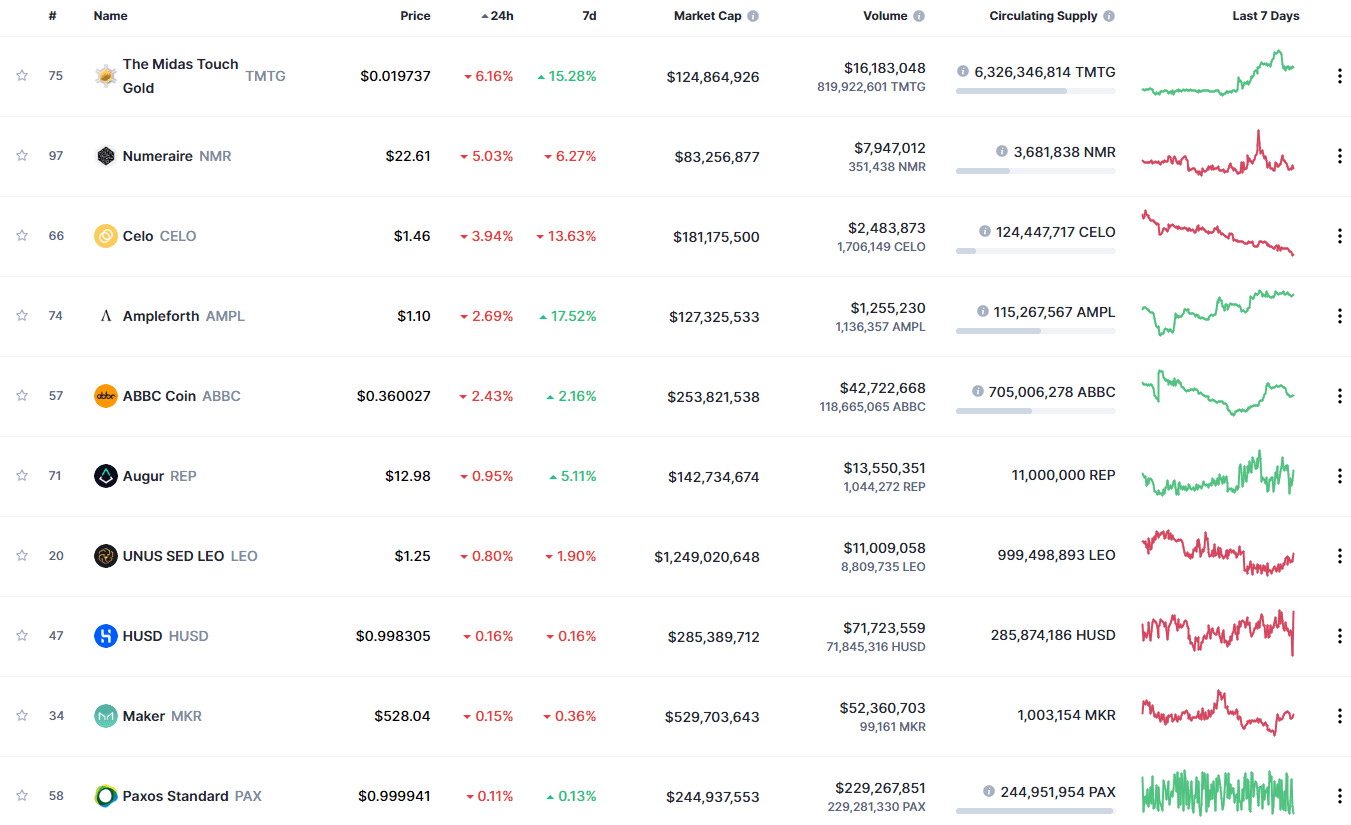
Bottom 10 24-hour Performers (Click to enlarge)
Bitcoin’s market dominance level has increased slightly since we last reported, with its value is currently staying at 65.3%. This value represents a 0.4% difference to the upside when compared to the value it had yesterday.
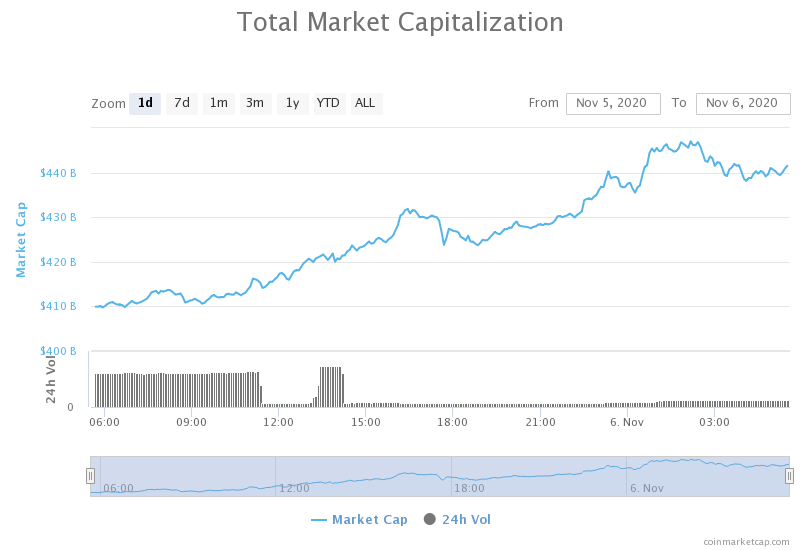
Daily Crypto Market Cap Chart
The crypto sector capitalization has skyrocketed in the past 24 hours. Its current value is $440.94 billion, representing a $28.77 billion increase compared to our previous report.
_______________________________________________________________________
What happened in the past 24 hours?
_______________________________________________________________________
- Vitalik Buterin contributes 3,200 ETH to Ethereum 2.0’s deposit contract address (The Block)
- Two big questions ahead of China’s central bank digital currency launch (The Block)
- Over $1M in user funds on Compound fork Perfect Finance are frozen after code change error (The Block)
- What do SEC and CFTC press releases reveal about crypto regulation efforts? (The Block)
- Bitcoin On-Chain Metrics Spell Trouble as BTC Breaks $15K (Cryptobriefing)
- US Dollar Weakness Exposed, Investors Flip to Bitcoin (Cryptobriefing)
- Coinbase Lists Three New Ethereum Tokens With More on the Way (Cryptobriefing)
- US Government Now a Bitcoin Whale Thanks to $1 Billion Silk Road Seizure (Cryptobriefing)
- Lightning Operators Are Bracing for a BTC Bull Run (Coindesk)
- Ledger owners lose 1.1 million XRP to scam site (Cointelegraph)
_______________________________________________________________________
Technical analysis
_______________________________________________________________________
Bitcoin
The largest cryptocurrency by market capitalization has surged past the $15,000 psychological resistance and entered the zone last seen in Jan 2018, right before the BTC crash. Bitcoin scored double-digit gains on the day and destroyed the $14,640 resistance on the way, turning it into support. While it is currently slowing down as it is approaching $16,000, many analysts call for $17,000 before a pullback.
Traders should wait for Bitcoin to start pulling back if they want a safer trade, or they can ride the wave whenever Bitcoin’s price spikes if they are quick on their feet to enter and leave the trade.
BTC/USD 4-hour Chart
Bitcoin’s technicals are extremely bullish on all time-frames, and no time-frame is showing any signs of bearishness or neutrality.
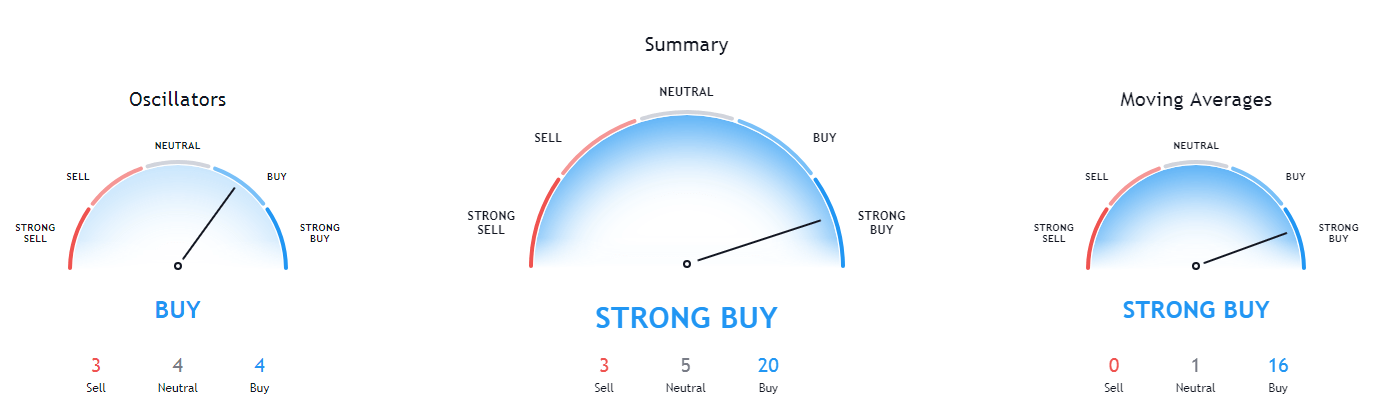
BTC/USD 1-day Technicals
Technical factors (4-hour Chart):
- Price is well above both its 50-period EMA and its 21-period EMA
- Price is at its top Bollinger band
- RSI is heavily in the overbought zone (79.75)
- Volume is elevated
Key levels to the upside Key levels to the downside
1: $15,420 1: $14,640
2: $16,665 2: $14,100
3: $17,260 3: $13,900
Ethereum

Ethereum has, due to Bitcoin pulling it up as well as due to the hype created around its 2.0 version coming out, surged and almost scored a double-digit gain on the day. The second-largest cryptocurrency by market cap has established itself back in the ascending channel after briefly dropping out of it. However, that wasn’t enough for the Ethereum bulls as they tried to push its price above the channel completely.
As the upper channel line held amazingly and stopped Ethereum’s rise, we can conclude that (unless Bitcoin doesn’t have any extreme surges), Ethereum traders can safely trade within a range bound by the ascending channel.
ETH/USD 4-hour Chart
Ethereum’s technicals are somewhat neutral on the 4-hour and daily time-frames, while its longer time-frames show a heavy tilt towards the buy-side.
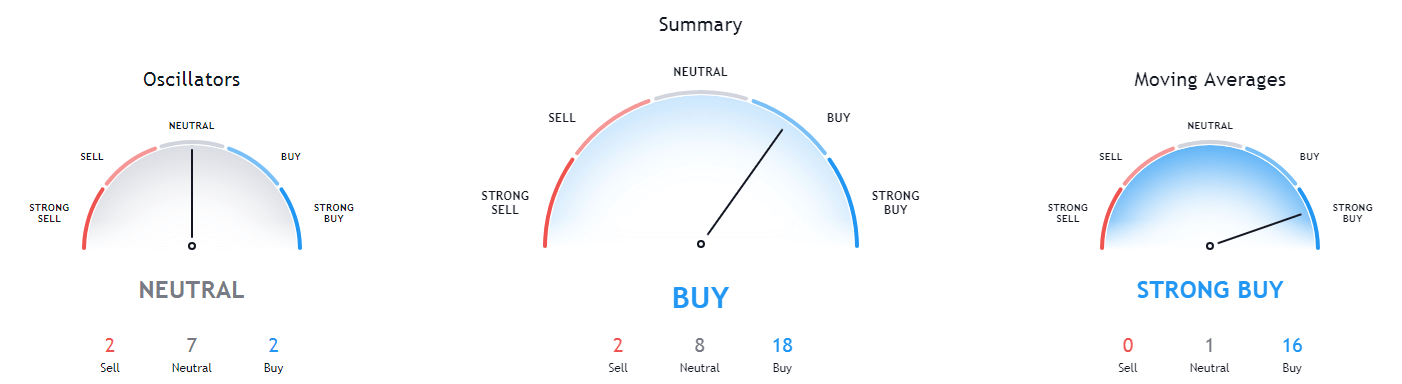
ETH/USD 1-day Technicals
Technical Factors (4-hour Chart):
- The price is well above both its 50-period and its 21-period EMA
- Price is at its top Bollinger band
- RSI is extremely overbought (78.03)
- Volume is elevated
Key levels to the upside Key levels to the downside
1: $445 1: $420
2: $451 2: $415
3: $490 3: $400
Ripple
As we predicted in our previous article, the fourth-largest cryptocurrency by market cap has broken the triangle formation that was forming from Nov 3. The price has sparked up by Bitcoin’s push towards the upside, moved to the upside as well, reaching past the $0.2454 resistance level and up towards $0.25.
One thing to note is that, while XRP has managed to break $0.2454, it needs to confirm its position above it in order to be safe in the short-term.
XRP/USD 4-hour Chart
XRP’s technicals on the 4-hour, daily, and weekly chart are slightly tilted towards the buy-side but are not completely bullish. Its monthly overview, however, is tilted towards the sell-side.
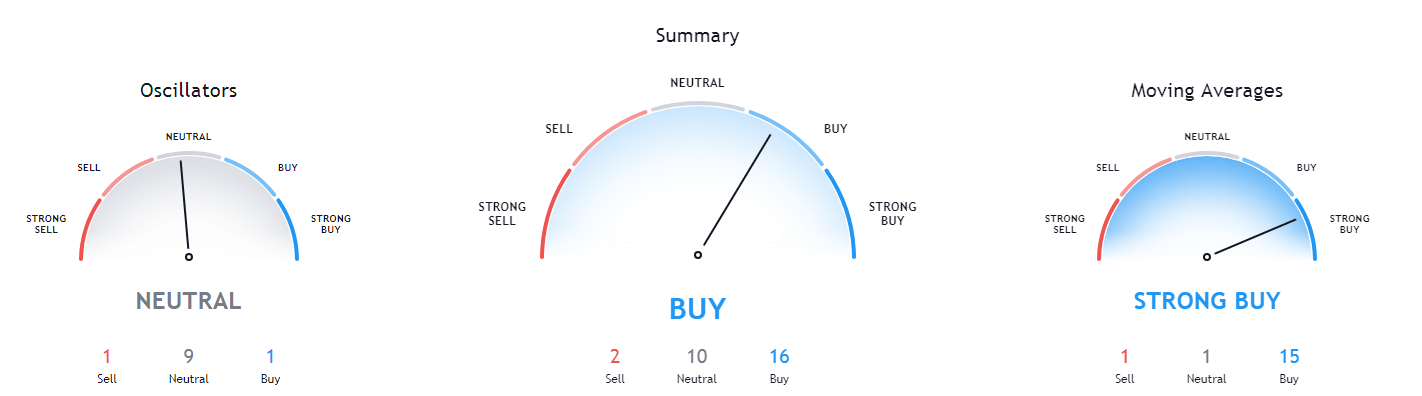
XRP/USD 1-day Technicals
Technical factors (4-hour Chart):
- The price is well above its 50-period EMA and its 21-period EMA
- Price at its top Bollinger band
- RSI is on the verge of being overbought (68.49)
- Volume is elevated
Key levels to the upside Key levels to the downside
1: $0.26 1: $0.2454
2: $0.266 2: $0.235
3: $0.27 3: $0.227
Related posts
 Daily Crypto Review, July 2 – Paypal Using Crypto? Bitcoin Preparing For a Move
 Daily Crypto Review, July 6 – Cryptos Skyrocket on Increased Volume; Bitcoin vs. the S&P 500
 Daily Crypto Review, Oct 28 – Bitcoin Rushing Towards $14,000; Over 50% of US Investors Interested in Crypto
 Daily Crypto Review, Nov 16 – Bitcoin to be Censored? Blockseer Mining Pool Enters the Game