
The cryptocurrency market had a day where almost no cryptocurrencies ended up in the red. Even though the gains were mostly small, only five cryptocurrencies lost in the past 24 hours. Bitcoin is currently trading for $11,582, which represents an increase of 1.88% on the day. Meanwhile, Ethereum gained 4.37% on the day, while XRP gained 1.11%.
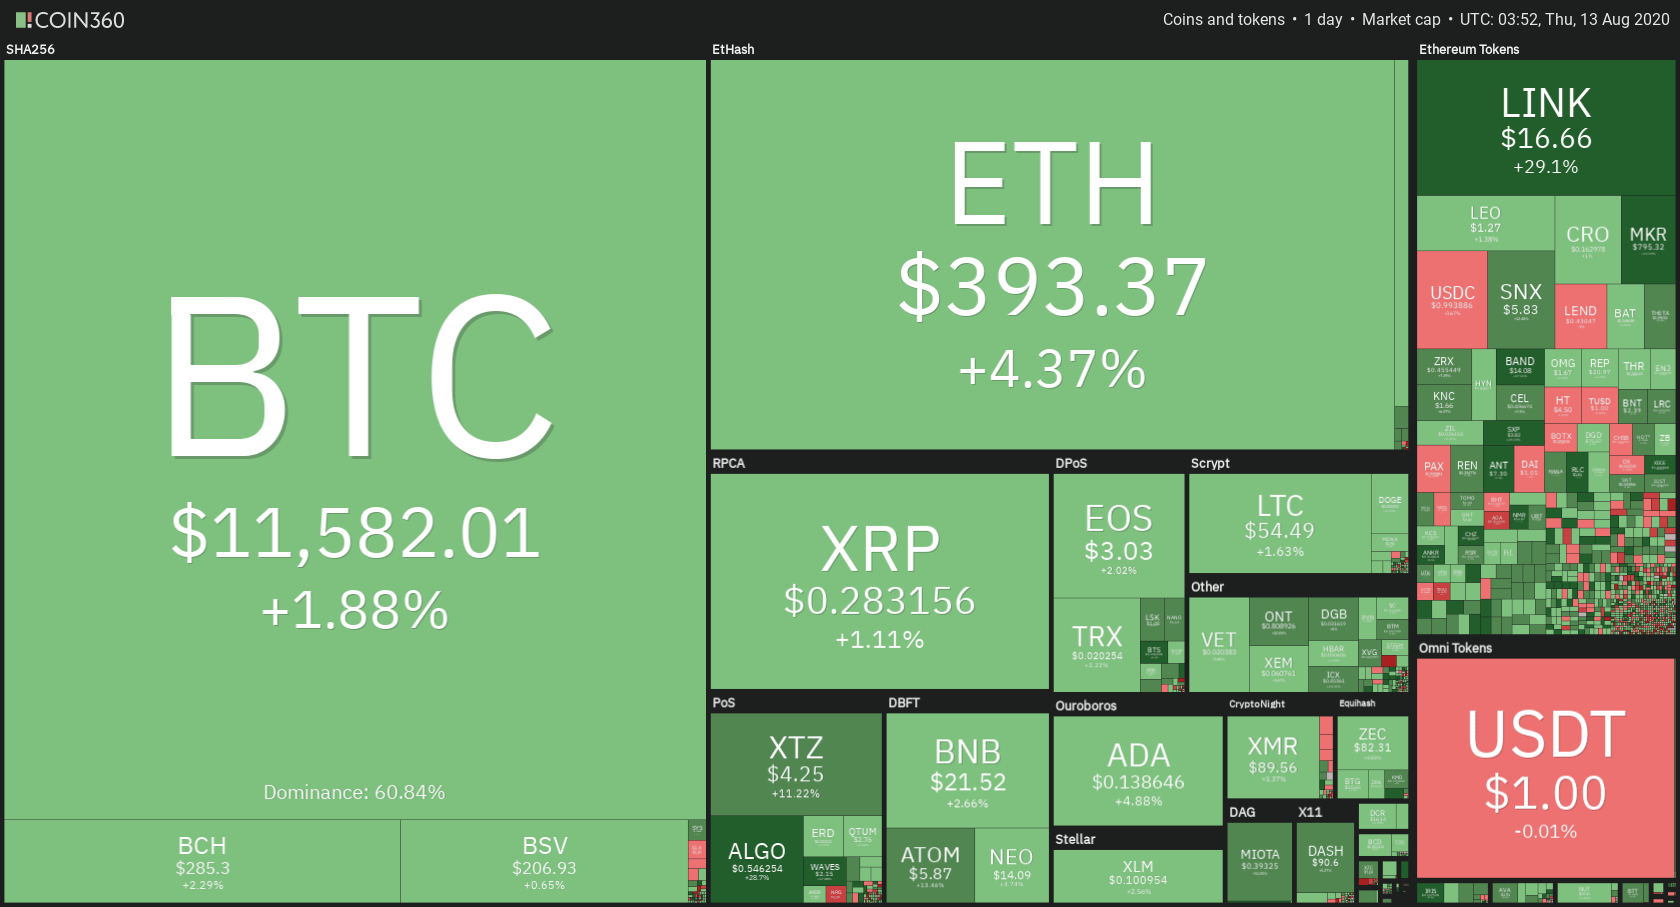
Daily Crypto Sector Heat Map
When talking about top100 cryptocurrencies, Numeraire gained 161.01% on the day, making it the most prominent daily gainer. Aragon (90.43%) and BitShares (41.67%) also did great. On the other hand, Divi lost 4.38%, making it the most prominent daily loser. It is followed by Compound’s loss of 2.5% and Aave’s loss of 1.85%.
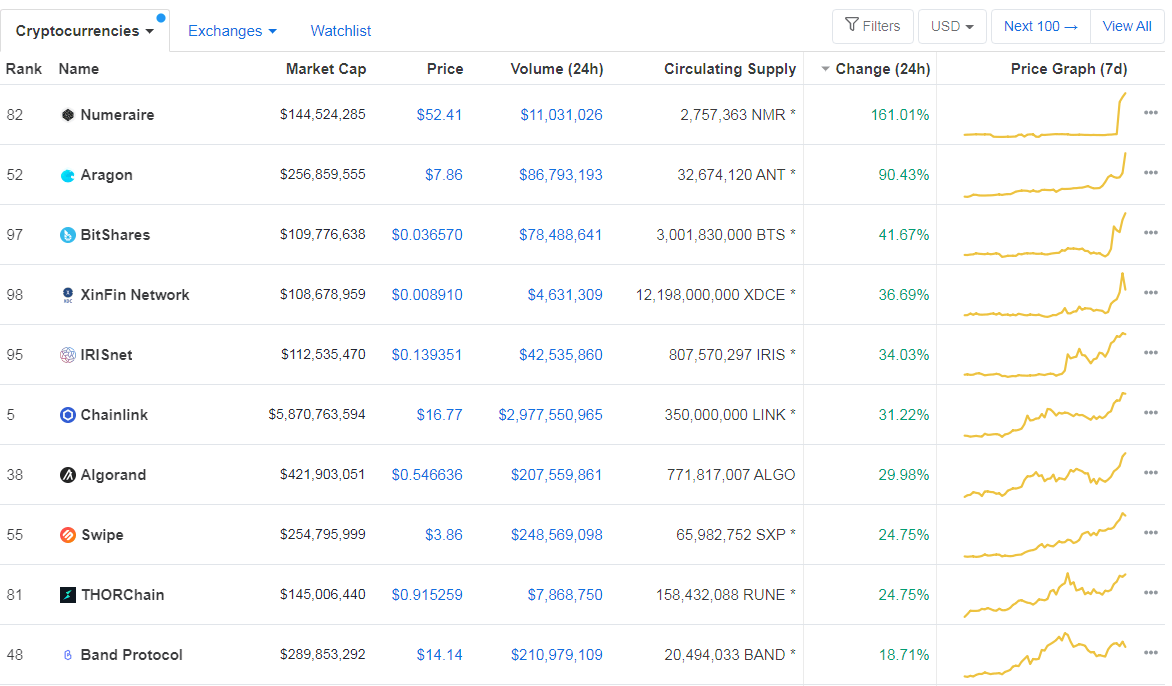
Top 10 24-hour Performers (Click to enlarge)
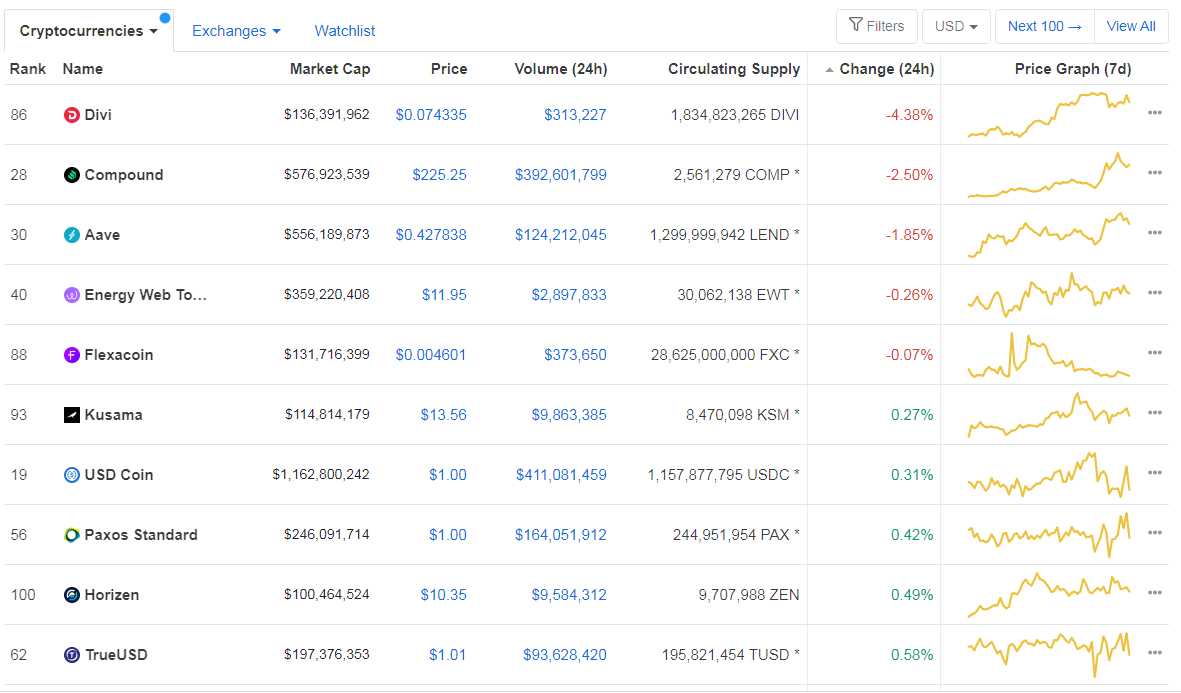
Bottom 10 24-hour Performers (Click to enlarge)
Bitcoin’s dominance level has decreased slightly since we last reported, with its value currently at 60.84%. This value represents a 0.53% difference to the downside when compared to yesterday’s value.
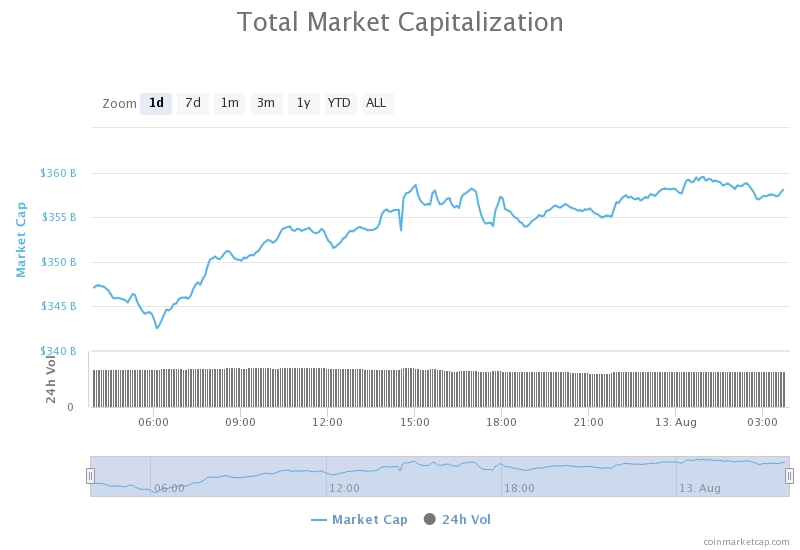
Daily Crypto Market Cap Chart
The cryptocurrency market cap experienced a major increase in value since we last reported. Its current value is $358.92 billion, which represents an increase of $13.32 billion when compared to yesterday’s value.
_______________________________________________________________________
What happened in the past 24 hours?
_______________________________________________________________________
- Uniswap’s August Volume Topples July $1.76B Record in Less Than Two Weeks (Coindesk)
- American software firm buys up $250 million in Bitcoin, stock jumps 10% (Cryptoslate)
- No Audits, No Problem: DeFi Stablecoin YAM Attracts Over $100 Million (Cryptobriefing)
- JPMorgan plans to lead ConsenSys’ $50m convertible note raise (The Block)
- Coinbase is set to enter the lending space this fall, will enable cash loans for bitcoin collateral (The Block)
- IEX co-founder Ronan Ryan on why bitcoin exchanges will eventually charge for market data (The Block)
- Square is reportedly testing short-term loans via Cash App (The Block)
- Bitcoin, gold bounce following bullion’s biggest single-day decline in 7 years (The Block)
- Crypto Exchange Bitfinex Back Online After 5-Hour Outage (Cointelegraph)
- Ethereum Network Hashrate Hits 20-Month High as DeFi Tokens Rally (Cointelegraph)
_______________________________________________________________________
Technical analysis
_______________________________________________________________________
Bitcoin
After a day of sharp decline, Bitcoin spent the day trying to restore the lost value. However, while the largest cryptocurrency by market cap did gain a few percent and rose to $11,600 levels, the $11,630 resistance seems to be holding the price in place quite well. Bitcoin will need to pass this level confidently (and soon), or BTC bears will consider this the start of a bear move.
BTC traders should look for an opportunity when BTC crosses $11,630.
BTC/USD 4-hour Chart
Technical factors:
- Price is currently below its 50-period EMA but above its 21-period EMA
- Price is slightly above its middle B.B
- RSI is neutral (48.49)
- Volume is decreasing
Key levels to the upside Key levels to the downside
1: $11,630 1: $11,460
2: $12,000 2: $11,090
3: $12,300 3: $10,850
Ethereum
Ethereum had a slightly better day than its rival Bitcoin in terms of gains, as it returned to the level it was on the night before the selloff. However, the $400 level seems like it has great resistance, and it is yet unknown whether ETH will be able to break it. The move that will break $400 needs to be extremely strong, and it will most likely be caused by BTC’s move to the upside.
Traders should look for an opportunity when Ethereum breaks $400 or collapses after failing to do so.
ETH/USD 4-hour Chart
Technical Factors:
- Price is above its 21-period EMA and its 50-period EMA
- Price is between its middle and top B.B.
- RSI is elevated (58.91)
- Volume is average
Key levels to the upside Key levels to the downside
1: $400 1: $361
2: $415 2: $340
3: $496 3: $302
Ripple
Unlike Bitcoin and Ethereum, XRP did not have such a good day today. The third-largest cryptocurrency by market cap did end up in the green on the day, but it failed to break the $0.285 level. Breaking this level is key to pushing further towards the upside, but the 21-period and 50-period moving average are also above the price and very near $0.285, making it incredibly difficult for XRP to move towards the upside.
Traders can look for an opportunity right after XRP breaks $0.285.
XRP/USD 4-hour Chart
Technical factors:
- Price is below its 21-period and 50-period EMA
- Price is slightly below its B.B.
- RSI is neutral (42.19)
- Low volume
Key levels to the upside Key levels to the downside
1: $0.285 1: $0.266
2: $0.31 2: $0.245
3: $0.32 3: $0.235
Related posts
 Daily Crypto Review, Sept 21 – Crypto Market is Preparing For a Bearish Move; UNI Token Booming
 Daily Crypto Review, Sept 24 – Bitcoin Following Gold: $9,300 On The Horizon
 Daily Crypto Review, Oct 22 – PayPal to Enable its Users to Buy and Sell Crypto; Bitcoin Skyrockets to $13,000 as a Response
 Daily Crypto Review, Oct 27 – Bitcoin Preparing For a Retracement; XRP Tumbles on the Daily
One reply on “Daily Crypto Review, August 13 – Crypto Loans Entering the Market; Bitcoin Temporarily Stuck at $11,600”
bitcoin consolidating