Categories
Forex Price Action

An Interesting Fact about Equidistant Channel

In today’s lesson, we are going to demonstrate an example of the formation of an up-trending equidistant channel. Usually, the price forms an up-trending equidistant channel by having two bounces and one rejection. However, the price sometimes determines the upper band first by having two rejections. In today’s lesson, this is what we are going to demonstrate.

The chart shows that the price makes a bullish move and produces a bearish engulfing candle. The last candle in the chart comes out as a doji candle with a long lower shadow. It suggests that the price finds a strong level of support in the minor charts.
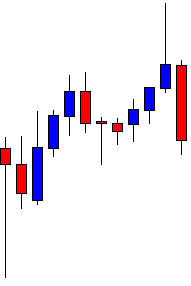
The price heads towards the North and has a strong rejection. The last candle comes out as a bearish engulfing candle again. A candle with a long upper shadow followed by a bearish engulfing candle may drive the price towards the South.
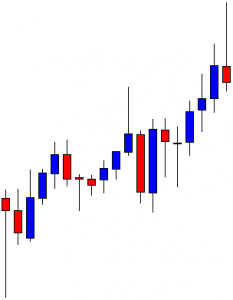
It does not. It produces a bullish engulfing candle and pushes the price towards the North. The chart produces an inverted hammer. The long upper shadow suggests that the price has a rejection from a strong level of support. So far, we have noticed that the price is up-trending by making new higher highs. Do you notice anything else? Let us proceed.

After making a bearish correction, the price finds its support. It produces a bullish engulfing candle and pushes the price towards the North. The last candle comes out as a bullish candle with a long upper shadow though. It is more evident now that the price is up-trending by obeying an equidistant channel.
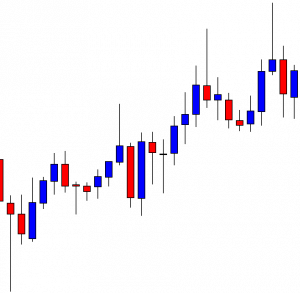
Upon finding its support, it produces a bullish inside bar. It seems that the buyers based on the equidistant channel may go long in the pair. We have not drawn the channel yet. The reason is we have to be able to spot out the channel by looking at the price action. Let us now draw an equidistant channel and see how the price has been obeying it.
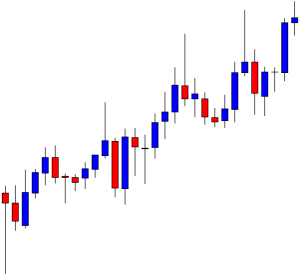
It looks like a copybook equidistant channel. It offers two good long entries. Do you notice one thing here? The price gives a clear sign that it may form an up-trending equidistant channel at the very outset. When it has its second rejection, it does not trend from the lower band. However, it determines its upper band, which helps traders sniff about a potential up trending equidistant channel. This is what happens so often. The price may determine its upper band first not by bouncing off at the lower band or it may determine its lower band by not having rejection from the upper band.

Categories
Forex Price Action

Equidistant Channel: An Excellent Price Action Trading Tool

In today’s lesson, we are going to demonstrate a trade setup with Equidistant Channel. Price action traders rely on Equidistant Channel a lot. It is one of the best price action trading tools. However, Forex traders’ life is not as easy as it seems. Like other trading tools, Equidistant Channel needs adjustment. To be able to do that traders need enough knowledge and experience. Let us now proceed to find out what a trader may need to do to make it work for him.

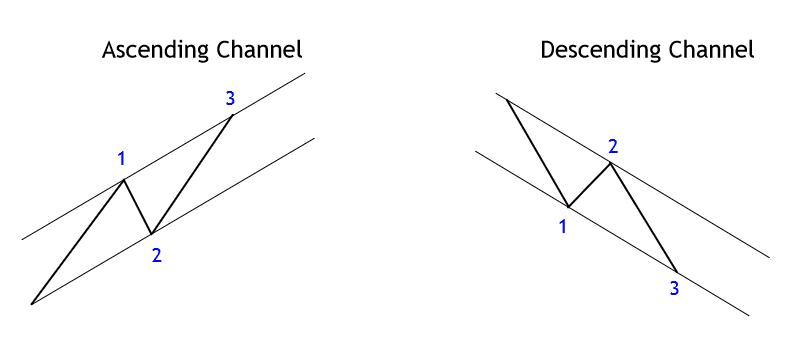
To draw the equidistant channel, we need to find out at least four points. Two swing highs and two swing lows are the best combinations. It works with three swing highs and one swing low or vice versa. In the chart above, we have two swing highs and two swing lows. In naked eyes, it seems that we will be able to draw an equidistant channel here.

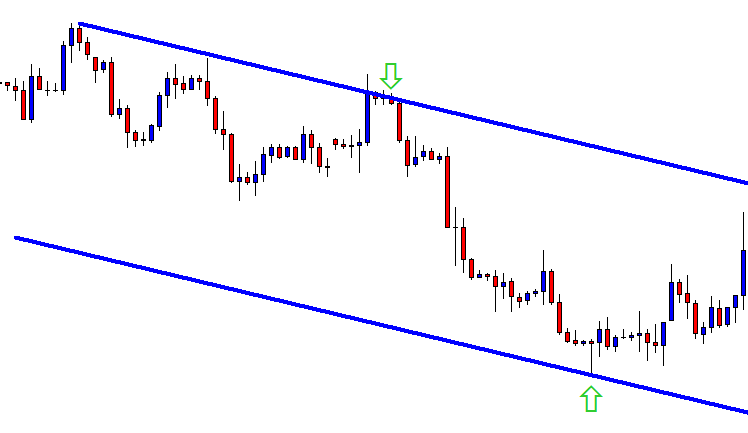
We have drawn an equidistant channel. The price is now at the resistance. Some traders go long from here. Ideally, to get a good risk-reward, traders should wait for the price to go at the level of resistance and produce a bearish reversal candle to go short in the pair. Let us find out what happens next.

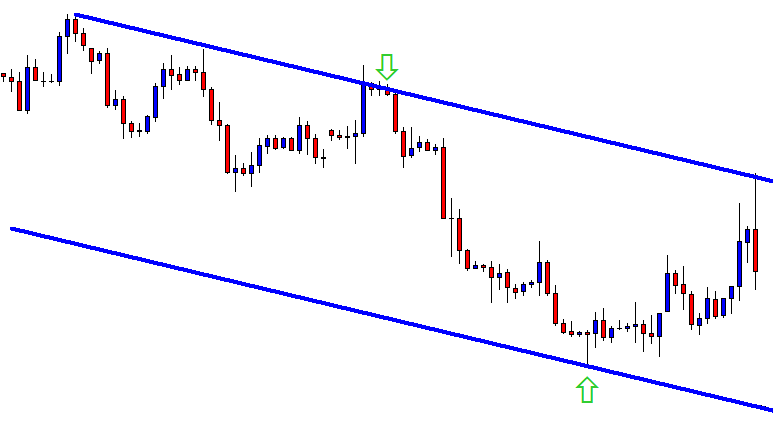
The chart does not produce a bearish reversal candle. It breaches the level instead. It means this is not a valid equidistant channel anymore. The sellers must be disappointed. What do you think is there any twist in the tail?

The chart makes the new lowest low. It gives three swing highs and one swing low. It means we can draw another equidistant channel. Look at the above chart where the price getting a bounce at the level of support. The price again heads towards the North. Traders may wait for the price to get a rejection at the level of resistance and produce a bearish reversal candle to go short in the pair again.

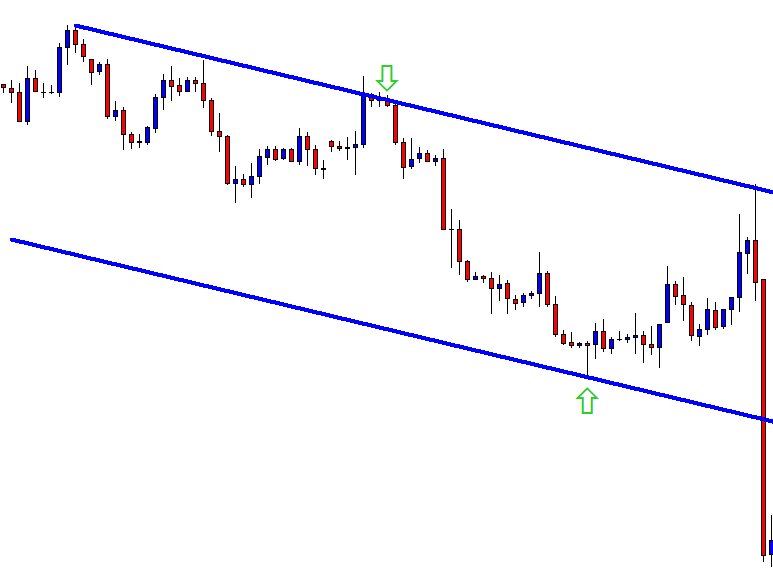
Here it comes. The level of resistance produces a bearish engulfing candle right at the level of resistance. Traders may trigger a short entry right after the last candle closes. To set take profit, they may use the level of equidistant support. The price often keeps going down with a down-trending equidistant channel. However, the best practice is closing down the trade at the first bounce in case of down-trending equidistant channel trading. Let us find out how the trade goes.

The price hits take profit level like a rocket. Some may regret that they should hold the position and close it manually. Do not forget the rule of sticking with the rule in forex trading. We have seen that the chart does not produce a signal on the first occasion. It rather breaches and lets traders draw another equidistant channel. Yes, it does offer an excellent entry for the sellers too.