Introduction
In 1978, J. Welles Wilder Jr published the Relative Strength Index (RSI) in the book “New Concepts in Technical Trading Systems.” Wilder describes the RSI as “a tool which can add a new dimension to chart interpretation.” Some of these interpretations are tops and bottoms identification, divergences, failure swings, support and resistance, and chart formations.
The Relative Strength Index is probably the most popular indicator used by professional and retail traders. It’s an oscillator which moves in a range between 0 to 100. A. Elder describes the RSI as a “leading or coincident indicator – never laggard.” In this article, we will show these different ways to use the RSI.
Tops and Bottoms Identification
The theory about this indicator states: “when the RSI goes above 70 or below 30, the Index will usually top or bottom out, before the real market top or bottom, providing evidence that a reversal or at least an important reaction is imminent”. Some traders have modified these levels to 80 – 20.
The basic trading idea is:
- Buy zone: when the RSI is below the 30 (or 20) level.
- Sell zone: when the RSI is above the 70 (or 80) level.
A trading system based on this interpretation is an easy way to lose money. The following example shows what I mean:

Figure 1: Tops and Bottoms signals
Source: Personal Collection
In figure 1, an example of a trading system based on Top and Bottoms is shown, with RSI levels of 30 and 70 (or 20 and 80) as entry signals. To make it short, most of the time the entry signals were false and didn’t allow catching significant trends.
Divergences are the most popular use; Wilder describes the divergence between price movement and RSI as a “very strong indication that the market turning point is imminent.” Divergence takes place when the price is increasing, and the RSI is flat or decreasing (this is known as bearish divergence); the opposite case happens when the price is decreasing, and the RSI is flat or increasing (bullish divergence).

Figure 2: Divergences
As shown in Figure 2, the divergences are a price weakening formation. That does not mean that it’s a turning point or that you should position yourself in the opposite direction.
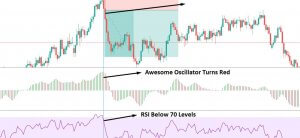
Failure Swing
LeBeau and Lucas describe Failure Swing as a formation “which is easier to observe in the RSI study itself than in the underlying chart.” A strong indication of market reversal occurs when the RSI climbs above the 30 level or plunges below the 70 level.

Figure 3: Failure Swing
As we can see in figure 3, the failure swing is part of the divergence concept, and it only confirms that the divergence is real. But you must pay attention and be careful with the failure swing as an entry signal because it is not a rule. The potential trade requires price-action confirmation.
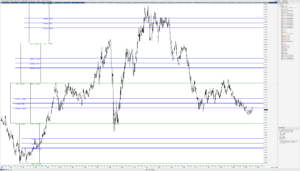
Support and Resistance
The theory says that “support and resistance often show up clearly on the RSI before becoming apparent on the bar chart.” Some authors use the 50 level as a support level in a bullish trend or as resistance in a bearish trend. Hayden proposes the following rules for each trend direction:
- In a bullish trend, the RSI will find support at 40 and resistance at 80.
- In a bearish trend, the RSI will find support at 20 and resistance at 60.

Figure 4: Support and Resistance.
In figure 4, the RSI shows how the RSI works as support and resistance on a bearish and a bullish trend. In the bearish trend, the 60-70’s zone is acting as resistance levels and 30-20’s zone as support. In a contrarian case, during the bullish trend, 70-80’s are the resistance zone, and 40-30’s the support zone.
Chart Formations
The RSI could display a pattern similar to those present in chart formations which may not be clear on the price chart, for example, triangles, pennants, breakouts, buy or sell points. A formation breakout indicates a move in the breakout direction.

Figure 5: Chart Formations
The most common formation is the triangle as a consolidation pattern before an explosive move. However, also is common to see false breakouts before the real move (see figure 5).
RSI chart formations breakout as a trading signal:
Buy Signal: When RSI breaks above its downtrend line place an order to buy above the latest price peak to catch the upside move.
Sell Signal: When RSI breaks below its uptrend line place an order to sell short below the latest price to catch a downside breakout.
We must consider that, usually, the RSI breaks its trendline one or two periods before price does. In this sense, it’s important to get a confirmation using price-action.
COMMENTARY
To summarize, the RSI is a popular indicator between professional and retail traders alike. It’s characterized by being a leading indicator. While every one of those styles (divergences, failure swing, support and resistance, and chart formations) can be used independently, that’s not a powerful tool.
A more reliable way to apply the RSI is using a mix of those methods, but the main issue here is how to trade using the RSI.
Some tips to use the RSI:
- Determine what is the primary trend? The “big picture” of the traded market.
- Identify key levels (swings), divergences, failure swings, chart formations between Price and RSI. In bear markets, wait for a resistance level (60-70’s zone). In bull markets, wait for support levels (40-30’s zone).
- Observe price and RSI breakouts.
- The order could be placed at the open of the candle, or when the price reaches a specific level (limit or stop orders).
- The stop-loss level could be set beyond the last swing high or low, or specific number of pips away.
- Profit-taking, ideally, should be set, at least, at two times the distance from the entry point to the stop-loss. Another possibility is to find a key level and set it close to it if the reward is worth its risk
- As trade management, the use of a trailing stop should be considered.
- If the market moves without us, let it go. The market will provide more opportunities.

Figure 6: Trading with the RSI (*)
Source: Personal Collection

Figure 7: Trading with the RSI (*)
Source: Personal Collection
As you can see figures 6 and 7, the RSI is an indicator that does much more than an identification of overbought and oversold price levels. It helps us detecting trade opportunities, areas of movement exhaustion, confirmation of price patterns (price level failures), and chart patterns. However, RSI signals and patterns should only be used as a guide. A relationship of those signals with the price action should always be present.
(*) This is a simulated analysis and trade application.
SUGGESTED READINGS
- Wilder, J.W. (1978). New Concepts in Technical Trading Systems. North Carolina: Trend Research.
- Hayden, J. (2004). RSI: The Complete Guide. South Carolina: Traders Press Inc.
- LeBeau, Ch., Lucas, D. (1991). Computer Analysis of the Futures Market. New York: McGraw-Hill.
- Elder, A. (2014). The New Trading for a Living. New Jersey: John Wiley & Sons, Inc.
Keywords:
Technical Indicators, RSI, Education.
©Forex.Academy