Introduction To Elliot Wave Theory
The Wave theory was discovered by Ralph Nelson Elliott during the 1930s, where he discovered that stock market movements could often be predicted by a series of trends movements and reversals. Elliott Wave theory is, therefore, a methodology which technical traders use to identify trade entry and exits.
These movements consist of impulsive waves, followed by corrective waves. An impulsive wave is usually composed of five sub-waves (1–2–3–4–5) that moves in the same direction as the trend. A corrective wave is composed of three sub-waves (A-B-C) that moves against the trend.
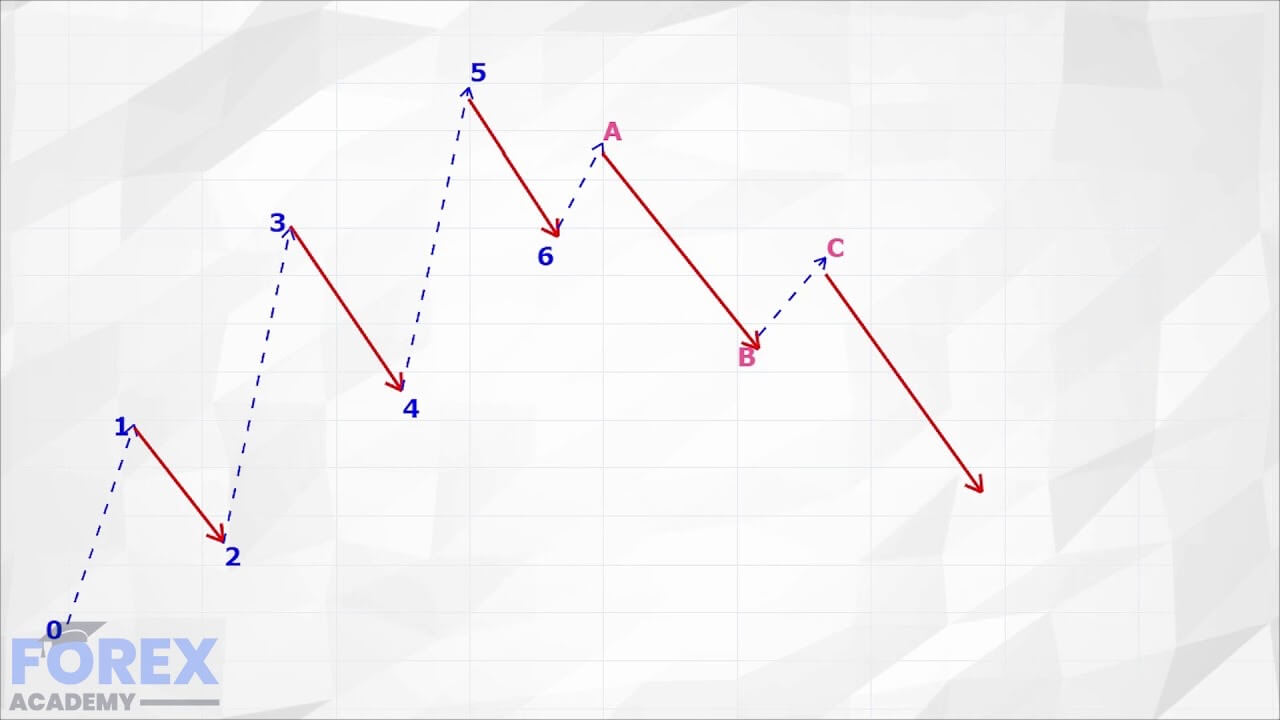
Let’s turn to example A:
In this example, we can see an Elliot Wave formation. We can see that price action moves from position 0 to position 1 (an impulse wave), with I pull back from position 1 to position 2 (a corrective wave) and where this move is less than 100% of the previous upward move. We subsequently see another impulse wave higher from position 2 to position 3, with I corrective wave, or pull back, from position 3 to position 4 and where this pullback was less than 100% of the move higher from position 2 to position 3. And where this process is continued from positions 4, 5. However, from position 5 we see our pull-back to position 6, but when the subsequent impulse wave higher fails to carry on the momentum above position 5 and fades at position A. We now have scope for an A, B, C corrective move lower.
Now let’s look at example B:
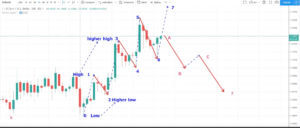
In this chart example of a 4 hour moving time frame of the EUR:USD pair, we can see that on the left-hand side of the charts – where I have denoted an X – price action seems to have bottomed out and then makes a move to the upside, as denoted by the candlesticks. We then see sidewards moving price action until the market reaches point 0. We then have a move up towards the top of the previous price action period in question before moving higher again and peaking at position 1, or the beginning of our impulse move. This had previously been a period of consolidation and where traders will have been waiting to enter trades on a possible breakout from this range, either upwards or downwards.
From position 1 price pulls back, or moves lower (a corrective wave), to position 2 and then moves higher to position 3, while breaking the ceiling above position 1, which was the end of the consolidation period. This shows momentum building to the upside and a possible bull trend forming. From here, we see a further corrective wave lower to 4, followed by a continuation higher to position 5 and where this price action has formed the basis of a classic Elliot Wave movement. This bull trend will be further confirmed if price action moves higher than where it is currently situated to reach position 7 ( the continuation of a Bull trend). However, if the price action stalls, traders may see a trend reversal forming and that would be a confirmation that the wave formation is dominating this move and where price action might move from its current position on the chart at A to a fall to position B, C and lower; a corrective wave.
Traders also read these moves as being sequences of highs and lows, such as a higher highs as shown by position 3 being a higher high than position 1, and where position 5 is a higher high than position 3. They also look for higher lows, such as position 2 being a higher low than position 0. The reverse terminology is used for downward trends.
It is also important to consider that these moves are all forms of stepping stones and can be seen by other technical charts as the result of being overbought or oversold or having reached significant areas, such as key round numbers that traders typically like to trade to and from.
Always remember that technical analysis is simply that: analysis! Technical traders mostly use indicators that form after price action movements have happened, and therefore, these indicators
typically lag behind the market. And while they can be very reliable in terms of establishing trends/patterns, they can never be 100% reliable due to the myriad of permutations going on in the Forex market at any particular given time. The absolute best indicator will always be the current exchange rate, AKA, as price action.