
The crypto sector ended up mostly in the red as altcoins started retracing after their moves to the upside. Bitcoin is currently trading for $35,776, representing a decrease of 2.1% compared to yesterday’s value. Meanwhile, Ethereum’s price has increased by 3.28% on the day, while LTC lost 3.44% of its value.
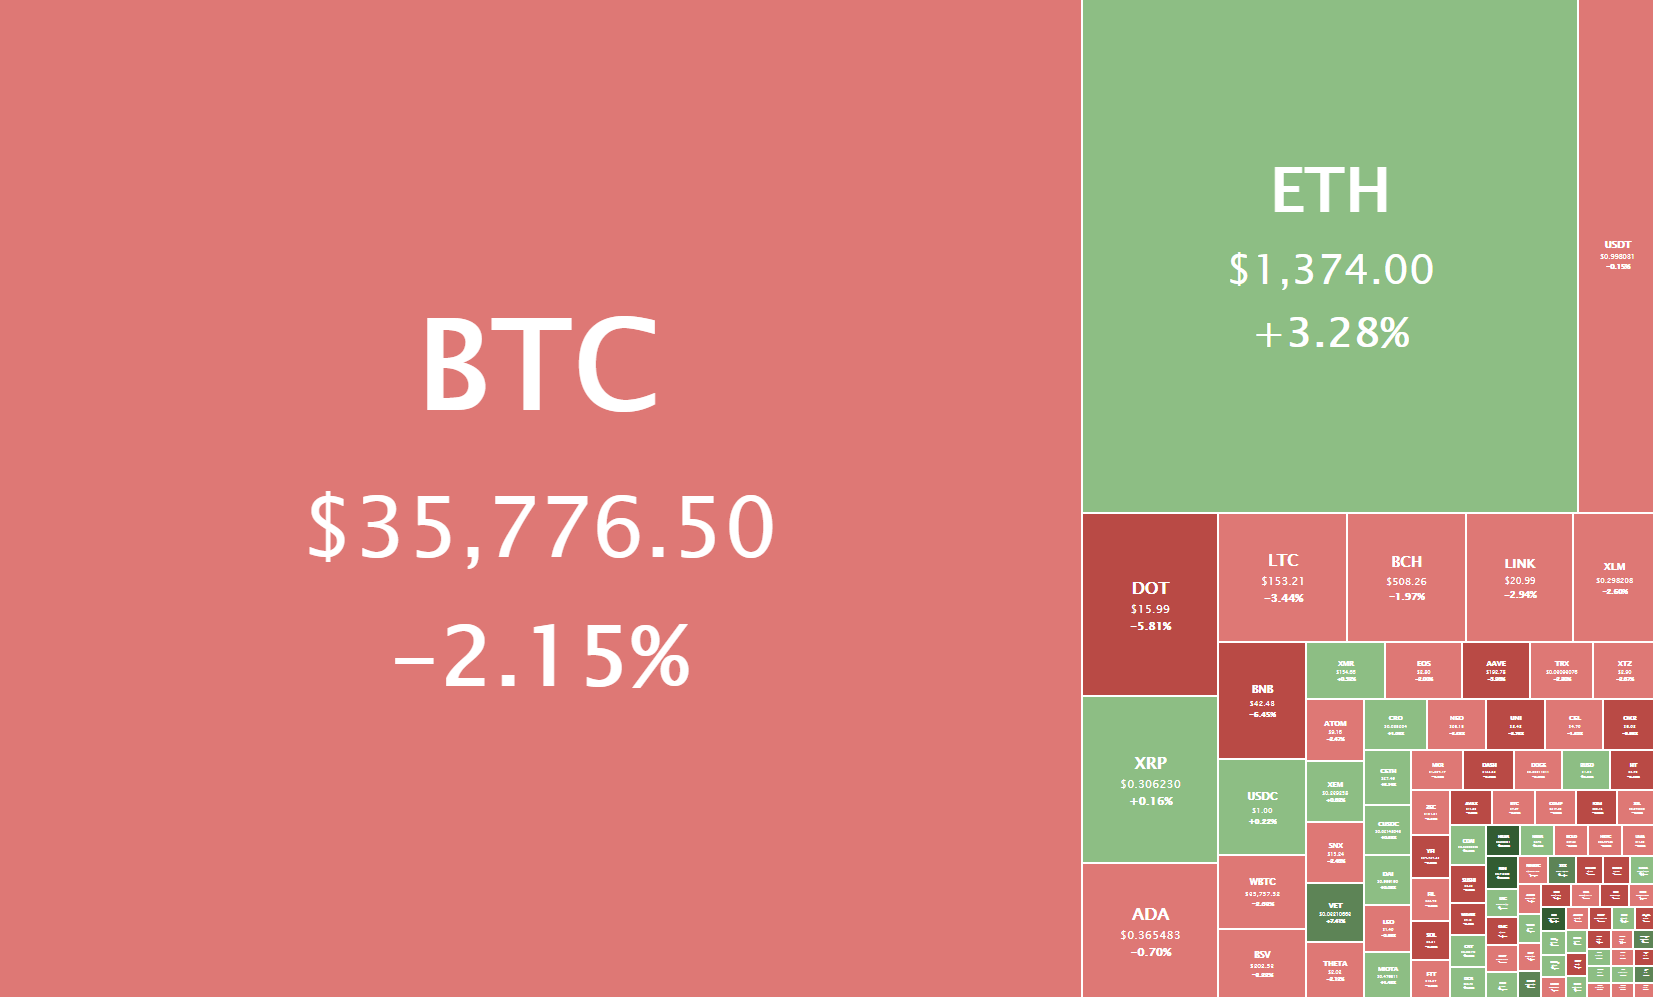
Daily Crypto Sector Heat Map
Folder Protocol gained 813.46% in the past 24 hours, making it the most prominent daily crypto gainer by far. It is followed by Global Gaming’s 198.29% and Benchmark Protocol’s 159.89% gain. On the other hand, 3XT TOKEN lost 85.20%, making it the most prominent daily loser. It is followed by Ether Kingdoms Token’s loss of 61.70% and Matrix AI Network’s loss of 52.48%.
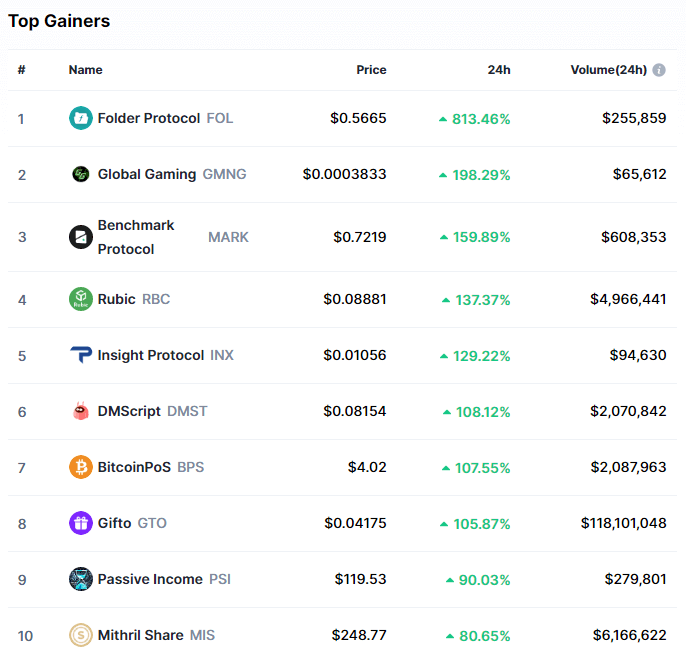
Top 10 24-hour Performers (Click to enlarge)
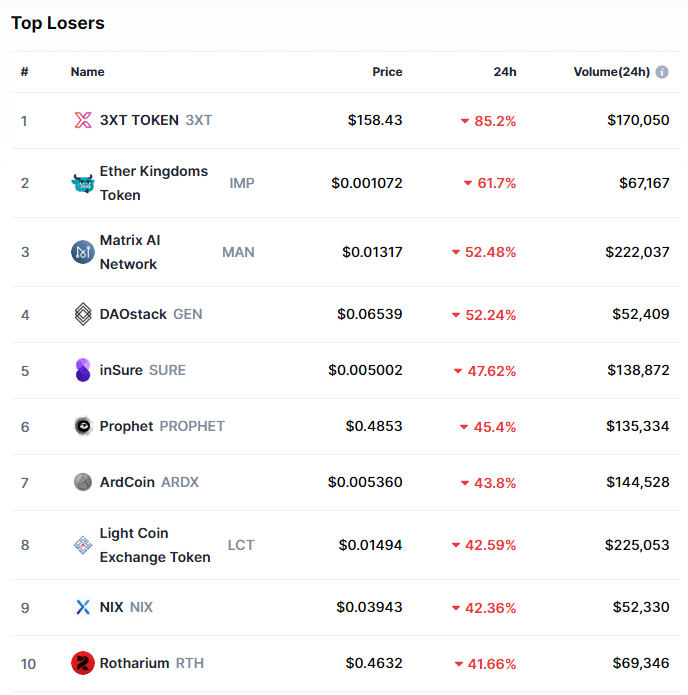
Bottom 10 24-hour Performers (Click to enlarge)
Bitcoin’s market dominance has moved down since our last report as altcoins started to outperform, with its value currently being 64.9%. This value represents a 0.7% difference to the downside when compared to the previously reported value.
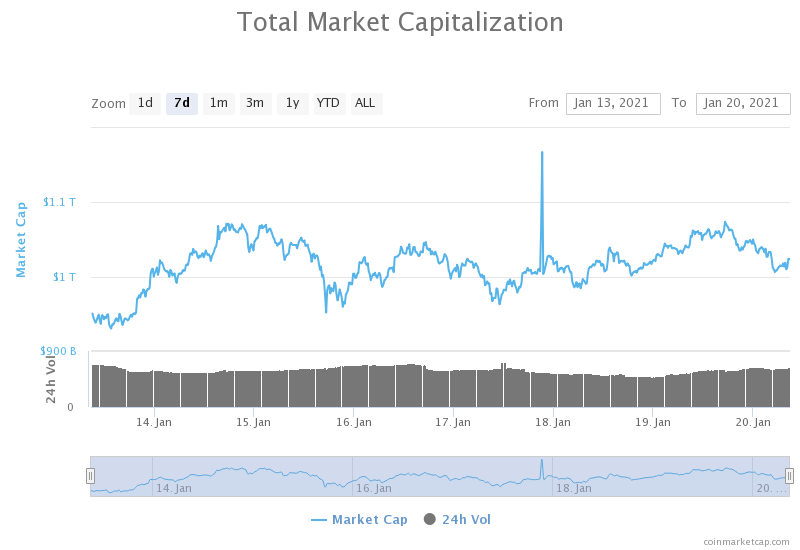
Weekly Crypto Market Cap Chart
The cryptocurrency sector’s market capitalization has decreased slightly since we last reported, with its current value being $1.024 trillion. This represents a $10 billion decrease when compared to our previous report.
_______________________________________________________________________
What happened in the past 24 hours?
_______________________________________________________________________
- Chainalysis: The share of crypto transactions associated with criminal activity fell dramatically in 2020 (The Block)
- Treasury secretary nominee Janet Yellen calls illicit use of cryptocurrency a ‘particular concern’ (The Block)
- Privacy-focused Brave becomes first browser to support IPFS (The Block)
- Binance removes $165 million worth of BNB from circulation in largest-ever token burn (The Block)
- Is Chainlink Centralized? A Breakdown of Token Distribution (Cryptobriefing)
- Curve Accuses Saddle Finance of Copying Its Algorithm (Cryptobriefing)
- Survey reveals how crypto users handle security after Ledger leak (Cryptoslate)
- Bullish? Grayscale bought $500 million worth of Bitcoin in a single day (Cryptoslate)
- Ethereum’s Ether Cryptocurrency Sets New All-Time Price High Near $1,440 (Coindesk)
- Bitcoin node count hits new all-time high (Cointelegraph)
_______________________________________________________________________
Technical analysis
_______________________________________________________________________
Bitcoin
Bitcoin’s daily time-frame shows us that the largest cryptocurrency by market cap is still contained within the triangle formation (purple). Any break of the current sideways movement may contest the triangle as well. On the other hand, BTC on the 1-hour time-frame is bouncing between the $34,627 support and the $37,445 resistance level for the past five days.
Bitcoin’s price will soon have to break the sideways trading pattern and contest the triangle formation. If BTC bulls or bears manage to break the triangle formation, we could see a large move in the same direction.
BTC/USD 1-hour chart
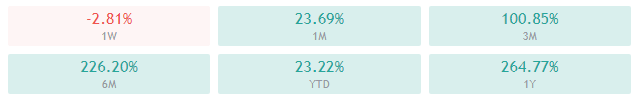
Bitcoin’s short-term (4-hour and daily) technicals are slightly tilted towards the sell-side but still show a hint of neutrality or bullishness. Its weekly and monthly technicals are exactly the opposite, as they are slightly bullish but show some bearishness alongside it.
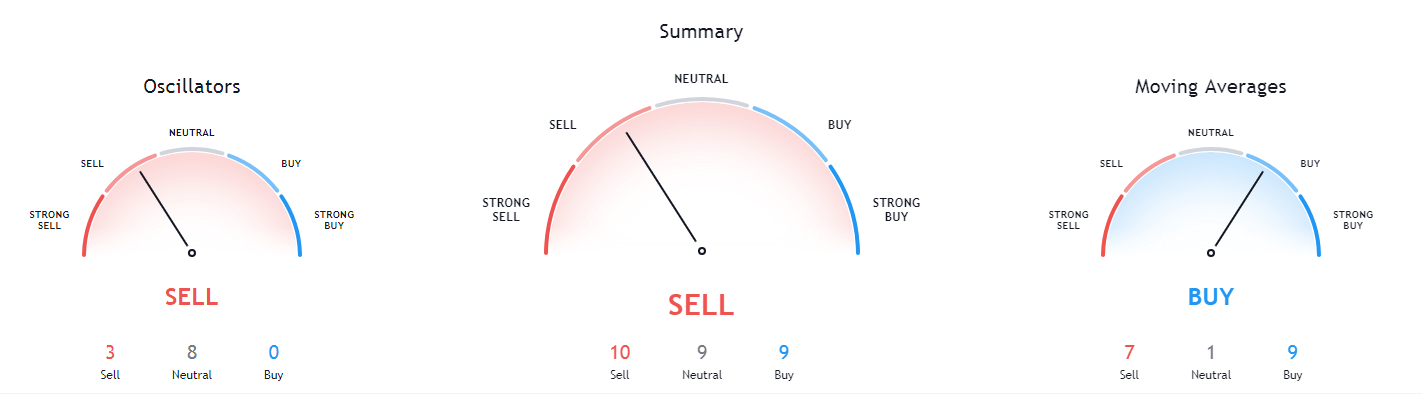
BTC/USD 1-day Technicals
Technical factors (1-hour Chart):
- Price is slightly below both its 50-period EMA and its 21-period EMA
- Price is slightly below its middle Bollinger band
- RSI is neutral (44.32)
- Volume is average (low)
Key levels to the upside: Key levels to the downside:
1: $37,445 1: $34,627
2: $40,000 2: $32,350
3: $42,000 3: $27,960
Ethereum
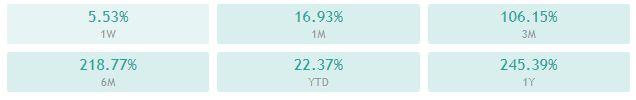
The second-largest cryptocurrency by market cap took advantage of the “altcoin season” as money moved from Bitcoin and onto other altcoins. Ever since Ether’s price bounced from the $1,211 level on Jan 18, we could see bulls coming to the market in larger numbers. This made the $1,350 level fall, and ETH finally set a new all-time high of $1,440. While the new ATH is just $20 away from its previous one, this is considered a testament to Ethereum’s upside potential.
Ether couldn’t position itself above the $1,420 (previous ATH) and fell below as it started retracing. Its price is now testing the $1,350 level but will most likely stay above it.
ETH/USD 1-hour Chart
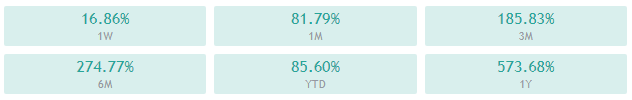
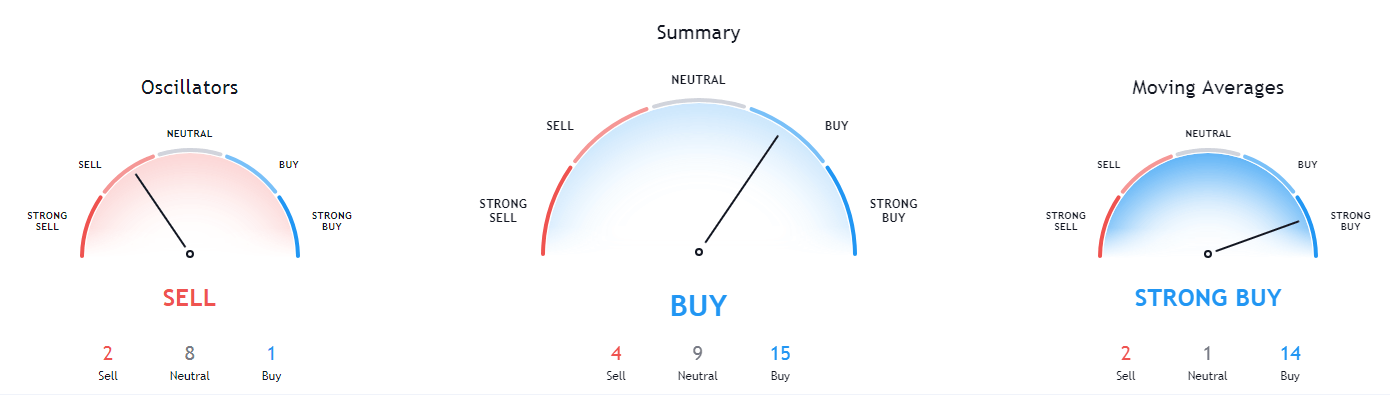
Ethereum’s technicals on all time-frames are tilted towards the buy-side, but all show a hint of bearishness in the oscillator department.
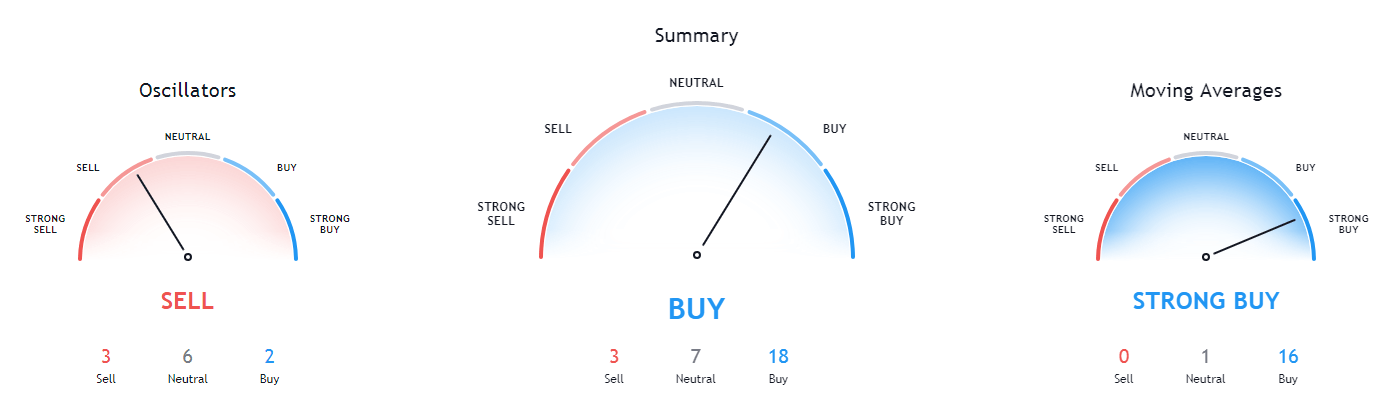
ETH/USD 1-day Technicals
Technical Factors (1-hour Chart):
- Price is above its 50-period and at its 21-period EMA
- Price is slightly below its middle Bollinger band
- RSI is neutral (50.69)
- Volume is above average
Key levels to the upside: Key levels to the downside:
1: $1,420 1: $1,350
2: $1,440 2: $1,211
3: $1,450 3: $1,183.85
Litecoin
Litecoin spent the day retracing from the recent $166.2 high after bulls reached exhaustion. LTC was trying to push towards the $180 levels and contest the 2021 highs but failed to do so as bulls spent too much strength in the $160 area, where the cryptocurrency faced heavy resistance.
Litecoin is now having a downward trajectory and has failed to break the 50-hour moving average in an attempt to break it. LTC traders may look for a trade after the cryptocurrency finishes testing the $142.1 level.
LTC/USD 1-hour Chart
Litecoin’s technicals on the 4-hour and monthly time-frames are completely bullish and show no neutrality or bearishness. On the other hand, its daily and weekly overviews show some form of bearishness.
LTC/USD 1-day Technicals
Technical factors (1-hour Chart):
- Its price is below both its 50-period EMA and its 21-period EMA
- Price sightly below its middle Bollinger band
- RSI is neutral (44.85)
- Volume is average
Key levels to the upside: Key levels to the downside:
1: $161.5 1: $142.1
2: $181.3 2: $128.42
3: $186.3 3: $114.75
Related posts
 Daily Crypto Review, Jan 12 – XLM Back in the top10 Cryptos by Market Cap; Crypto Sector in the Green
 Daily Crypto Review, Jan 15 – Bitcoin Retraces After Hitting $40k; Ethereum Contests $1.2k
 Daily Crypto Review, Jan 26 – Blood on the Streets: Crypto Market in the Red
 Daily Crypto Review, Jan 27 – Bitcoin (BTC), Ethereum (ETH), Litecoin (LTC) Price Analysis