
The crypto sector has experienced a rally that brought the market to its feed after yesterday’s dip. One of the best daily performers was Stellar Lumens (XLM), which shot up in the past week on great fundamentals (and once again today), gaining over 30% just a couple of hours, reentering the top10 cryptocurrencies by market cap.
Bitcoin is currently trading for $35,887, representing an increase of 1.28% compared to yesterday’s value. Meanwhile, Ethereum’s price has increased by 1.89% on the day, while LTC lost 1.85% of its value.
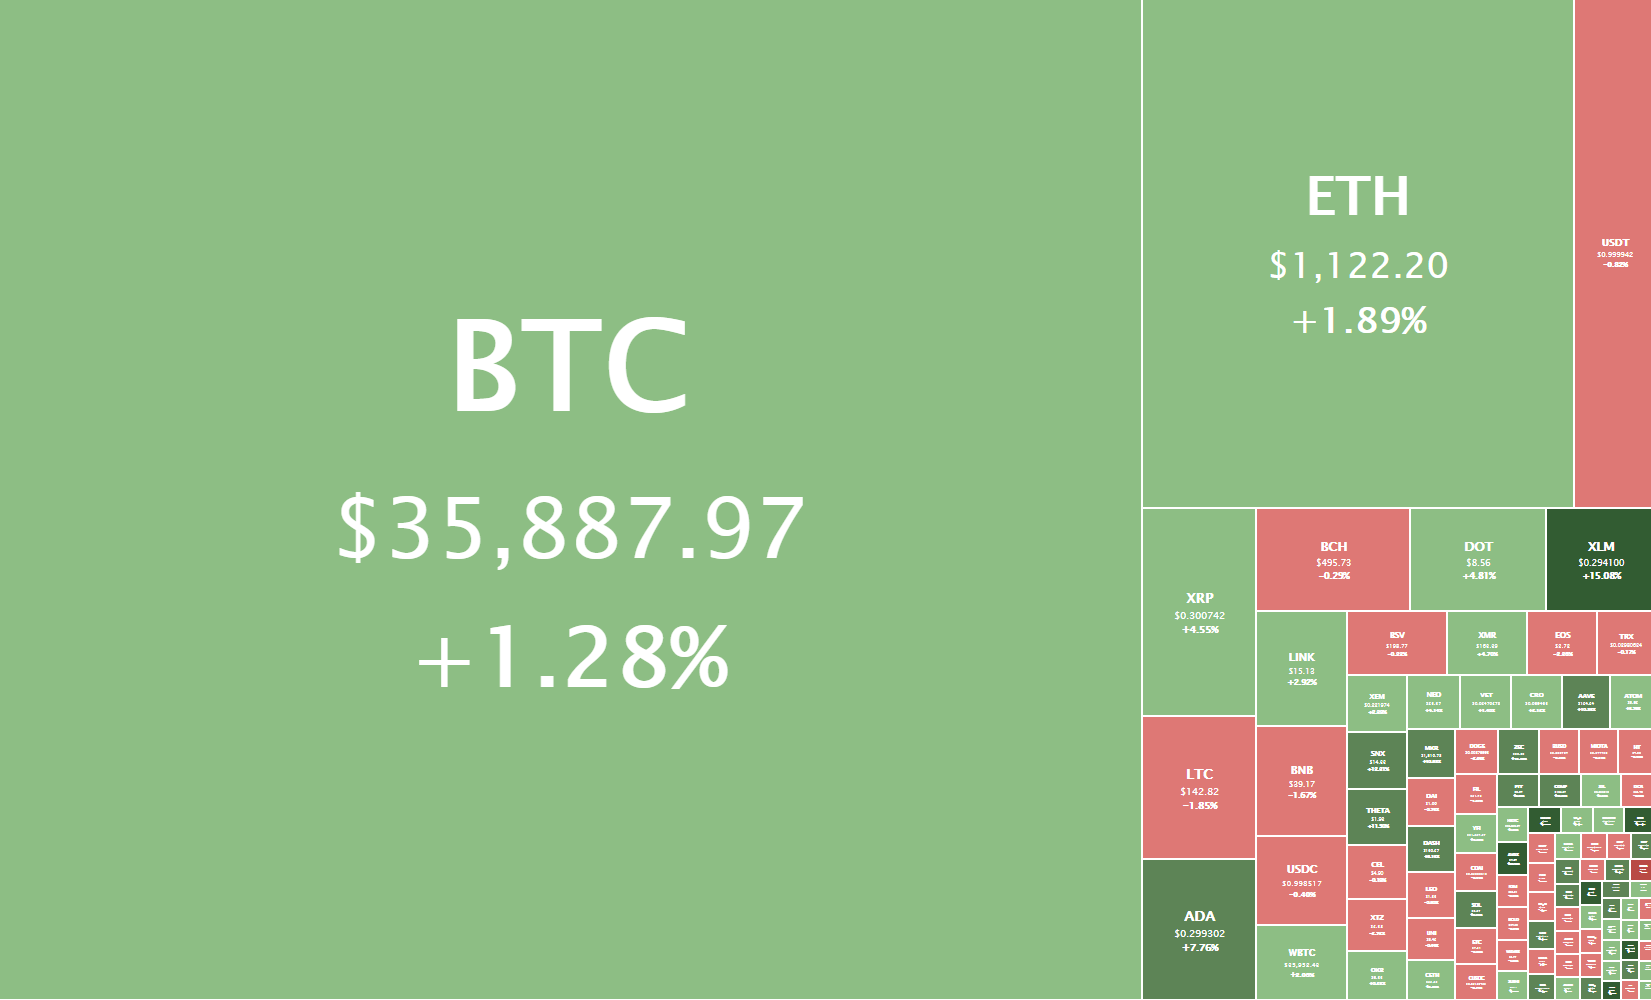
Daily Crypto Sector Heat Map
Amun Bitcoin 3x Daily Short gained 1186.87% in the past 24 hours, making it the most prominent daily crypto gainer by far. It is followed by PengolinCoin’s 366.58% and Firdaos’s 330.42% gain. On the other hand, Zugacoin lost 94.92%, making it the most prominent daily loser. It is followed by the True Segniorage Dollar’s loss of 85.08% and Zero Collateral Dai’s loss of 62.33%.
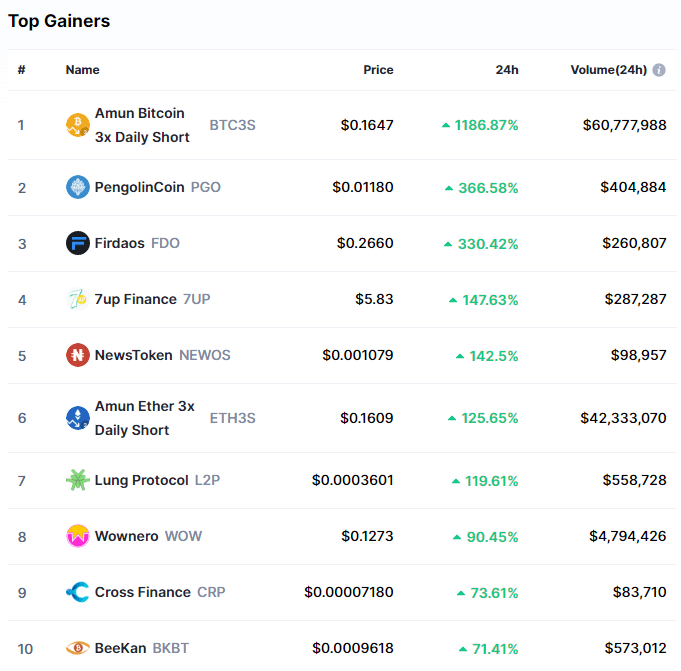
Top 10 24-hour Performers (Click to enlarge)
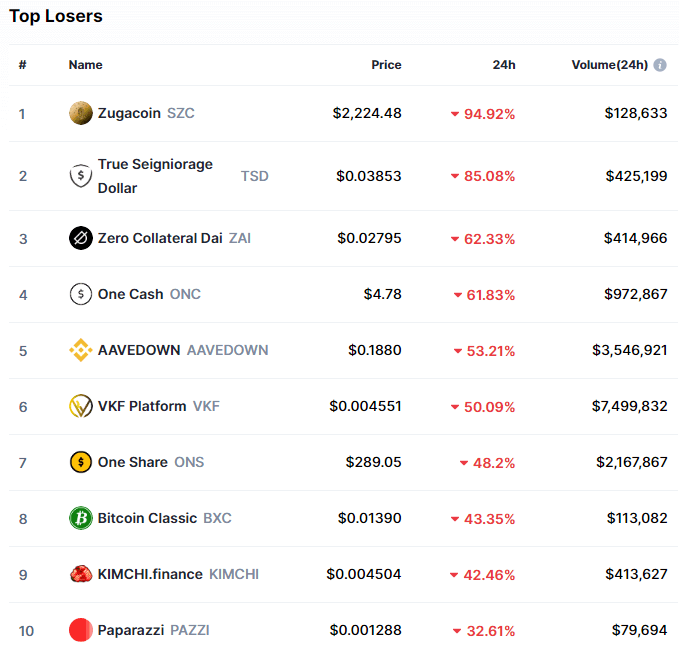
Bottom 10 24-hour Performers (Click to enlarge)
Bitcoin’s market dominance has moved up very slightly since our last report, with its value currently being 68.7%. This value represents a 0.1% difference to the upside than the value it had when we last reported.

Daily Crypto Market Cap Chart
The cryptocurrency sector’s capitalization has increased since we last reported, with its current value being $964.21 trillion. This represents a $58.14 billion increase when compared to our previous report.
_______________________________________________________________________
What happened in the past 24 hours?
_______________________________________________________________________
- UK regulator tells unregistered crypto firms to shut down (The Block)
- Kentucky lawmakers propose tax incentives to draw in bitcoin miners (The Block)
- Bitcoin hit ‘bubble territory’ after $20,000, says billionaire Jeffrey Gundlach (The Block)
- XRP Faces Prompt Recovery Despite Legal Uncertainty (Cryptobriefing)
- Ethereum Primed To Rebound Thanks to Whale Buyers (Cryptobriefing)
- Data shows Bitcoin sells are being scooped up by BTC whales (Cryptoslate)
- Eye-Popping Projection for $3T Crypto Market Underpins Bakkt Deal (Coindesk)
- Trader cries foul play as $30K Bitcoin price dip ends in biggest-ever daily recovery (Cointelegraph)
- XLM re-enters top-10 coins by market cap after surging nearly 30% (Cointelegraph)
- Analysts say Bitcoin price drop to $30K was ‘healthy and necessary’ (Cointelegraph)
_______________________________________________________________________
Technical analysis
_______________________________________________________________________
Bitcoin

Bitcoin managed to stop its descending move and push up slightly after pulling back to the $30,000 mark. The largest cryptocurrency by market cap has (on decreasing volume) seen a price increase to just below the $36,640 level. Many speculate that, while the drop was considered very healthy overall, the institutions bought even more BTC, which brought its price up without affecting the volume as much.
However, BTC/USD doesn’t seem like it currently has the strength to pass the $36,640 level, which may cause another downturn.
BTC/USD 1-hour chart
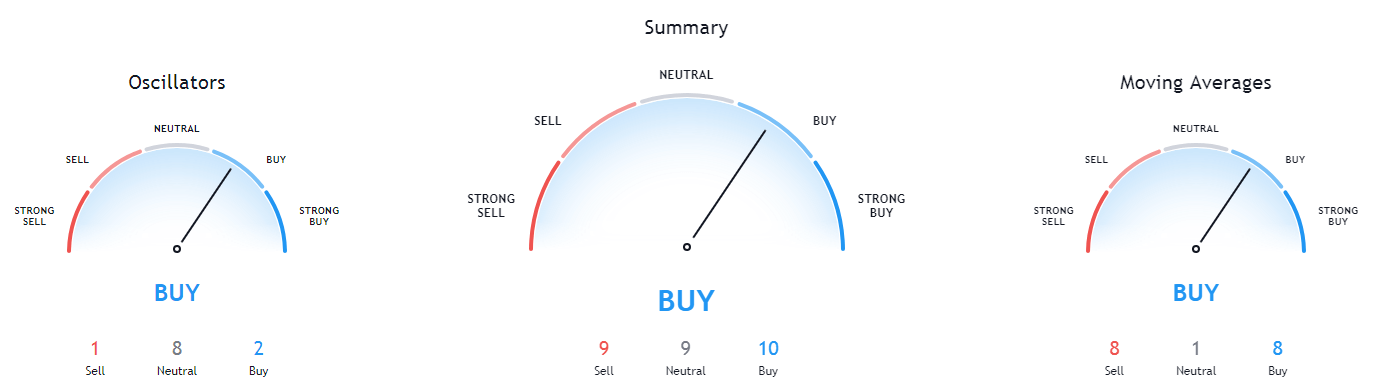
Bitcoin’s technicals on the daily and weekly time-frame are completely bullish. However, its monthly overview shows slightly less bullishness, while its 4-hour chart is completely bearish.
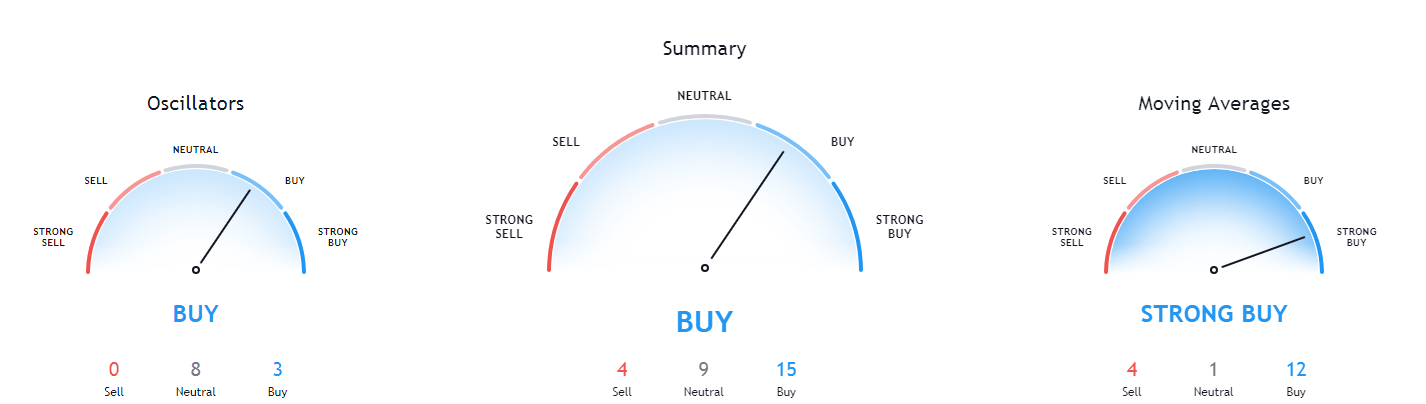
BTC/USD 1-day Technicals
Technical factors (1-hour Chart):
- Price is between its 50-period EMA and its 21-period EMA
- Price is near its middle Bollinger band
- RSI is neutral (54.63)
- Volume is descending to average
Key levels to the upside: Key levels to the downside:
1: $36,640 1: $33,200
2: $40,000 2: $30,640
3: $42,000 3: $27,960
Ethereum
Ethereum has once again matched Bitcoin in direction after hitting the $907 support level, and changed its price direction by pushing to the upside. The second-largest cryptocurrency by market cap is back at its peak from yesterday and seems like it cannot pass $1,129 with conviction at the moment.
Ethereum’s 21-hour and 50-hour moving averages play a major role and should be taken into account when looking for support or resistance levels.
ETH/USD 1-hour Chart
Ethereum’s technicals on the daily and weekly time-frame are completely bullish. However, its monthly overview shows slightly less bullishness, while its 4-hour chart is completely bearish.

ETH/USD 1-day Technicals
Technical Factors (1-hour Chart):
- Price is between its 50-period and its 21-period EMA
- Price is between its middle and top Bollinger band
- RSI is neutral (53.69)
- Volume is descending to average
Key levels to the upside: Key levels to the downside:
1: $1,129 1: $1,060.5
2: $1,211 2: $1,047.5
3: $1,226.5 3: $992
Litecoin

Even though Litecoin did follow Bitcoin’s price direction, it did so with less intensity, causing it to ultimately be in the red for the day. Its price is now at a major crossroads, as it is fighting for the $142.1 level. This pivot point will decide whether the price will immediately push towards the upside or downside.
Litecoin has created a strong resistance level near the $150 mark, and traders should pay great attention to it when trading.
LTC/USD 1-hour Chart
Litecoin’s technicals on the daily and monthly time-frame are completely bullish. However, its weekly overview shows slightly less bullishness, while its 4-hour chart is completely bearish.
LTC/USD 1-day Technicals
Technical factors (1-hour Chart):
- Its price is between its 50-period EMA and its 21-period EMA
- Price between its middle and bottom Bollinger band
- RSI is neutral (50.33)
- Volume is descending to average levels
Key levels to the upside: Key levels to the downside:
1: $161.5 1: $142.1
2: $181.3 2: $128.42
3: $186.3 3: $114.75
Related posts
 Daily Crypto Review, Jan 15 – Bitcoin Retraces After Hitting $40k; Ethereum Contests $1.2k
 Daily Crypto Review, Jan 21 – BTC in a Triangle Formation – What do the Analysts Say?
 Daily Crypto Review, Jan 28 – Bitcoin Strong Bounce off the 30K level, Altcoins Reversals Followed
 Daily Crypto Review, Jan 29 – Dogecoin Skyrockets as r/Wallstreetbets Enters on Crypto; Bitcoin Jumps on Elon Musk’s Twitter Profile