
The Elliott wave principle has its origin in the early 1930’s decade. The introduction of the wave concept was published in 1934 by R.N. Elliott in his work “The Wave Principle.”

The Wave Principle
In Elliott’s treatise, the author indicates that financial markets as a socio-economic activity hold a specific structure composed of five waves. In his model, Elliott teaches us that waves 1, 3, and 5, move following the direction of the dominant trend. On the contrary, waves 2 and 4 develop an opposite movement to the primary trend.
Parts of the Cycle
The Elliott wave cycle has two components; these components are an impulsive wave and a corrective wave.
As said before, an impulsive sequence holds five waves; and a corrective wave contains three segments. In consequence, a complete cycle has eight waves.
The next figure unveils a complete Elliott wave cycle.
The Analysis Process
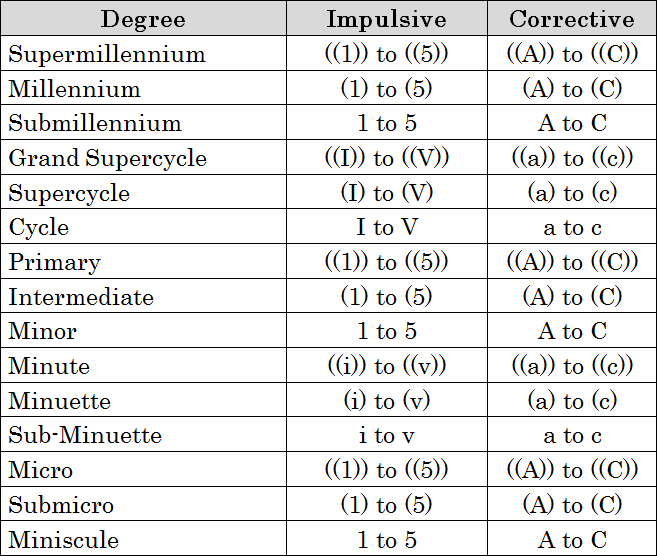
When R.N. Elliott developed its theory, he defined a specific terminology to maintain the order in the analysis process. The author established a series of degrees that must be considered in relative terms about price and time.
The next table illustrates the different degrees defined by Elliott.
The analysis process starts with the relevant highs and lows identification in a larger timeframe. After this, we proceed to study the prices’ sequence; to aid to do this step, we examine the proportionality and the relation between price and time. The next chart illustrates the relationship between price and time.
The next stage is to identify impulsive waves. The basic guidelines of motive waves are:
- It has five consecutive segments building a trend.
- Three segments move in the same direction.
- Wave three never is the shortest.
- Wave two never ends below the origin of wave one.
- When an impulsive movement finishes, it starts a corrective move of the same degree.
Alternation is a key concept of the wave principle. We observe the motive and corrective waves alternate one with another.
We observe the alternation in:
- Distance.
- Time.
- Retracement.
- Complexity.
The following EURAUD charts illustrate the concept of an alternation.