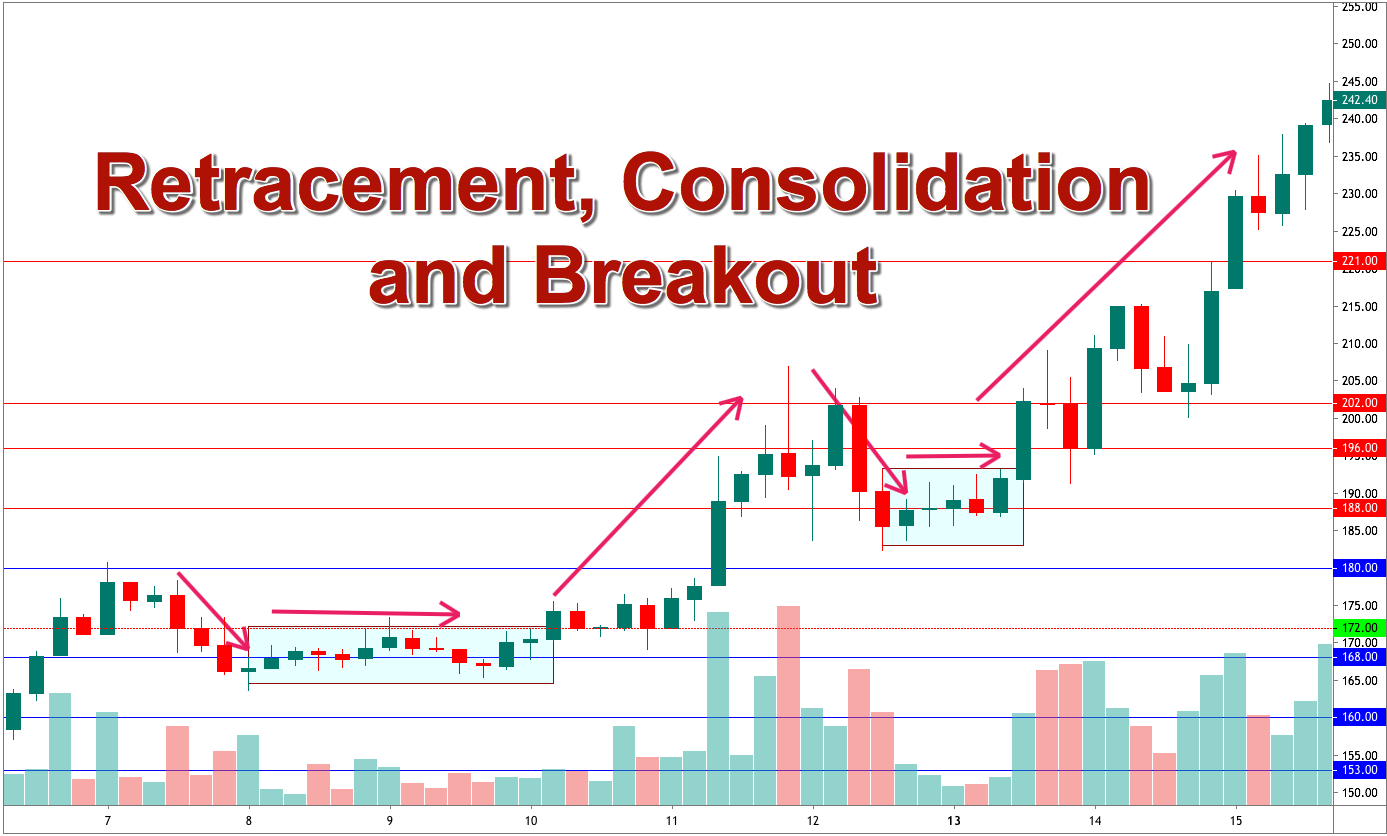
In the financial market, there is a saying, “Trend is your friend.” When the price makes a strong move towards a direction breaching a significant level of support/resistance, traders start looking for opportunities to take entries. The word ‘opportunity’ signifies a lot. After making a strong move, the price usually makes a correction/consolidation. At the correction/consolidation, the price finds a level of support/resistance. This is what gives a good risk-reward ratio to traders. In the end, it brings more winning trades, as well. In this lesson, we are going to demonstrate how a retracement gives us an entry.

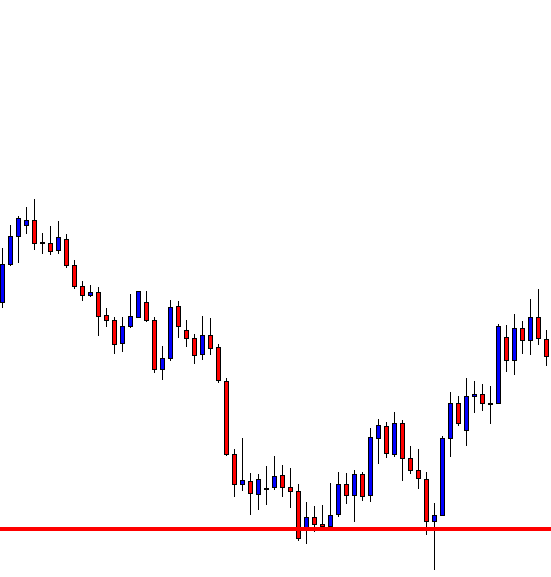
The price produces a Double Bottom and breaches the neckline level. The buyers are to look for opportunities to go long on the chart. Look at the last two bearish candles. The price seems to have started having a correction. The last candle closes within the support. We might as well get a buying opportunity here. A bullish reversal candle at this level shall attract the buyers to go long. Let us see what happens next.
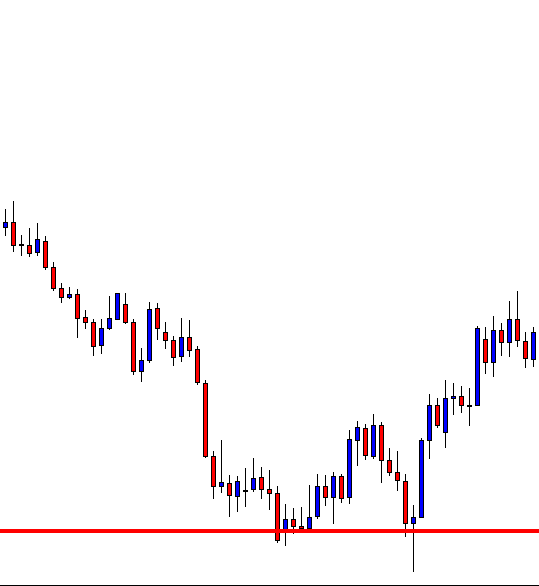
A bullish engulfing candle is produced here, which is considered the most powerful reversal candle. We have been eyeing to buy. Make a decision. What shall you do? Are you going to click the “Buy” button? Hang on. You must consider an equation before going long here. Look at the chart below.
The bullish reversal candle is produced at a level of support where the price had its last bounce. This is consolidation where the price is caught in a range. Thus, until the price makes a breakout at the resistance, we must not buy. Let us look at the chart below to find out what happens next.
The price comes out from the consolidation zone by making a downside breakout. It seems that the price is going to have a long retracement. Honestly, it appears that the buyers may not get the opportunities to go long. The price has been heading towards the South by making an ABC pattern, and the bullish trend is about to collapse. A down-trending Trend Line works as a resistance as well. Then, this is what happens.
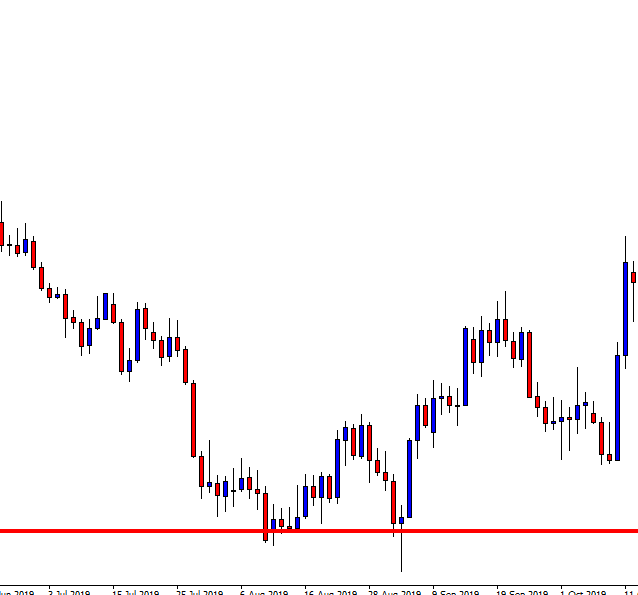
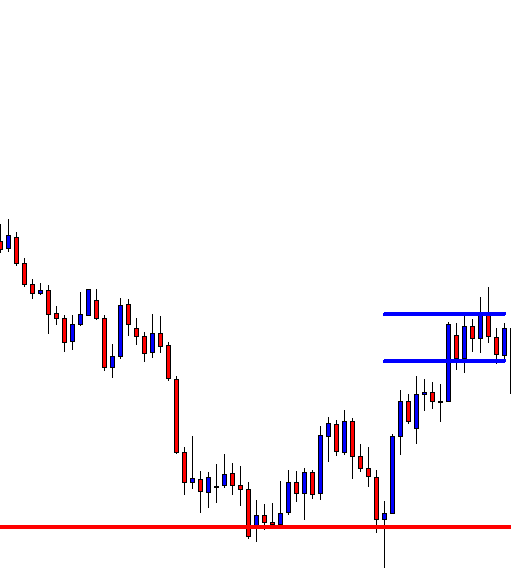
We have a massive bullish engulfing candle at the level where the price has had several bounces. This is the candle, you may click the “Buy” button, right after it closes. A question shall be raised here that we do not take the long entry at the first bullish engulfing candle, but we do it now. What is the reason behind that? Before answering the question, look at the chart below.

The signal candle this time makes a breakout at the down-trending Trend line. This means along with a strong bullish reversal candle, we get a breakout as well. This is what makes the price action traders click the “Buy’ button this time. Let us have a look at the chart how it looks after clicking the “Buy” button.
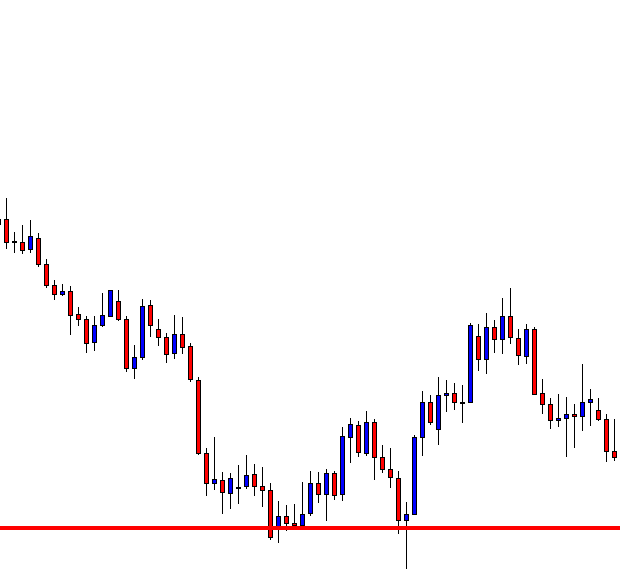
It looks good. The price heads towards the North with good buying pressure. This is what we love to see. However, this does not come as easy as it sounds. The first bullish engulfing candle does not offer us entry, but this one does. The reason is it makes a breakout. We need to have a lot of practice, study, and research to be well acquainted with consolidation, correction, reversal, and breakout. Stay tuned to get more lessons on these topics.