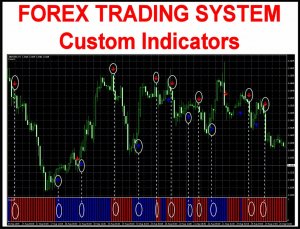
There are thousands of indicators out there. In fact, there are so many that it is impossible to look at them all. What you may find when going through them is that a lot of them are actually different variations of a few different major indicators, with the creator having simply made a few small changes here and there. The underlying principle and method behind the indicators are fundamentally the same, in fact, for most of them, you would not actually see much difference at all.
So we are going to be looking at some of the more widely used trend-based indicators that are out there. You most likely will have heard of some of them or even used a variation of one yourself. Let’s take a look at what these major and popular trend indicators are.
Price Action
This is probably the one that most people would have heard of. In fact, some people who know nothing about Forex or trading may well have heard of this one too. When it comes to trading, price is the number one variable that we will be looking at and it is one that dictates the majority of moves within the markets. So getting a good understanding of what price action does and how the trends work is often the first thing that people set out to learn.
There are multiple different ways to look at price action. There are higher highs or lower lows and it is something that every trader should understand. We are not going to be going into detail here on how you actually analyse it, but there are hundreds of indicators out there that you are able to add onto your charts which give a fantastic overview of the current price action that is going on within the markets. The current price can tell you a lot about the current trends. The good thing about some of the price action indicators is that they also include trend lines, making it far easier to see where the current price sits within the current trend, a valuable tool for any trader or any experience level.
Moving Averages
One of the most used indicators when it comes to trading forex would have to be the moving average indicator. It is used to help identify the trends within the markets. There are multiple different forms of moving averages but they all follow the same ideas and aim to plot the average prices of a currency over a specific period of time over the price itself.
What the indicator suggests is that if the current price is above or below the current average price. It should indicate whether the markets are currently bullish or bearish. You are also able to work out the possible strength of a trend by looking at the steepness of the moving average slope. The steeper that the slope is, the stronger the trend would be. More often than not, you would use a long term in a short term moving average at the same time to help confirm any possible bullish or bearish movements.
The moving averages indicators are often used in conjunction with other indicators to help set up trades for specific strategies. Even if you do not use it for your trading, having a general idea of the current trend and where that trend sits above the average price can be invaluable to your trading, including both entry and exit positions.
The Parabolic SAR
Parabolic SAR, which stands for Stop and Reverse, is a great indicator that a lot of people use. The way it works is by identifying the short term trends within the markets. It will simply place dots on the charts which will be either above or below the high or the low in the price.
It works by using a number of different variables to help calculate its values. It uses things like acceleration factor and extreme price to do this. It is extremely useful when looking at the short term trends and the changes that are happening within these trends. It can be used to help with both entry and exits of trades as it is good at showing where the reversal could happen. It should also be used multiple times to enable for better correlation and confirmations of the short term trends and the changes that could be taking place.
The MACD
Also known as Moving Average Convergence, divergence, it is an oscillator which means that it will usually measure variables and changes in things like momentum and volatility. The MACD indicator is slightly different though because it also acts as a trend indicator, as well as calculating the momentum in the price of a currency.
The MACD indicator includes a histogram which will oscillate around the 0-level. The fast and slow lines are known as the MACD line and the signal line. The indicator gets its values from the exponential moving average indicator with a setting of 12 and 26 periods. The trends that are shown in the price charts are validated by using a combination of variables in the MACD indicator. MACD is widely used and there are a lot of indicators and expert advisors out there that have implemented it into their strategies and into their indicators, so you do not need to look far to see MACD being mentioned.
Ichimoku Cloud
This indicator is also known as Ichimoku Kinko Hyo, is a pretty unique one as it is a trending system within itself, not needing any additional input. It was developed to work as a trend following indicator which has a large number of variables included in it for customisation and adaptations.
The cloud within the indicator is often seen as the support and resistance level areas within the markets. The Chikou, Kijun-sen and Trinjensen measure the 9-period and 26-period levels on the charts. The Ichimoku Cloud indicator is fast becoming one of the most used trend indicators and is now getting used more and more by new and experienced traders. On first impression, it can look a little daunting due to the vast numbers of options and variables available, however, during a time of sustained trend in the markets, the indicator is able to give very good and very accurate results, which is why it is now so highly used.
So those are some of the most popular trend indicators that are being used right now. Which one you should use is entirely up to you. Some match and combine with certain strategies while some do not, some are far simpler than others, but the decision of which to use will need to be based on what will work best with your current strategy. All we know is that they are all incredibly helpful and potentially powerful tools that you can add to your trading arsenal.

