Mastering Price Action
Price action is a discipline of identifying price action trends (up and down movement) reversals, support, and resistance via technical analysis on a trading chart during a specified period of time. Price action analysis is used in conjunction with global news events and economic data releases, which act together in order to influence exchange rates.
Most technical traders profit by devising a strategy which actually combines both price action, fundamental analysis, and their overall understanding of technical analysis. All these factors work hand-in-hand with each other.
Different tools can be applied to a chart to make trends in price action more obvious for traders. And where technical analysis formations and chart patterns are derived solely from price action.
Example ‘A’
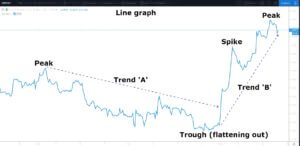
Example ‘A’ is a 2-hour line graph of the British pound against the American dollar, also known as Cable. Let’s disregard the comments on the graph and simply focus on the actual line graph itself, which denotes the up and down movements – or price action – of the exchange rate of this currency pair. If we only used this line graph to trade this particular pair, we would find it extremely difficult to know when to open a trade in any particular direction. It simply looks chaotic and random!
However, looking a little more closely we can see a peak on the left hand side of the chart which occurs at the 1.2567 exchange rate level, before price action descends to the 1.22 level, which is a key level, and where we might expect to find some potential support, (a floor in this example) and where indeed the price flattens out here and which marks the end of trend ‘A’.
Price then moves higher throughout trend B and where we see a couple of spikes, some pullbacks, and then a continuation to the peak of 1.2850; another key level (in this case, a potential ceiling).
Example B
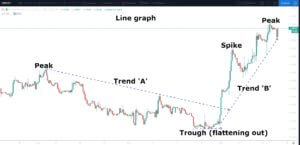
In example B, we have changed the line graph to Japanese candlesticks, a style of technical analysis which is more widely used in the trading community and which is much easier to read in terms of potential fading of price action and therefore possible opportunities to enter the market more easily.
Here we can see for example that our initial peak on the left-hand side of the screen showed a high, as denoted by the green (bullish) candlesticks, which was replaced by a red (bearish) candlestick – which was larger than the preceding two candlesticks – and was a warning to traders of a potential pullback, or a reversal of price action.
Indeed price begins to fall before almost returning to trendline ‘A’ and then continues the momentum to the downside. Eventually, the price action returns to our trend line before continuing the move lower by way of a series of falls and pullbacks and where trendline ‘A’ has become a simple moving average.
After the price action flattens out at the 1.22 level, we are able to identify a move higher and where the larger candlesticks (a sign of a strong trend) move above the trend line or simple moving average, and this starts a price action reversal. When price crosses the extended trend line ‘A,’ this becomes a signal of a new trend, and indeed trendline ‘B’ becomes a simple moving average to the peak of 1.2850.
Example C
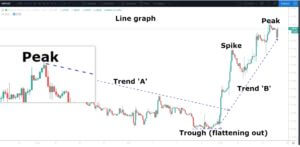
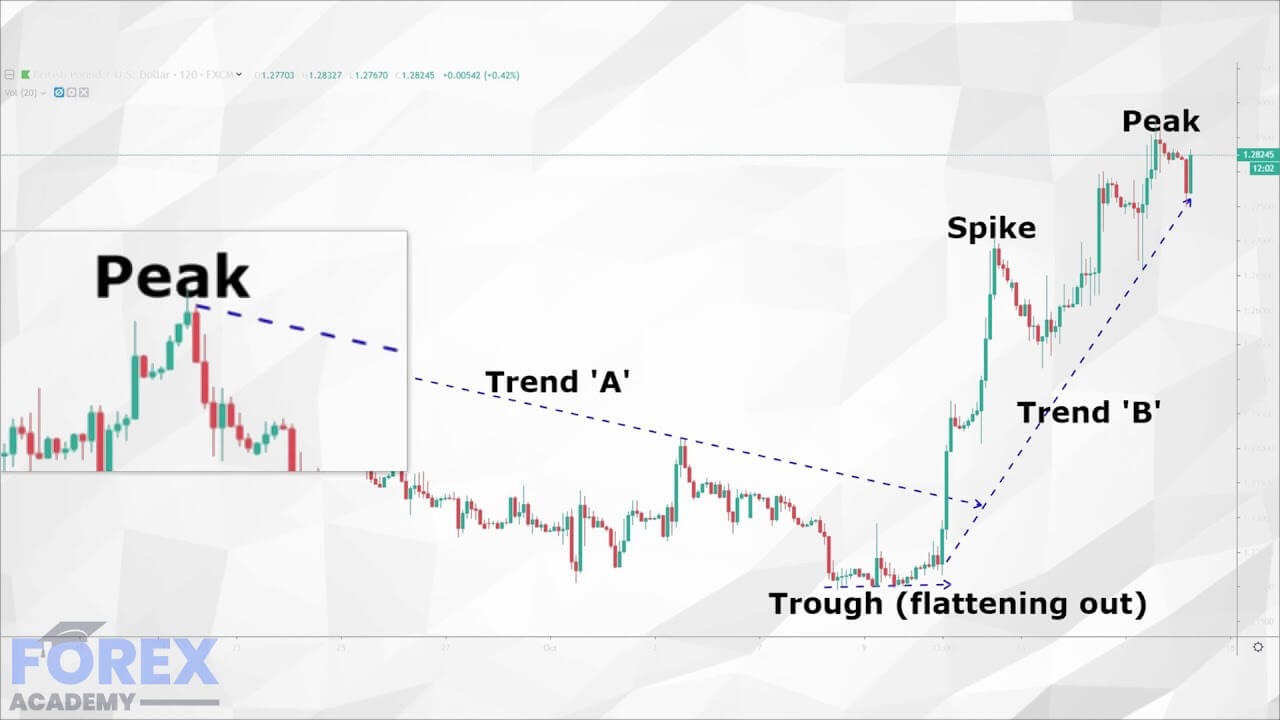
Now let’s look at candlesticks a little more closely. In example ‘C’ we have magnified a section of price action in order that we can analyze the candlesticks in more detail. Note that price action, as denoted by the green candlesticks, is in an upward trend. The last green candlestick in this sequence is called an upside-down hammer. This has a smaller ‘wick’ at the bottom, a small ‘body,’ and then a longer wick at the top: Hence the term upside down hammer. At its height, the price has moved to the highest point and then pulled back before the next candlestick opens. The subsequent candlestick is a descending candlestick with a long body, and one small wick at the top, and where the candlestick is longer than the preceding two bull candlesticks. This type of Candlestick is an engulfing candlestick (it engulfs the previous ones), and often sets the precedent for any subsequent move; in this case lower.
Example D
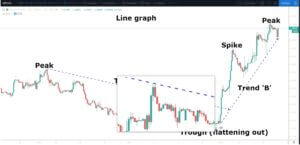
In example ‘D’ we can see that the bulls have been in control of the price action and moved the exchange rate up to trendline ‘A.’ However the subsequence candlestick is a bearish candlestick, which engulfs the body of the previous candlestick, and where price action begins to trend lower. In the middle of the sequence, we see another hammer shape candlestick, but this time it has a longer wick at the bottom, and traders have taken advantage of this and move the price higher. Many of the candlesticks in the remainder of this sequence are very small, and this usually denotes that there is a lack of volume at the present moment in time.
Example E
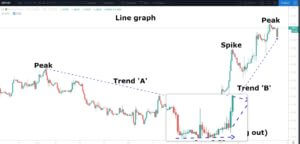
Now we turn our attention to example ‘E,’ where we have magnified the price action around the key 1.22 area. Many of the candlesticks we see have small bodies, and where some of the candlesticks have small wicks; these types of candlesticks are called ‘spinning tops’ and usually denote a lack of direction and a lack of volume in the market. Towards the end of this sequence, we can see that the last two bullish green candlesticks open above the preceding ones, and both of these have long bodies with small wicks, which ingulf the previous candlesticks from the beginning of the move in this highlighted sequence. They form our new bullish move, which we have called trend ‘B.’
Therefore, the candlesticks become a much better tool to read price action. Suddenly the chaos and randomness ebb away! Remember, the larger the candlestick, the stronger the trend. Candlesticks are the best available tool for mastering price action. They are a leading indicator, and when combined with other technical analysis tools will help you get an edge in your trading! We will identify more Japanese candlesticks later in our course.

