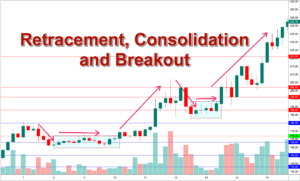
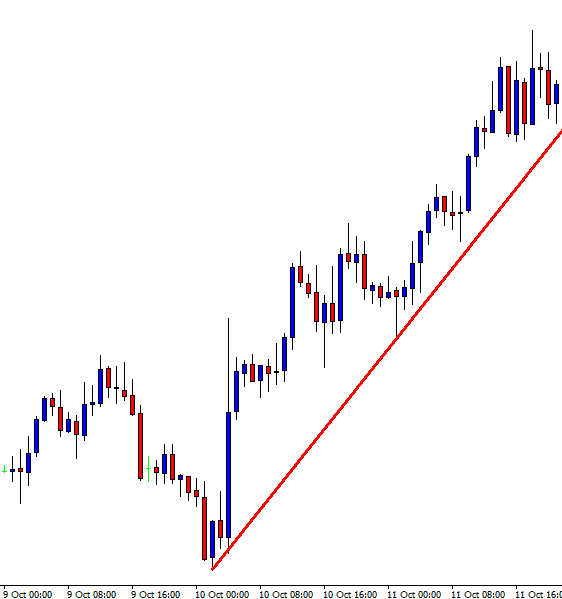
In today’s lesson, we are going to demonstrate an example of a breakout created by a gap or price adjustment. Usually, we get a gap at the start of a new week. Extremely high impact news events make charts have a gap too. Price action traders do not like the gap. Gap usually provides fewer clues which lead the market to be in a range. However, it sometimes may create opportunities by making a breakout. Today we are going to see how a gap makes a breakout at the support of an up-trending trend line and offers us an entry. Let us have a look at the chart below.

A strong uptrend is pushing the price towards the North. In this chart, traders shall look for opportunities to go long. Along with horizontal support, we shall draw an up-trending trend line here.
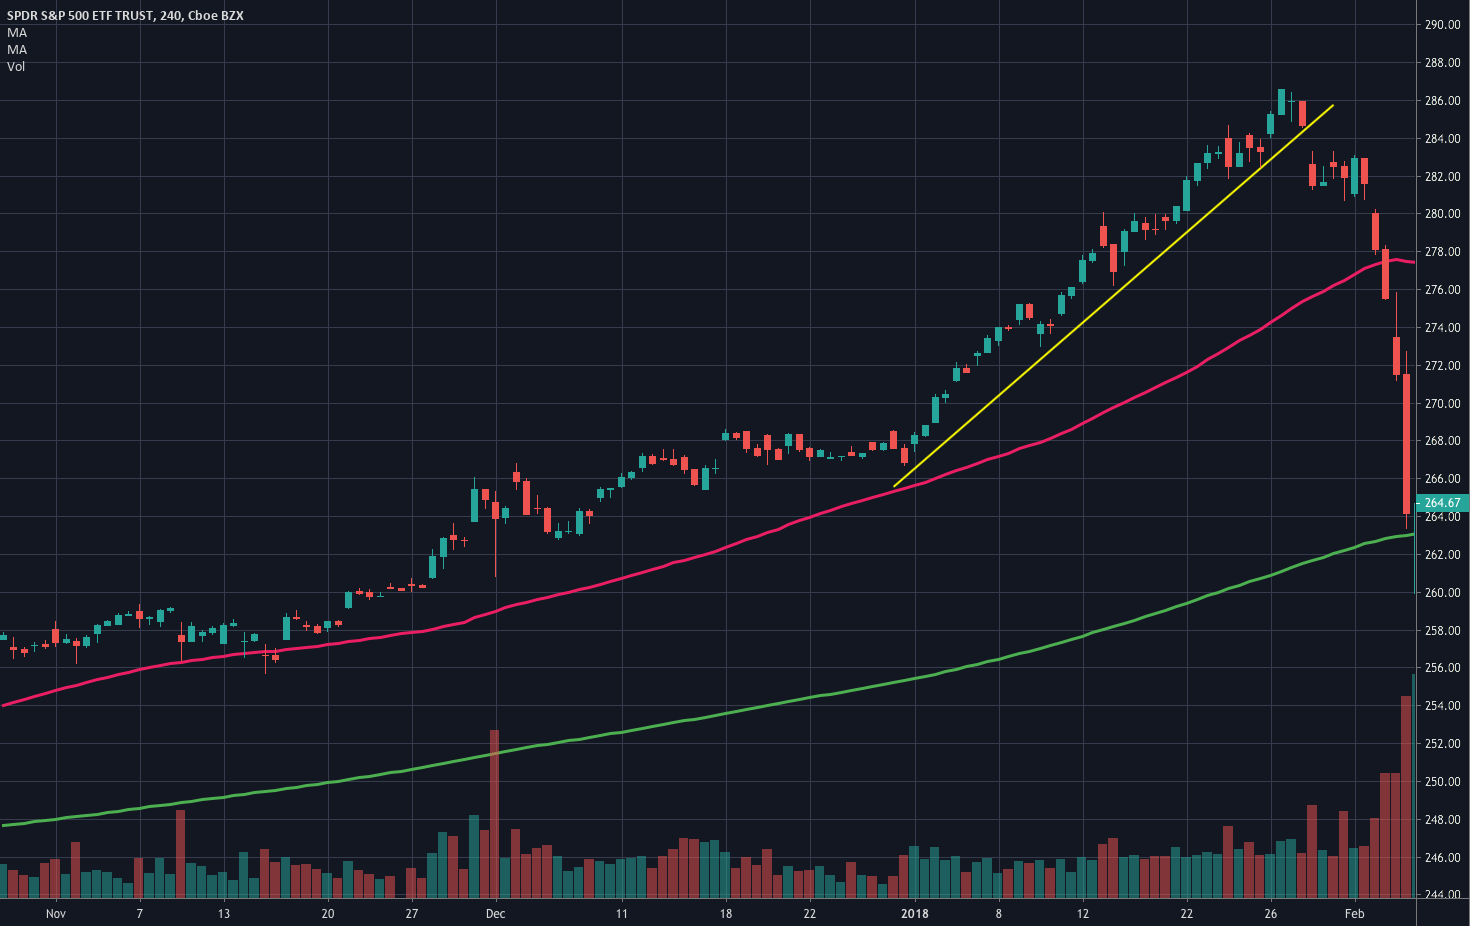
The buyers shall be more confident now. On the other hand, the sellers are to wait to get a downside breakout. In this case, the trendline has been a vital element. Thus, a trendline breakout may attract sellers to look for short opportunities. Have a look at how the breakout takes place here.
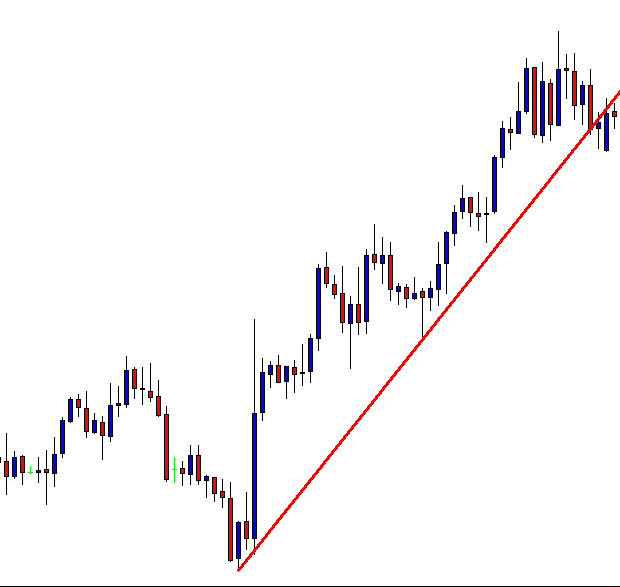
The breakout should have been done with a good-looking bearish candle. We do not see any here, but the price stays below the trendline. There has been an adjustment or price gap which has made the breakout. The question is do we consider it as a breakout?
The first sign of a downside breakout is the price goes past a support level. We have that here. Do you see that the price starts having an upward correction after the breakout? It closes within the flipped support of the trendline. This is the confirmation of a breakout. This means we have a confirmed breakout here which is done by a gap meaning the gap creates an opportunity here. Everything looks good so far. The price action traders are to wait for the final signal to go short. Can you guess how it may look like? Close your eyes for twenty seconds and think about the signal candle that you may want to have here. Open your eyes and have a look at the chart below.
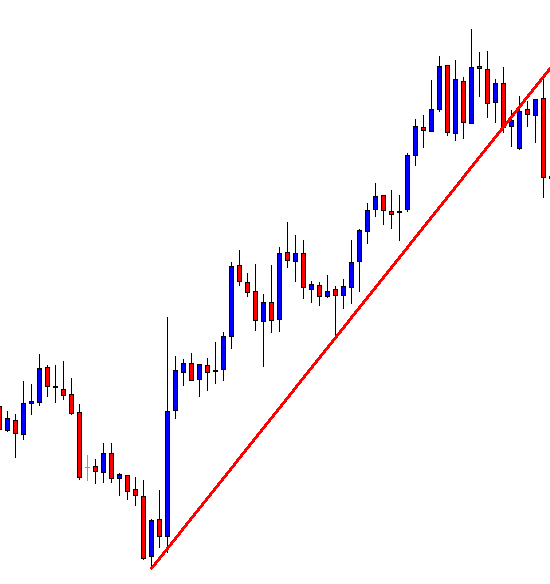
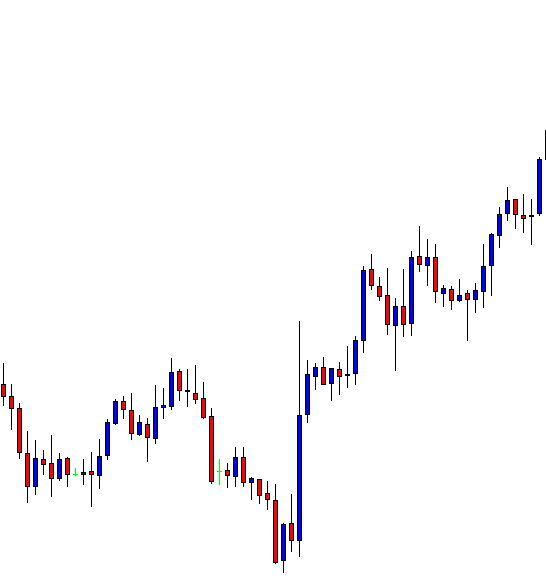
See how strong the last candle looks. This is the signal candle that the price action traders always dream of. A short entry may be triggered right after the last candle closes.
Let’s now have a look at how the chart looks like after triggering the entry.
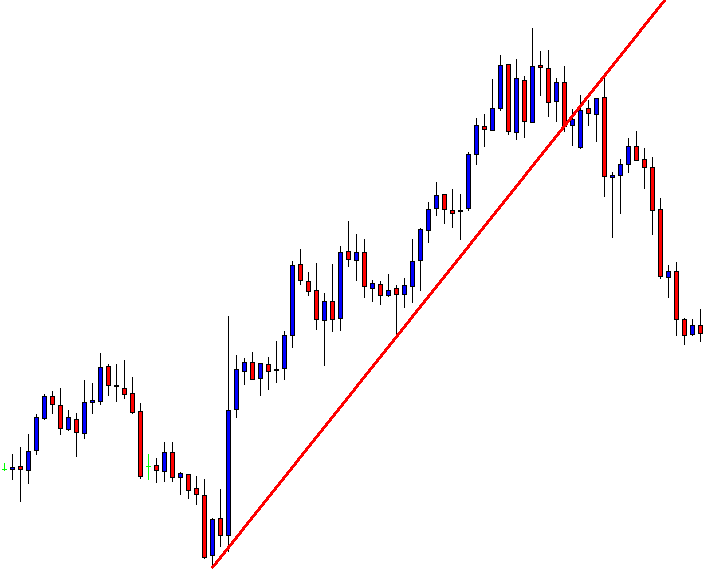
Looks good right. It does, but there has been an instantaneous upward correction. That may have created some butterflies in the sellers’ stomach. The price is held way above the signal candle’s resistance and in the end, the price heads towards the South with good selling pressure. The bottom line of the story “A breakout which is created by a gap helps the price action traders grab some green pips”.