
The Price Action Breakout Strategy works in almost all the charts. However, it works best on the daily chart. In today’s lesson, we are going to demonstrate an example of a breakout-trading example of that. The chart has a bullish gap, but consolidation followed by a bearish engulfing candle offers an excellent entry for the sellers.
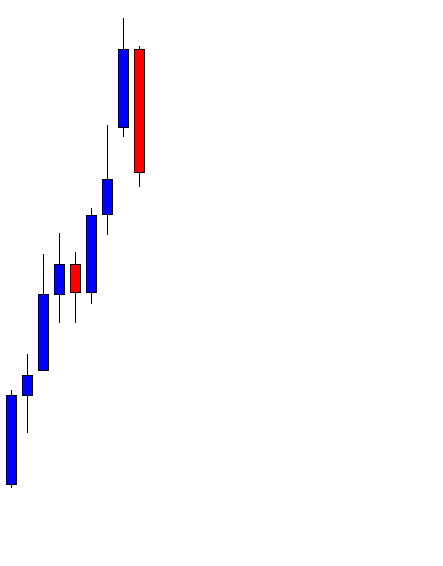
The chart shows that it makes a strong bullish move. Upon finding a level of resistance, it produces a bearish engulfing candle. The sellers may want to keep an eye in this pair to go short.

The price keeps going towards the South. The sellers must wait for the price to consolidate and produce a bearish reversal candle. The swing low is far enough, which offers the price to travel towards the South further.
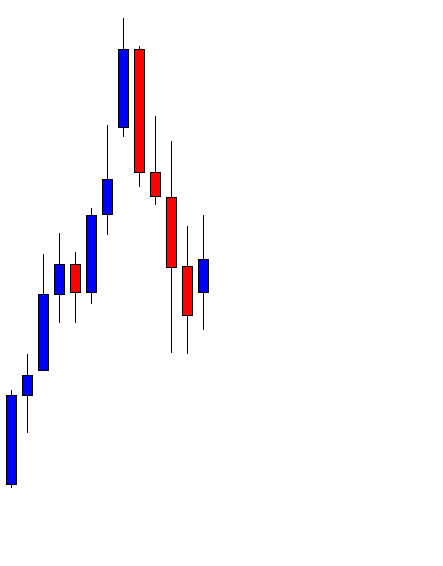
Here it comes. The chart produces a bullish candle. The sellers are to be attentive here. The chart may produce a bearish reversal candle and offer a short entry to them. Do not miss the point that the price has a little bullish gap. The gap is not visible explicitly, but if you count the last candle’s opening and the closing one before it suggests that the price starts with a gap.
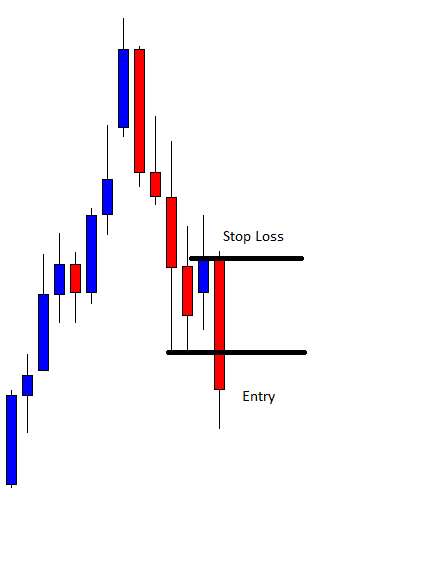
The chart produces a bearish engulfing candle closing well below consolidation support. The sellers may trigger a short entry right after the candle closes by setting stop-loss above the signal candle’s highest high. The space between the last swing low and the signal candle’s closing price suggests that the entry offers 1R. This should be enough to bring enough liquidity and drive the price towards the South.
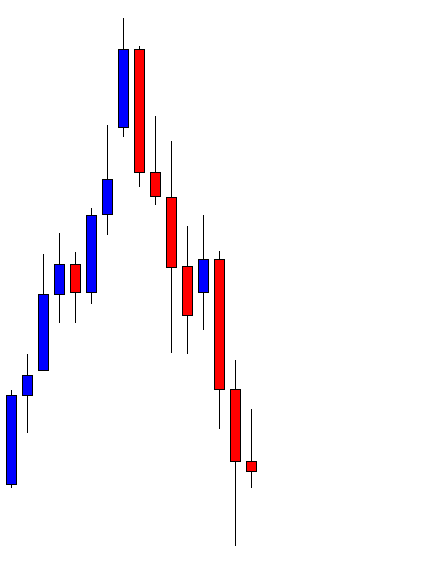
As anticipated, the price heads towards the swing low and hits the target. The sellers achieve 1R here with ease. The last candle comes out as a bullish reversal candle since it closes within the previous candle’s lowest low. The sellers may want to close their whole trade and wait for the next one.
Price action breakout strategy works in 5M to the weekly chart. However, the daily, the H4, and the H1 are the three best charts that work best with the strategy. Usually, the gap creates confusion among traders. It creates more confusion among price action traders. In this example, we have demonstrated that the gap does not create confusion, but the Price Action Breakout Strategy works well as it usually does. The little gap may be one of the reasons. However, if the daily chart produces a trade setup like this, it does not usually go in vain.