
Assessing Directional Bias – Predicting Long Term Trends
Directional bias and personal bias, i.e., the feeling that the markets will either go up or down, should not be confused because they are two entirely different factors relating to trading.
When it comes to personal bias, a lot of traders are right, but not necessarily at the right time! In fact, one of the safest bets in trading is that traders who hang on to trades that are going against them, because they have a biased opinion of the market, are the types of traders who regularly lose money. Therefore, the longer you hang on to a losing trade because of your biased opinion about the market, the more likely you are negatively affect your win to loss ratio.
There is an old saying in the market is; buy the rumor and sell the fact! And rumors abound in the markets. In fact, more so now than ever before, and especially with the advent of Twitter and the myriad of news release platforms. Indeed, it will probably have been from one of these that you formed your biased opinion in the first place.

Another problem with personal bias, and especially when it comes to retail traders, is that at what level do you define the value in a given exchange rate? A level that might seem correct to you might not be the same level as a large hedge fund, or institution, or, more importantly, a sovereign wealth fund or government!
When it comes to directional bias, traders want to see that their technical tools are working hand in hand with fundamental analysis and sentiment. After all, when we are all singing from the same hymn sheet, so to speak, this is when primary trends tend to develop.
So, if you do have a personal bias towards the market direction, the best time to run with that (to open Spot trades) is when you have the technicals, fundamentals, and sentiment backing you up. In other words, wait for the market to come to you and don’t go chasing it!
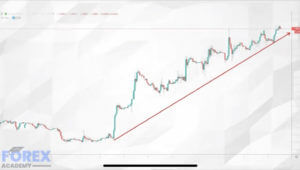
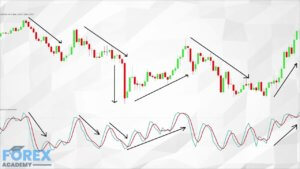
Let’s take a look at example A. This is the British pound against the US dollar, also known as Cable. The best way to read a chart is from left to right because it tells a story. In this particular chart of the 1-hour time frame, we can see that price action levelled off at the 1.22 exchange rate. Prior to this, directional bias was to the downside for this pair. This was due to the fact that Britain is getting closer to the 31st of October deadline, where it could possibly leave the European Union without a withdrawal agreement in place, thus crashing out, which would have been detrimental for the British economy. But at the point on the chart where the upward arrow has commenced, the European Union agreed to reopen the Withdrawal Agreement negotiations and thereby potentially opening the door to a managed divorce between the UK and the eurozone. Market sentiment changed at this point. Fundamental analysis also changed at this point because when the United Kingdom voted in the 2016 referendum to leave the European Market, the danger was that we would leave without a deal, and this caused the depreciation of the pound. However, with a mutually beneficial Withdrawal Agreement in place and backed by a strong economy, the pound was heavily perceived by the markets to be undervalued and, therefore, ready for a bull run.
The subsequent strong push higher in Cable to the 1.24 level and the lack of a pullback from that exchange rate meant that technical traders could see that everything was in position for a continuation in directional bias to the upside. And so from the 1.22 level, it was a case of when to get in and buy into the potential bull run during pullbacks and corrections.
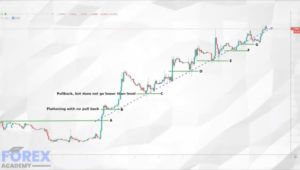
Let’s go back to our chart and take a look at example ‘B,’ where we have added a blue trendline and some areas of support and resistance. The first thing to point out is that a previously a ceiling, just below trendline ‘A’ has been breached to the upside. Price action continues to just above trendline ‘B,’ where we see a slight pullback and then a flattening of price action. Level ‘B’ then becomes a level of support. This came about shortly after an announcement by the European Union to reopen the UK Brexit Withdrawal Agreement and enter into fresh negotiations. Price action continues to surge before pulling back to the area of support marked ‘C.’ Price continues to move up to various points or resistance before pulling back to areas of support found at ‘D,’ ‘E,’ ‘F’ and ‘G,’ thus providing traders with a strong directional bias the upside. Each level of support is defined by the blue trendline, which is drawn at the base of the pullbacks and where this trendline acts as a simple moving average.
Here at Forex.Academy, we strongly recommend you incorporate your own trading style and methodology with technical and fundamental analysis and market sentiment and let the trend be your friend.
Related posts
 Assessing Market Conditions – Becoming A Forex Master
 Advanced Forex Education – Technical Analysis Trading With Confluence
 Forex Academy Education For Absolute Beginners Session Three – Becoming A Professional Trader
 How To Get An Edge In Forex Using Statistical Thinking – Trade Like A Forex Titan Part 3