The Double Bottom is one of the strongest bullish reversal patterns that price action traders wait for once they see the price may have found a support zone. On a strong downtrend, the first bounce does not attract the buyers to go long. On the second bounce, however, it attracts the buyers to start looking for long opportunities. In today’s lesson, we are going to demonstrate an example of how a Double Bottom offered us an entry.

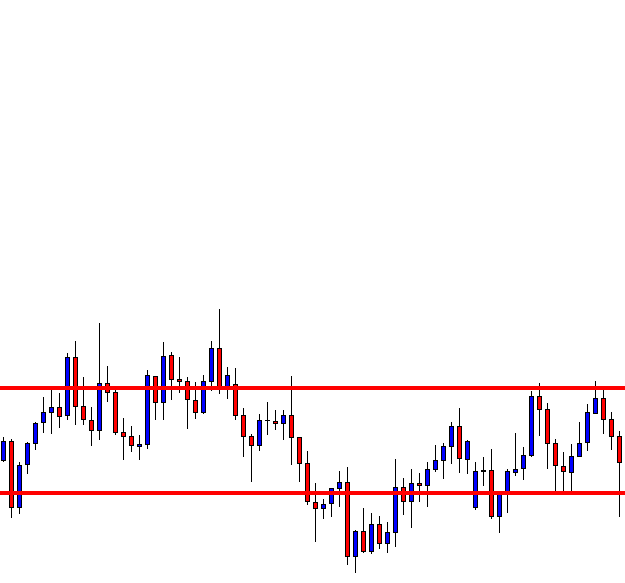
What do you think about the price action here? A choppy price action where the price gets caught within a horizontal range. It is best to avoid taking entries when the price action is like this. You may have noticed that the price has several bounces on the support and rejections on the resistance. To get a clearer picture, look at the chart below.
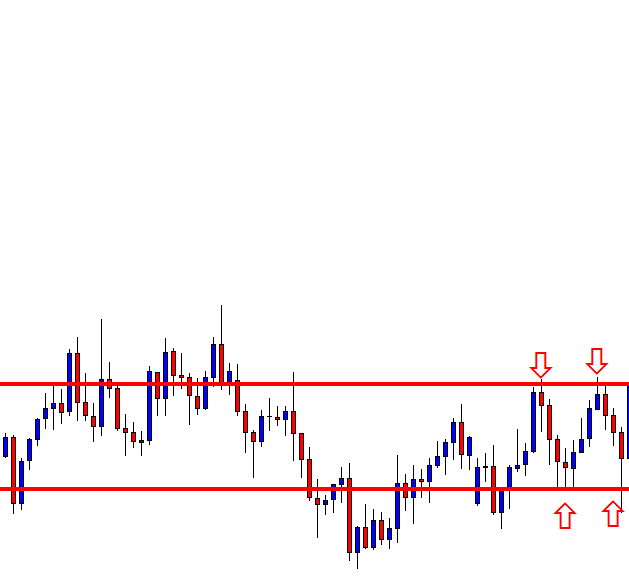
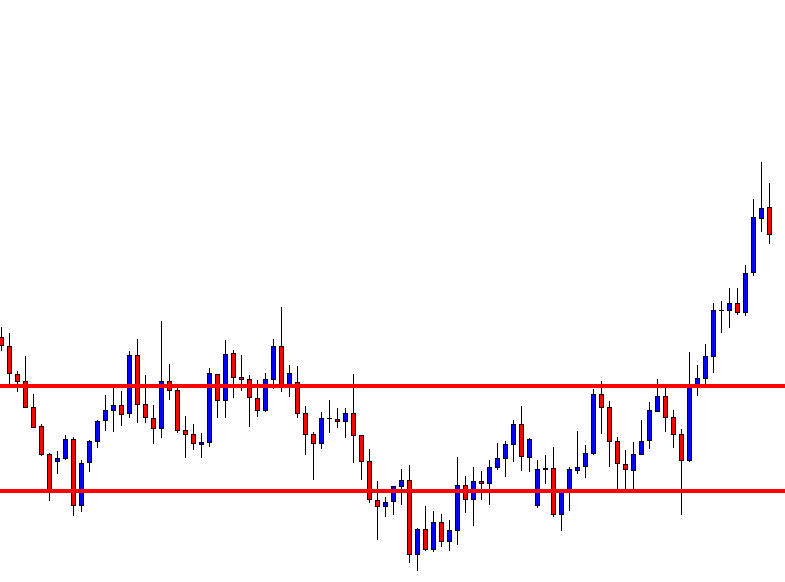
The price has a rejection of the resistance and a bounce on the support. The price goes up again; it had a rejection and a bounce on the same level. This means we may get a Double Top or a Double Bottom here. The chances are the same. Thus, we must wait for the price to make the decision.
Here it goes. An upside breakout takes place here. A Double Bottom and Breached Neckline, a perfect buying meadow. Do we start buying from here? No, we must wait for a confirmation. A pullback and another bullish move are needed to go long. See what happens next.
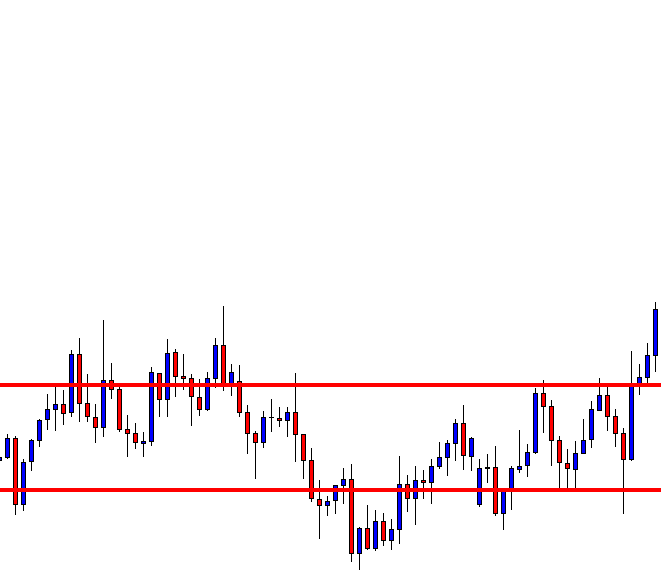
It seems like we may not get an opportunity to trigger an entry here. The price continues to go towards the North. Do not get into a trap. Never jump into a running train. Keep patience. See what happens next.

Here it goes. Finally, the price starts having a correction. Look at the last H4 bearish candle closing obeying the level where the price on minor time frames has bounces. It is time to wait for a bullish reversal candle. Is it going to be the very next candle or do we have to wait longer?
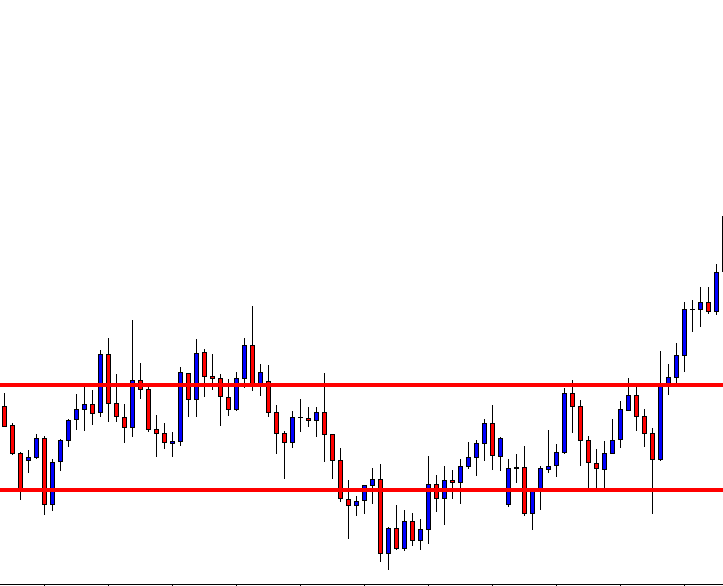
It is the very next candle that signals us that it is the time to trigger a long entry. The candle closes above the consolidation resistance having a tiny upper shadow. A perfect signal candle that the buyers have been waiting for.
The price heads towards the North with good buying pressure. 1:1 Risk and reward is easily achieved here. Such a nice price action this is! I have a question to you though. Do you see any other potential buying opportunity here? If you do, write on the comment box what the price action would be like if it is to offer another long entry. I am looking forward to getting your comments.