
Introduction
To this point, you know how to establish market extremes using the COT report. Since you can create your COT report trading indicator, let’s learn how you can effectively interpret the COT report. While spotting the overbought and the oversold regions using the COT report seems arbitrary, a more accurate way of interpreting the COT report would be using percentages of the long and short positions.
We have already established that the best way to identify tops and bottoms using the COT report is by following the trend of the non-commercial traders. Just like the formula for creating the COT trading indicator, calculating the percentages of the long and short positions helps filter out the biases of the raw data.
Calculating the percentage of long positions
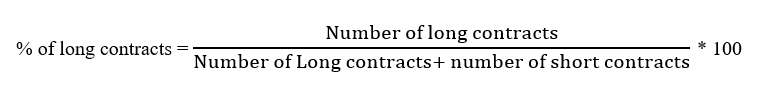
For a given currency pair, we first identify the number of long and short contracts. We then use this formula to determine the percentage of long contracts:
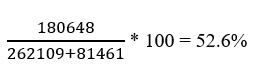
For the week of July 31, 2020, the EUR had a net long speculative futures position of 180,648 contracts. The percentage of the long contracts was
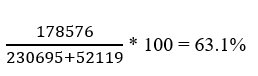
For the week of September 18, 2020, the EUR had a net long speculative futures position of 178,576 contracts. The percentage of the long contracts was
Now, assume that you are asked to pick the market top using the raw data for both the above dates. You would have selected the week of July 31, 2020, as your market top. The reason is that the raw data showed that the net long positions for speculative traders have 180648 contracts, while for the week ended September 18, 2020, they had 178576 net long contracts. Clearly, with the raw data, July 31, 2020, would have been the market top.
However, by calculating the percentage of the long contracts for both periods, we see that the week ended September 18, 2020, had the highest percentage at 63.1% compared to 52.6% for the week ended July 31, 2020.
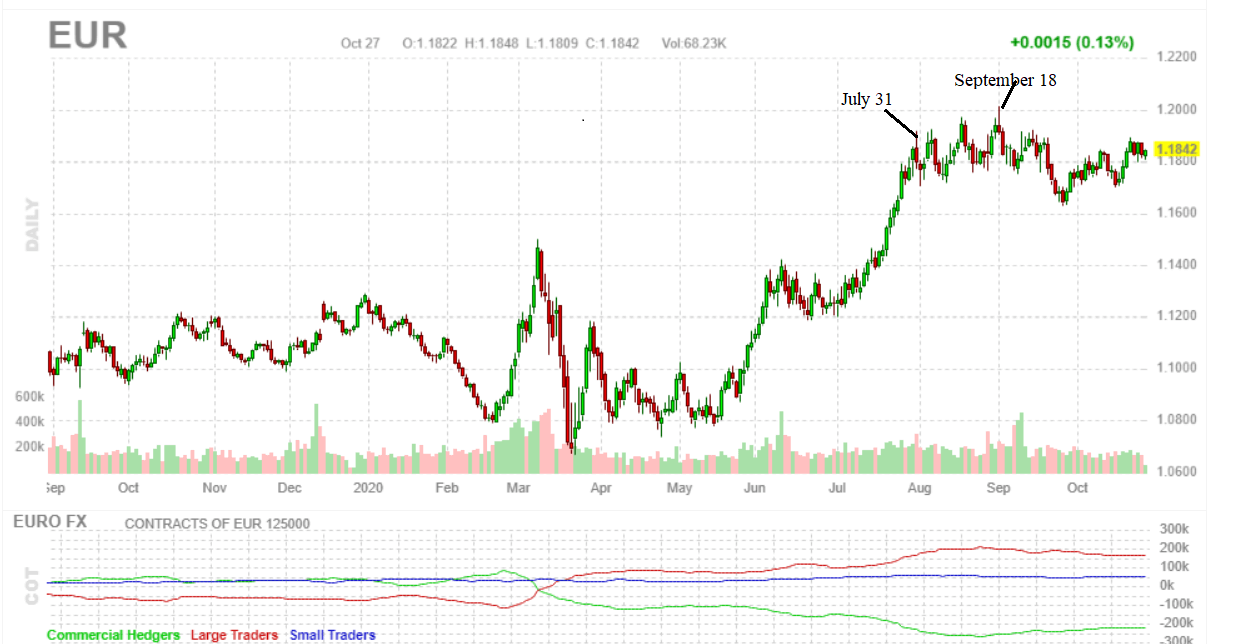
Looking at the futures chart for the EUR, we can confirm that, indeed, the week ended September 18, 2020, was the actual market top. [wp_quiz id=”94024″]