

In part 1 of this article series, we have created the Stochastic RSI indicator as part of our idea for a scalping strategy. Now that we have it functional, we will make the bull/bear phases and visually inspect whether it captures the turning market’s turning points.
Possible ways to create bull/bear slices
Our Stochastic RSI consists of two lines, k and d, and two trigger lines, ob and os. Therefore we can use multiple variants that may allow the creation of bull/bear price legs. Let’s consider the following 3
Variant 1 – The transition occurs at the SRSI entrance of the oversold or overbought regions.
Bull: The d-line crosses under the ob-line, which indicates it is into the overbought area
Bear: The d-line crosses over the os-line, indicating d‘s entry into the oversold area.
Code:
if crossunder (d, os)
    SRSI_Long := true
    SRSI_Short := false
else if crossover (d, ob)
    SRSI_Long := false
    SRSI_Short := true
else
    SRSI_Long := SRSI_Long[1]
    SRSI_Short := SRSI_Short[1]
This code creates a condition SRSI_Long at the cross of d under os, which holds until d crosses over ob and reverses it, creating an SRSI_Short state. This condition is only modified by d crossing under os.
The else statement ensures the condition does not change from the previous bar.
Once we have defined the bull and bear segments, we can color-shade them to visualize them in the chart. To do it, we will use the bgcolor() function.
bgcolor(SRSI_Long ? color.green: na)
bgcolor(SRSI_Short ? color.red: na)
The first statement asks the condition of SRI-Long ( the ? sign). If true, the background color changes to green. Otherwise, no change (an). The second statement behaves similarly for SRSI_Short.
Let’s see how this piece of code behaves in the BTCUSD chart.
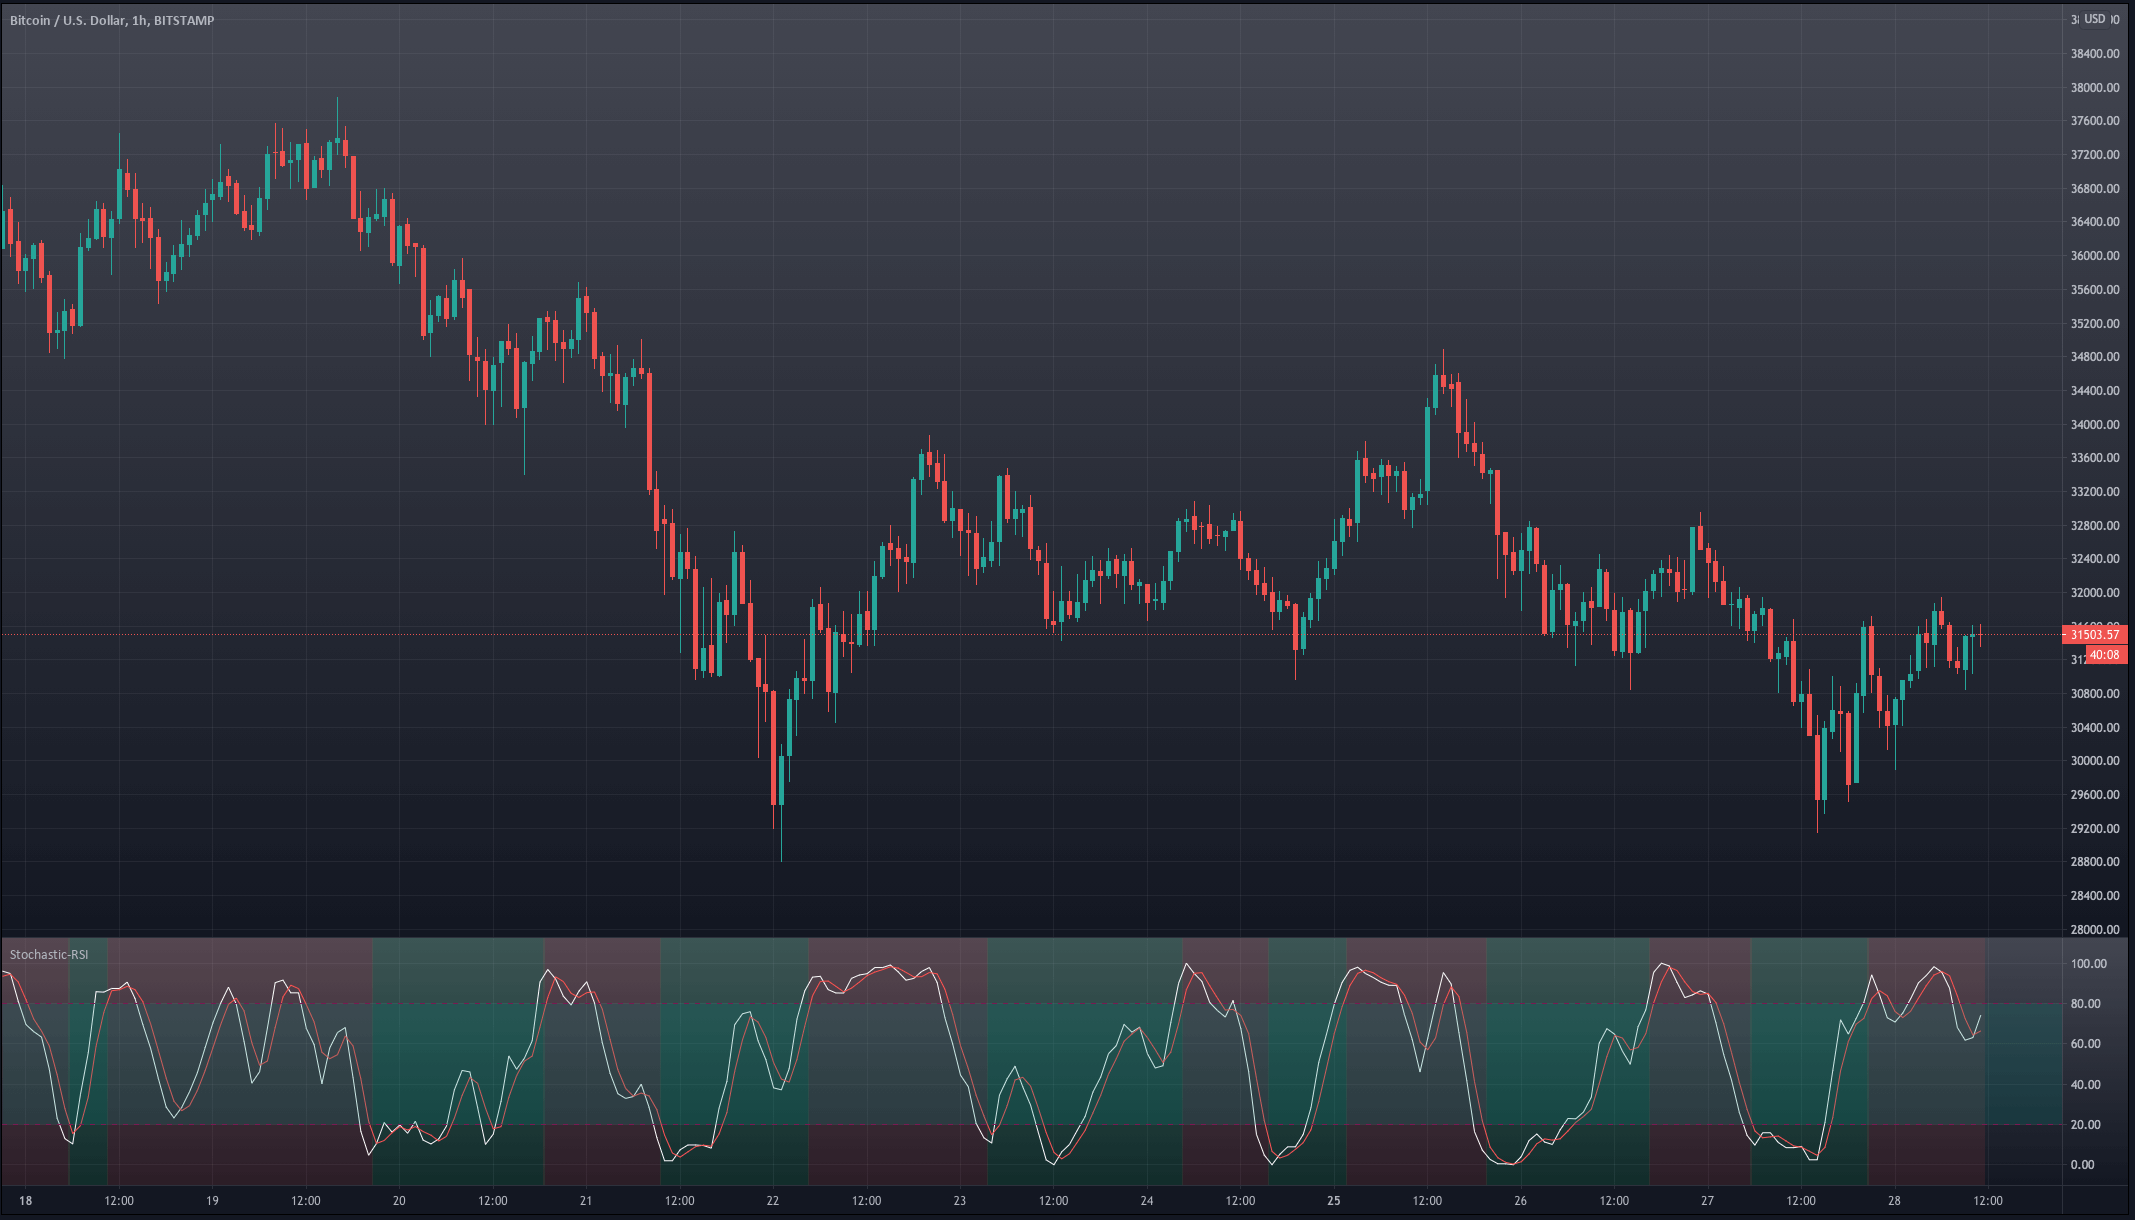 Variant 1 triggers the transitions too early. We see that on many occasions when the stochastic RSI enters the overbought or oversold region, it is more a signal of trend strength than a turning point.
Variant 2 – The transition occurs at D and K’s crossovers if in the overbought/oversold regions.
Bull: the k-line crosses over the d-line, if below os ( inside the oversold region. We ignore crosses in the mid-area)
Bear: the k-line crosses under the d-line, if above ob ( in the overbought area. We ignore crosses in the mid-area)
Code:
// creating the long and short conditions for case 2
if crossover(k,d) and d < os
     SRSI_Long := true
     SRSI_Short := false

else if crossunder(k,d) and d > ob
     SRSI_Long := false
     SRSI_Short := true
else
     SRSI_Long := SRSI_Long[1]
     SRSI_Short := SRSI_Short[1]
// bacground color change
bgcolor(SRSI_Long ? color.green: na)
bgcolor(SRSI_Short ? color.red: na)
The last section for the background change is similar to Variant 1.
Let’s see how it behaves in the chart.
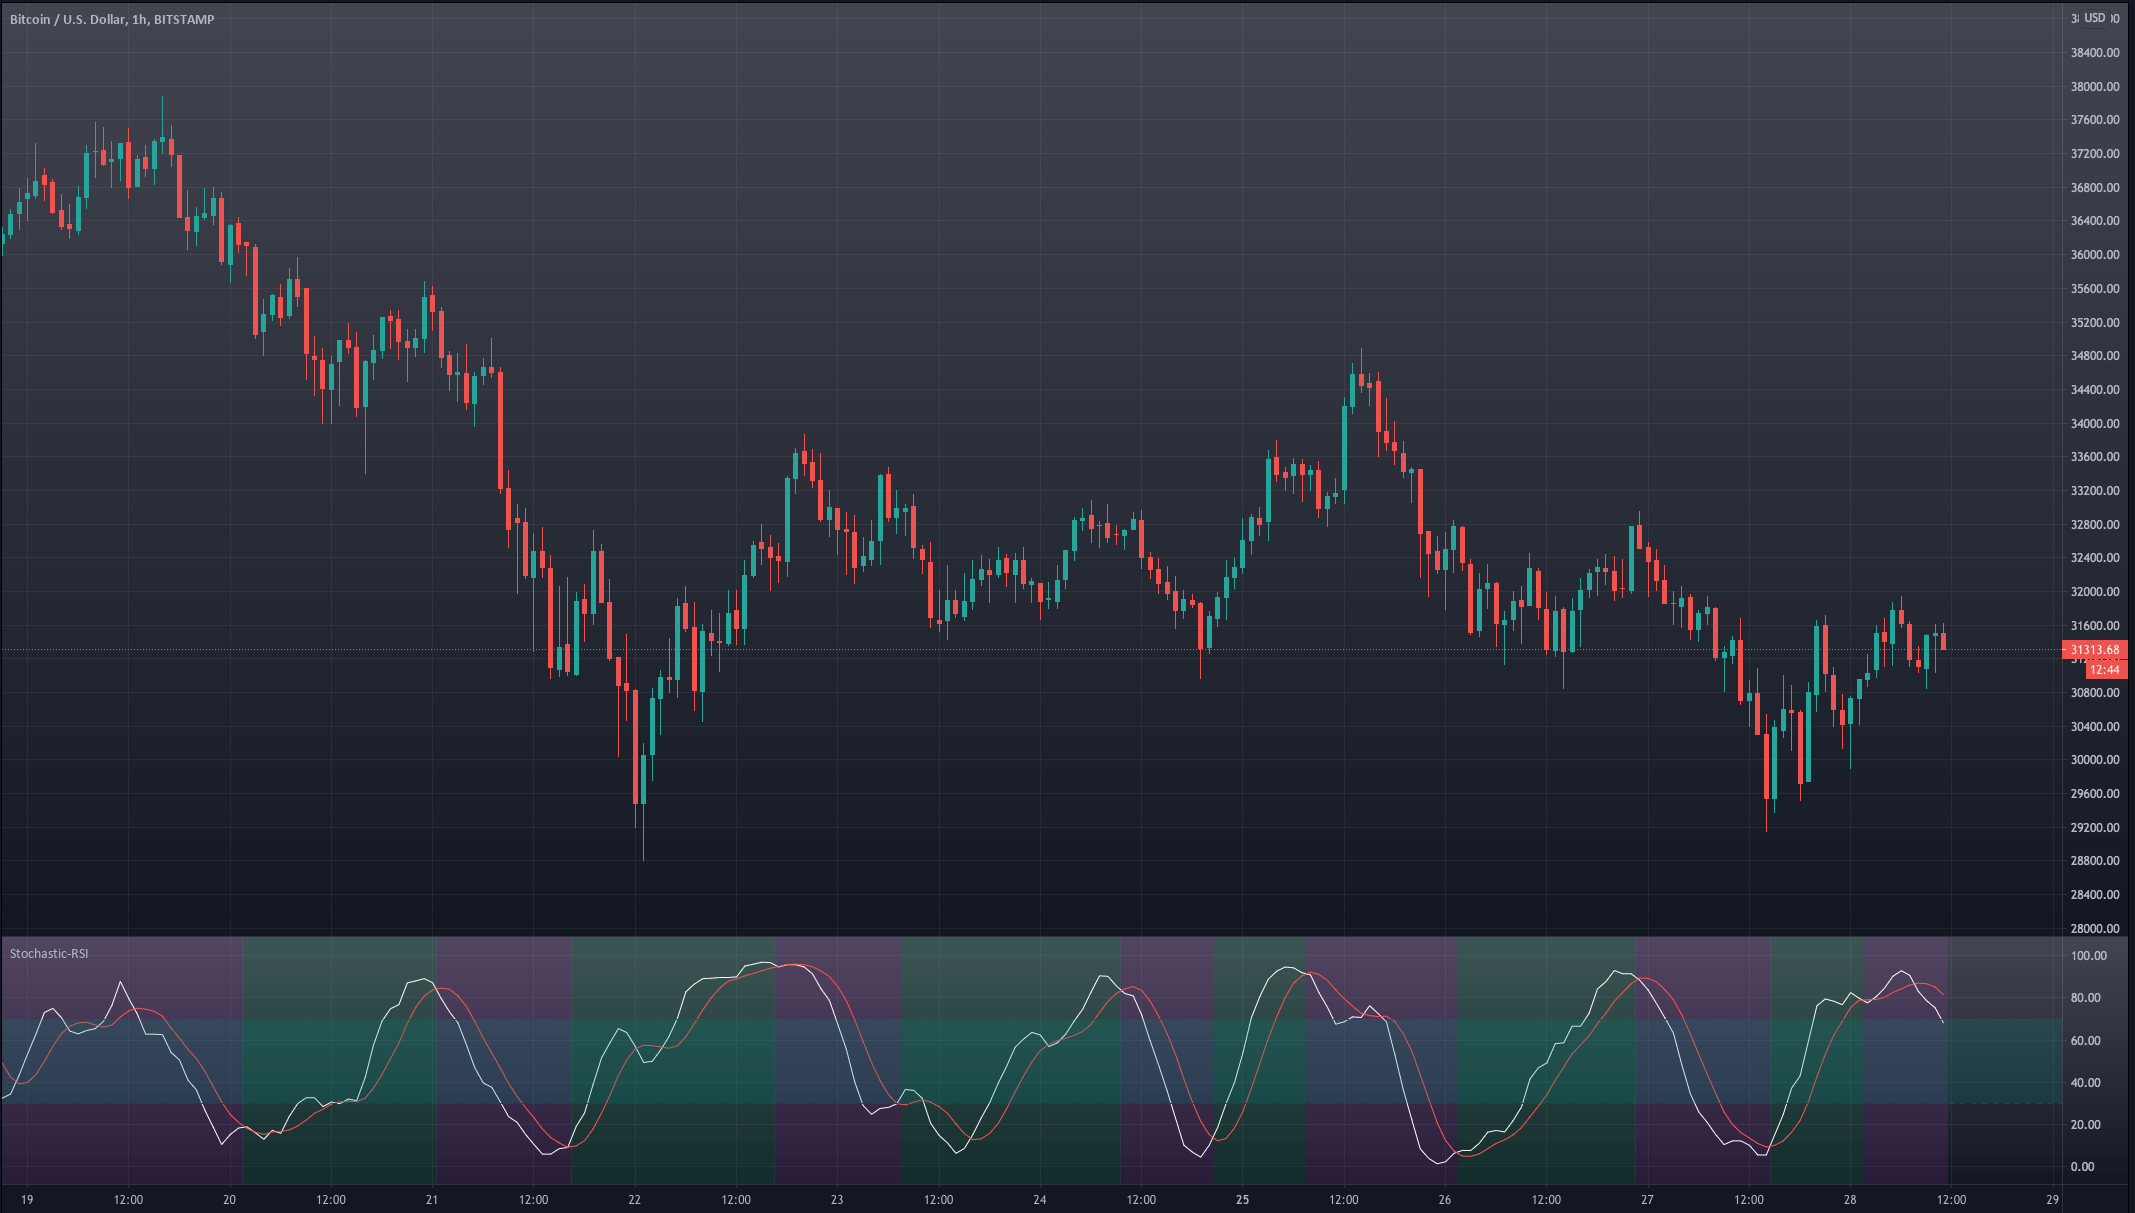
Variant 2 is an improvement. We see that the bull and bear phases match the actual movements of the market, although entries are still a bit early, and in some cases, it missed the right direction. It can be useful as a trigger signal, provided we can filter out the faulty signals.
Variant 3 – the transition occurs when d moved to the overbought or oversold region and, later, crosses to the mid-area.
Bull: the d-line crosses over the os-line
Bear: the d-line crosses under the ob-line.
if crossover (d, os)
    SRSI_Long := true
    SRSI_Short := false
else if crossunder (d, ob)
    SRSI_Long := false
    SRSI_Short := true
else
    SRSI_Long := SRSI_Long[1]
    SRSI_Short := SRSI_Short[1]
// bacground color change
bgcolor(SRSI_Long ? color.green: na)
bgcolor(SRSI_Short ? color.red: na)
And this is how it behaves in the chart.
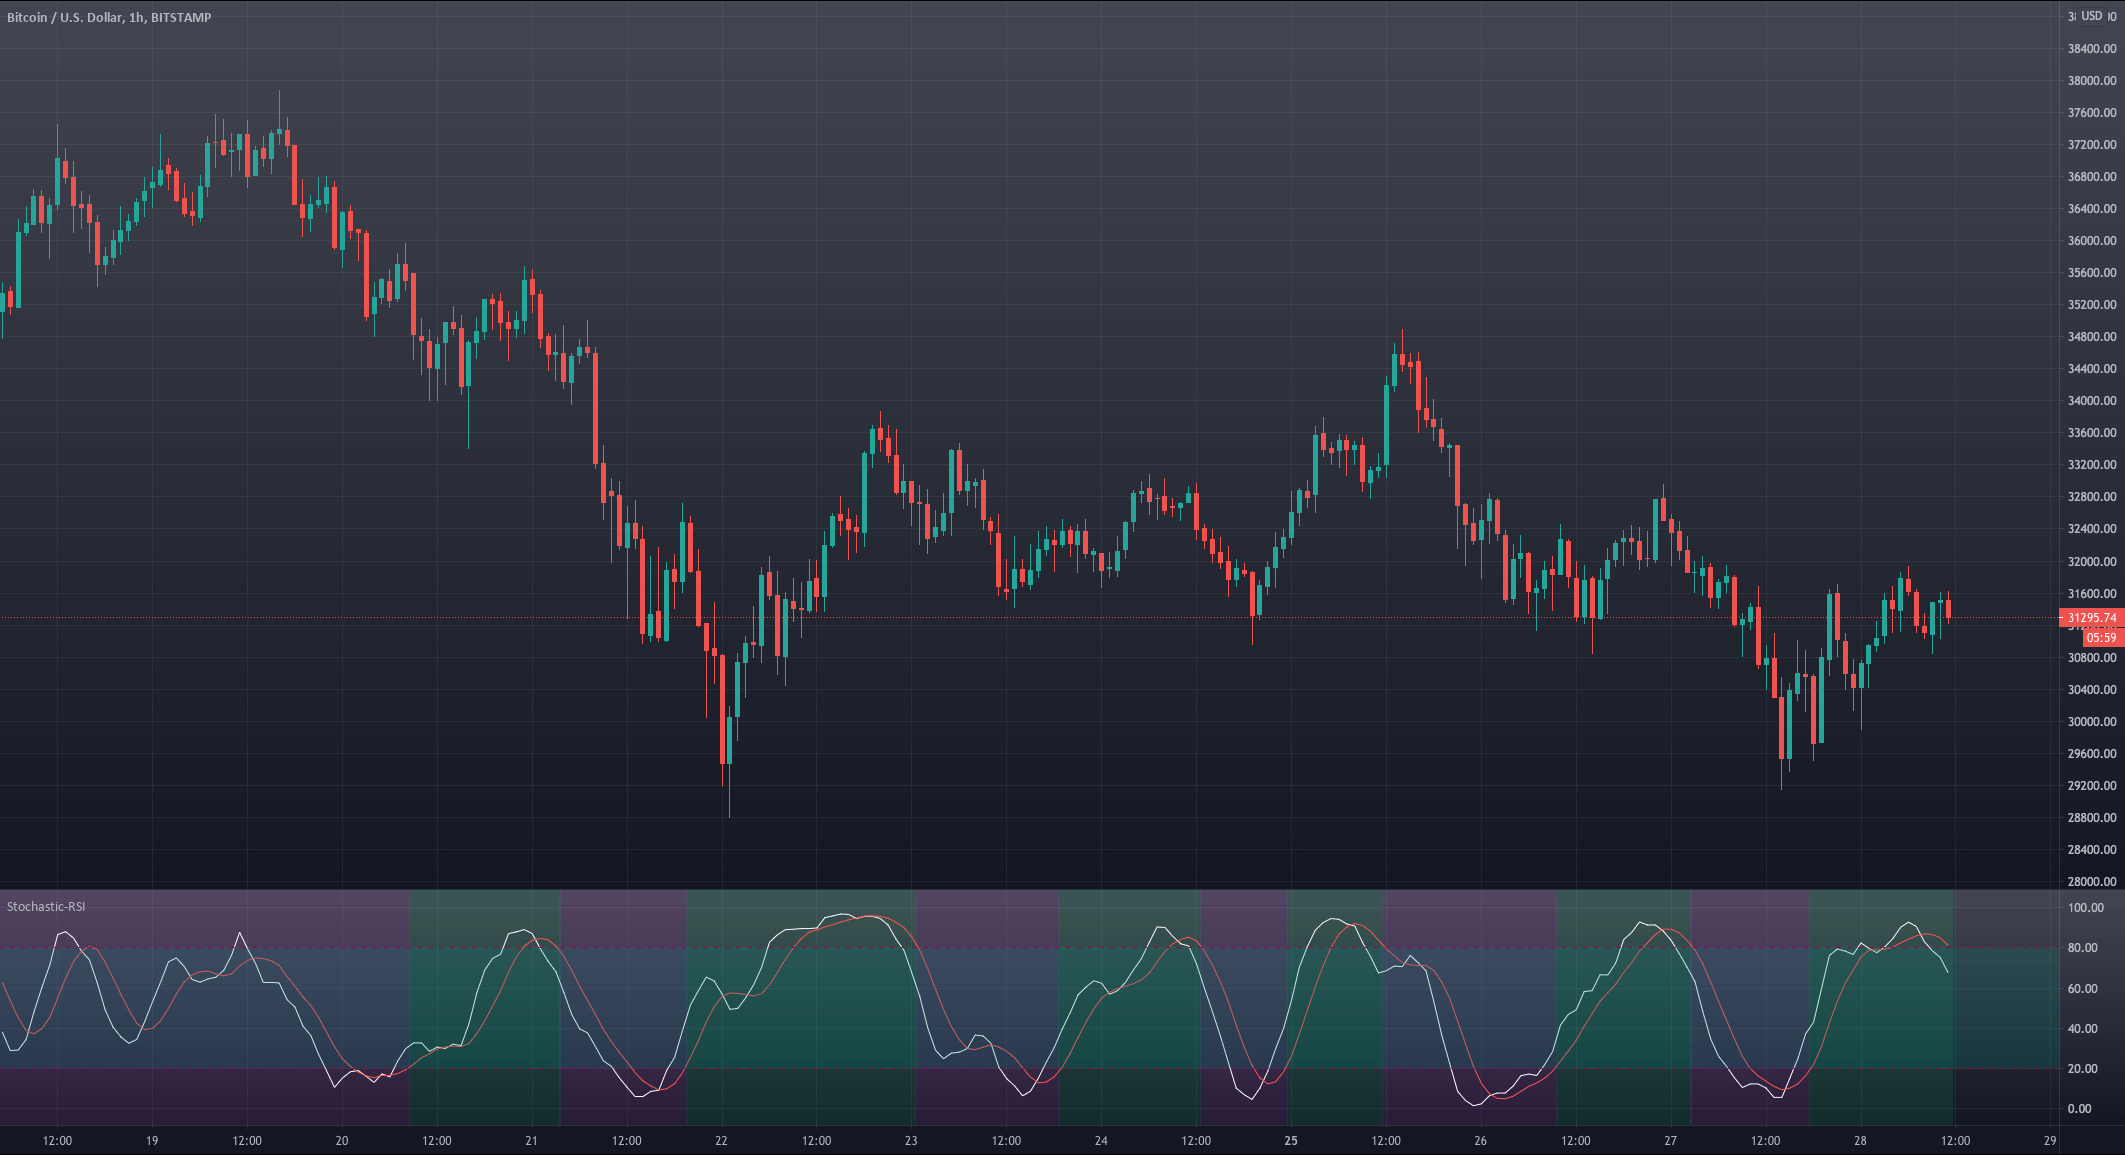
Variant 3 lags the turning points slightly, but this quality makes it more robust, as, on most occasions, it’s right about the market direction. This signal, combined with the right take-profit, may create a high-probability trade strategy.
Let’s try this one. But this will be resolved in our next and last article of this series.
Stay tuned!