
Introduction
As discussed in the previous lesson, a breakout is the price action that goes above or below a significant level on the price chart. As a breakout trader, we must enter a long position after the price breaks above the resistance, and enter a short position after a price action breaks below the support. After the breakout, the volatility of the price tends to increase as most of the traders prefer entering the market to ride the upcoming trend.
There are different types of breakouts, such as channel breakout, head and shoulder breakout, triangle breakout, flag pattern breakout, etc. In this lesson, we have shared a few of the breakout strategies that you can use to trade the Forex market effectively.
Resistance Breakout
The below price chart represents a Resistance breakout on the NZD/JPY Forex pair.
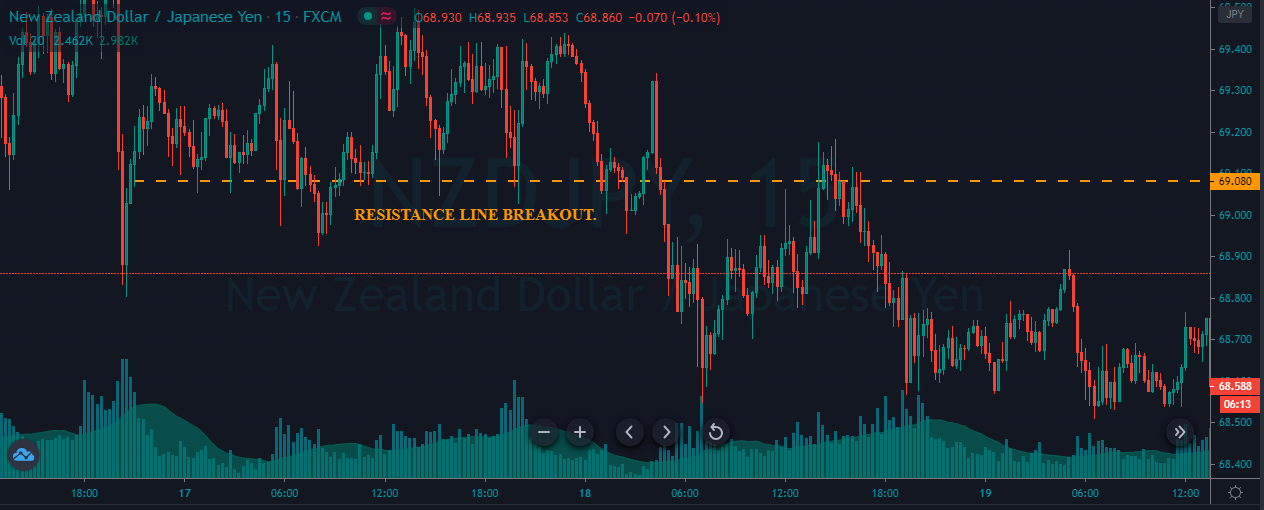
It is evident that the market was quite volatile, and after the breakout, it just goes down. So during the breakout, there was no entry. The price action then came back to the resistance area, and we ended up going short in this pair. The take-profit was placed at the most recent lower-low. We chose the most recent lower low because both the parties were strong, and we expected another buying push. You can go for a brand new lower low or higher high as well. Always place the stops just above the support area.

Support Line Breakout
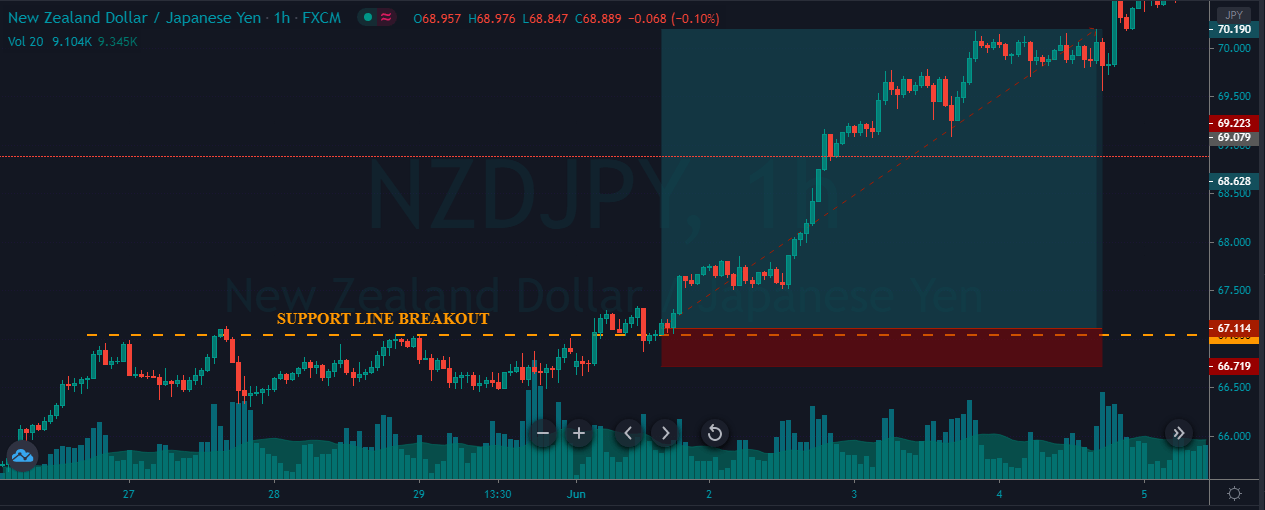
The below charts represent our buy entry in the NZD/JPY Forex pair.
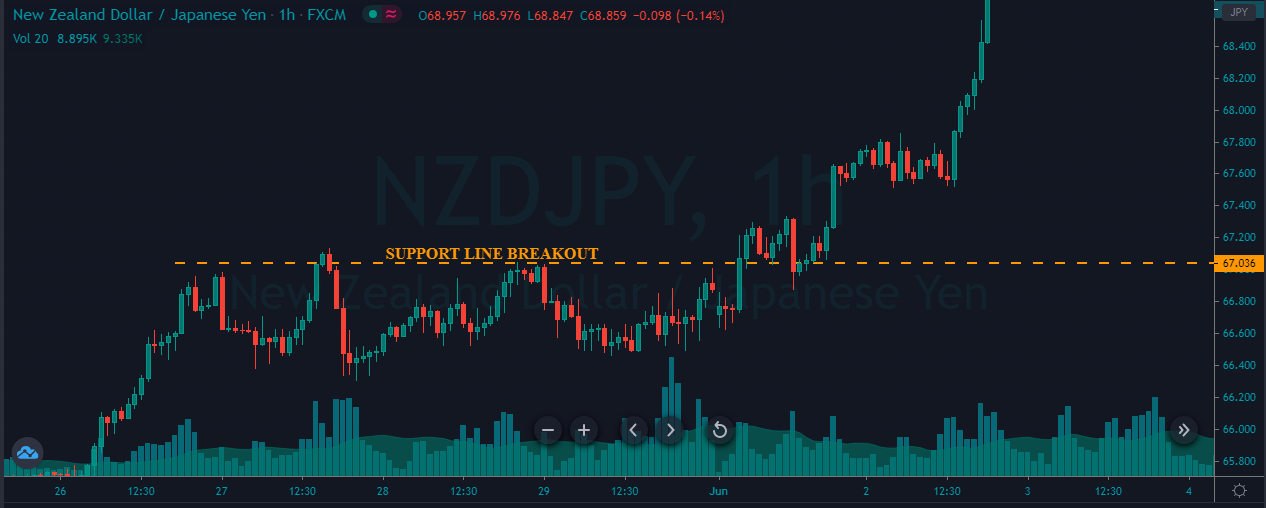
As you can see below, we took a buy entry when the price action broke above the significant support area. Right after our entry, the market just blasted to the north, printing a brand new higher high. The reason why the market moved so much is because of the overall buying trend being super strong.
It is a common perception that support and resistance are just significant levels, but they do not provide good trading opportunities, but this is not true. If we filter out all the bad signals and only trade the S/R signals when the price action is strong enough, those trades often provide an excellent risk to reward ratio trades.
Swing High Breakout
The image below represents a swing high breakout on the daily chart.
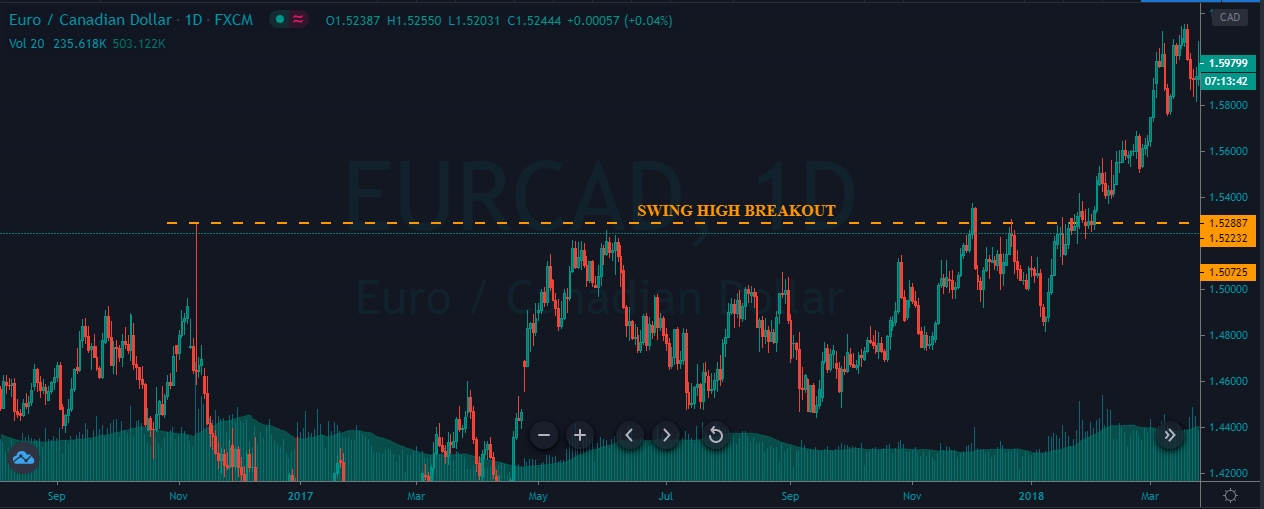
Swing high Forex strategy is specially developed for the higher timeframe traders. We look for the breakout of the most recent higher high. Most of the time, the higher timeframes takes nearly 2 to 3 months for a complete pullback. So to break the most recent higher high, the price action needs a lot of power in order to print a new higher high.
The moment we get a new higher high, it indicates the strength of the buyers, and we must expect the formation of a brand new higher high. In the below image, we took the trade at the breakout of the higher high, and trade it took nearly two months to hit the take profit.

Swing Low Breakout
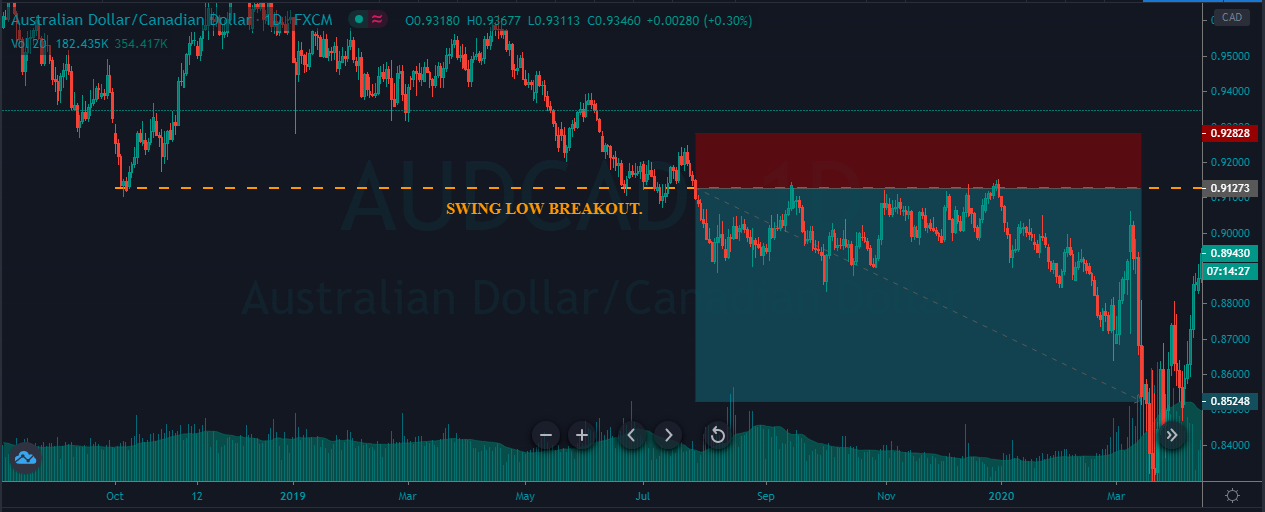
The image below represents the breakout of the swing low on the AUDCAD Forex pair.
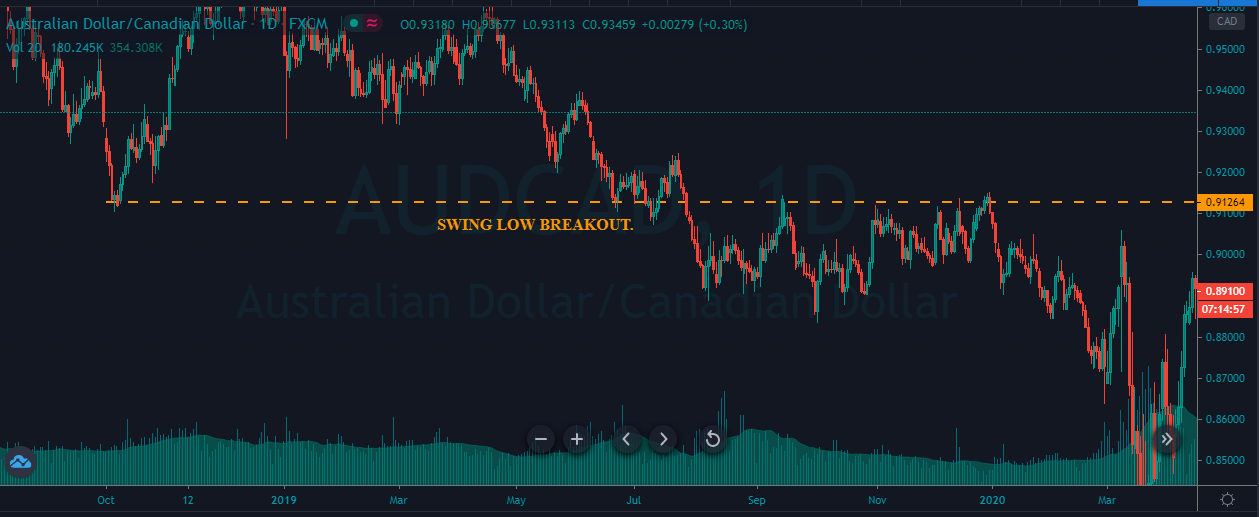
As you can see, we took a sell-entry in this pair when the price action broke the most recent lower low. After our entry, price action didn’t blast to the north. Instead, it goes sideways for a couple of months and finally printed a brand new lower low.
Flag Pattern Breakout
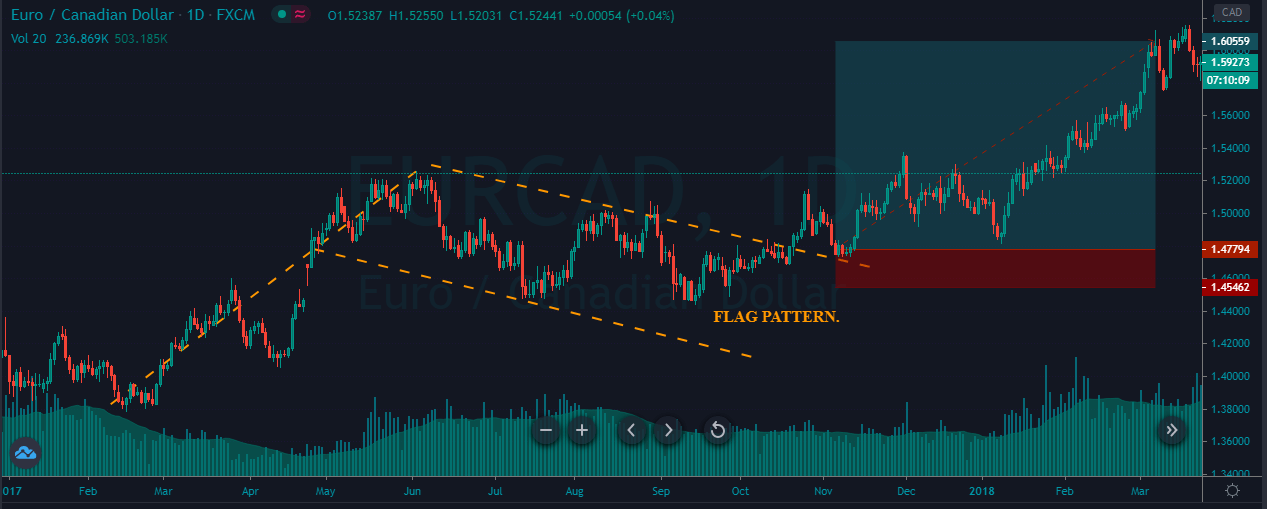
The image below represents the price breaking the Flag pattern in the EUR/CAD Forex pair.
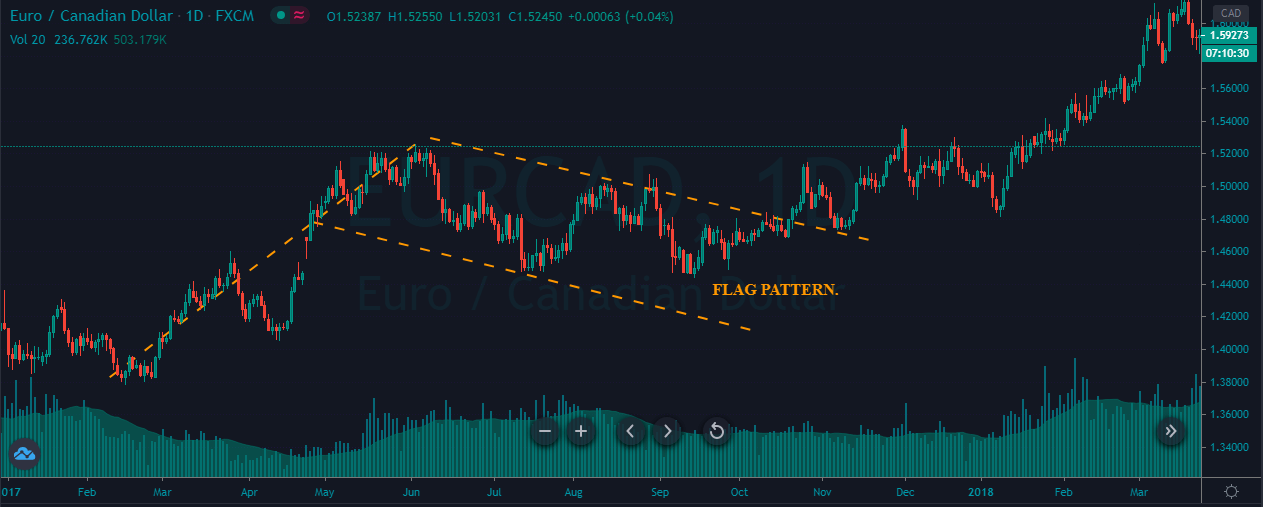
The Flag pattern is the most common and widely used to trade potential breakouts. Basically, the appearance of Flag indicates a trending market situation, and a breakout of the pullback will be a great idea to go for the brand new higher high. As we can see, after our entry at breakout, price action went north and prints a brand new higher high.
Channel Breakout
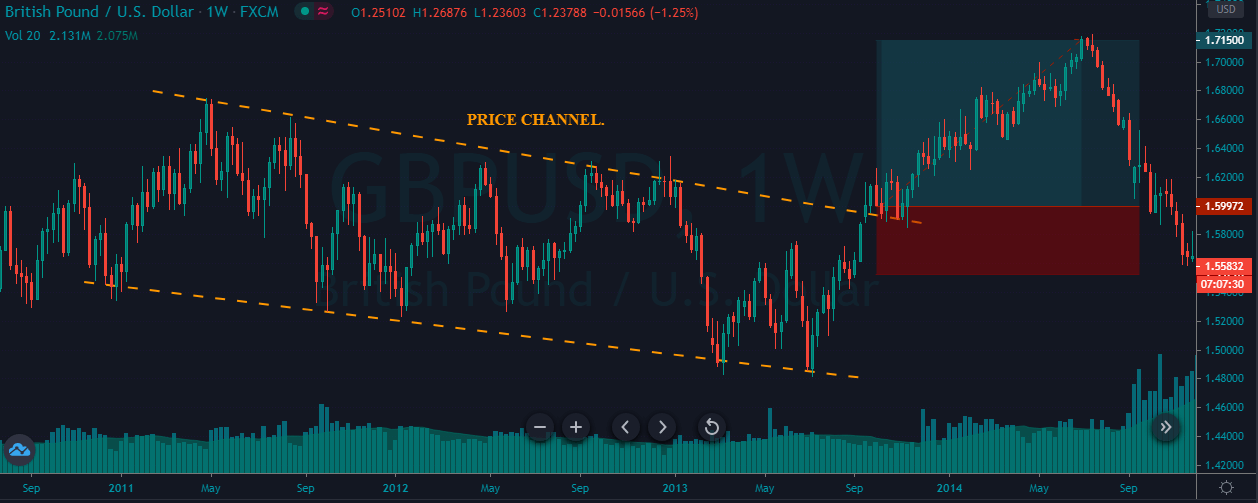
The image below represents a channel breakout in the GBPUSD Forex pair.
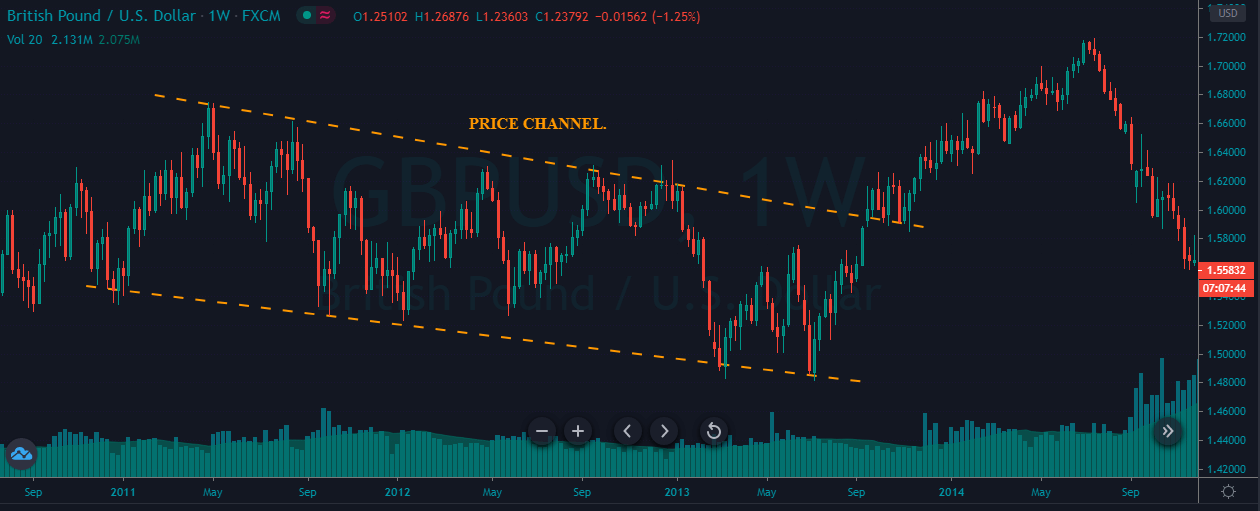
We can see the price struggling to make any significant moves and hence formed a channel. After the buy-side breakout, the price went in the north direction, forming a brand new higher high. While trading channel breakouts, it is good enough to place the stops below the breakout line. Since the breakout line acts as a dynamic support and resistance level, the price it needs an immense amount of power to break that level. So placing our SL-order there, is a great idea.
That’s about different types of breakouts and how to trade them. If you have any questions, please let us know in the comments below. Don’t forget to take the quiz before you go!
[wp_quiz id=”82725″]