The Resistance and Support Zones Indicator was published back in July 2016 by Filipe Acerbi, a creator who has other products available such as the Price Pressure indicator. A few months after being published, the Resistance and Support zones indicator was updated and it now offers its 1.3 version. Keep reading to find out more about this indicator and how it can be used to maximize your profits when trading.

Overview
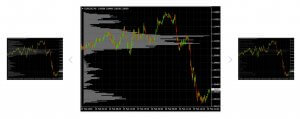
This indicator makes use of a mechanical approach to recognize resistance/support zones and simultaneously assess their level of strength resulting in a clear indication of which price zones are more important to the trader than others. According to Acerbi, the creator, this indicator was created to try and eliminate subjectivity rules when drawing support/resistance zones.
The price action can perform a breakout or a reversal when it reaches a particularly important price zone and this creates great trading opportunities. To be able to do this, the indicator is programmed to search for tops and bottoms to build the support/resistance zones. Those making use of this indicator can set the top/bottom parameter themselves. Apart from recognizing these resistance/support zones, this indicator also assesses the strength level of each price zone identified.
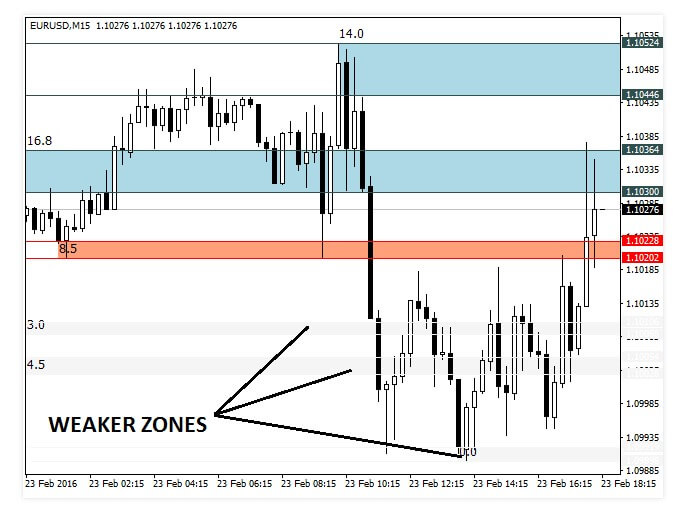
The strength of these zones is measured by analyzing the price action when the market reaches that particular price zone. Price zones with higher levels of strength means that price actions will correspond powerfully to this price area. The level of strength and weakness for each zone is outlined on a chart. Traders making use of this indicator can also apply a Strength Level filter and as a result, the indicator will smooth out the weaker price zones.
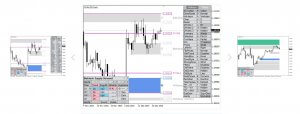
The indicator uses a number of criteria to define the level of strength of each price zone such as; how many times the price reacted strongly to the specific price zone in the recent past, how many times the price zone worked as a barrier to the price advancing and also how many times the price used this area as a support. For those who feel that the set-up is a bit too busy, they can manually turn off/on any specific price zone by clicking on the checkbox.
This indicator has a number of key features apart from those we’ve already mentioned such as; it works on every symbol and timeframe, it can be used in conjunction with higher time frames, price zones can be compared and traders can turn their focus onto the stronger ones and it also has accessible buffers for EA developers.
Service Cost
This indicator can be purchased for $50 and it is also available for rent at $10 a month. Those interested in trying out this indicator before purchasing it can do so by downloading the free-demo, this is only available to those who have the MT4 platform already downloaded onto their device.
Closing
An online review that we found stated that this indicator is not worth the $50 as similar indicators are available for free, however, we also found some comments which praised this indicator. It would be a good idea to test out the demo version to determine whether this indicator could be beneficial to your trading or not before spending the money.
This Forex Indicator is currently available in the MQL5 marketplace: https://www.mql5.com/en/market/product/17525