Know your market, know your levels
The financial market includes the forex market, derivatives, Bitcoin, commodities, gold, oil, stocks and indices, and bonds. They are all interconnected in many ways, with investors coming out of one aspect due to perceived risk and diverting some or all of their portfolio into another aspect of the financial market. This makes the financial markets more fluid and often more volatile.
A lot of new traders make the mistake of learning a little bit about the forex market, opening up a trading account, and then shortly after having a punt on another market such as gold or stocks and indices. Often with horrendous results.
While it is imperative that traders quickly try to comprehend how these markets are interwoven and what affects what, it is advised that in the early days of trading, new traders learn to stick to one aspect of the market at a time.
Example A
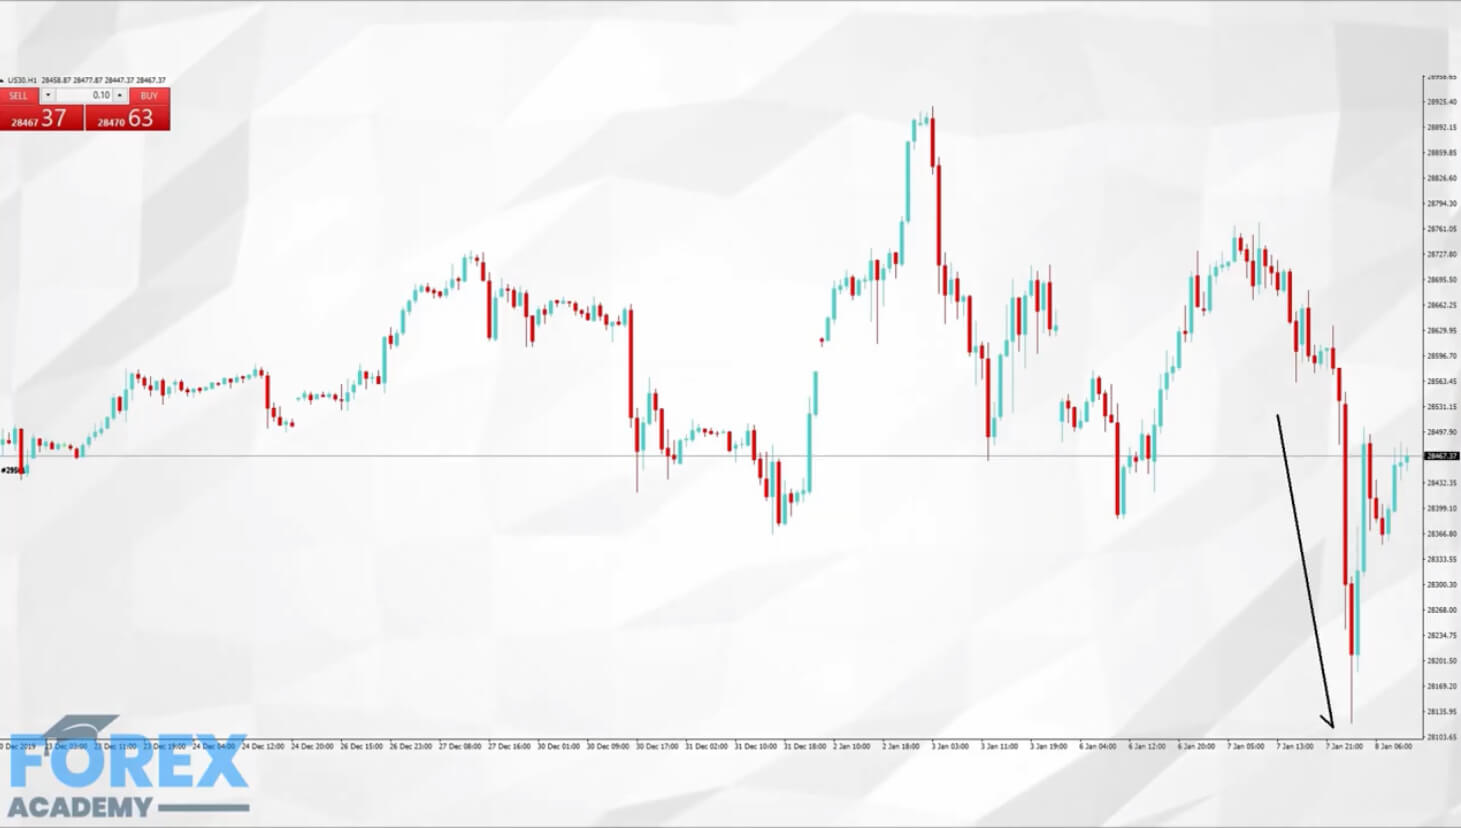
This shows a 1-hour chart of the Dow Jones 30 index. A black arrow marks an area where the market was heavily sold off during the Asian session.
Example B
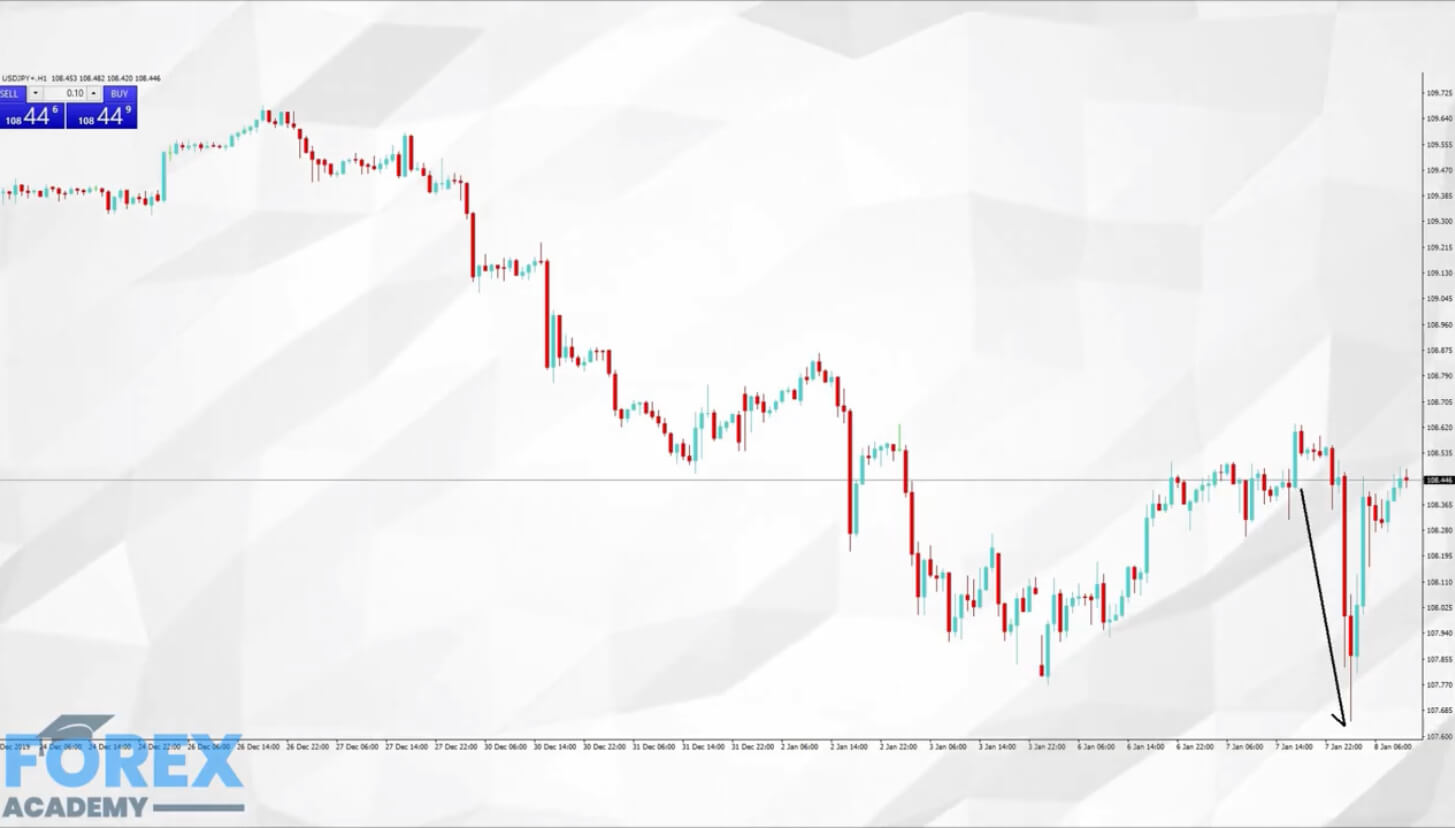
If we now look at example B, we can see that the US dollar Japanese yen pair was simultaneously being sold off to lower levels. In actual fact, what was happening here was that due to the Dow Jones being sold off, traders were buying yen because this currency is perceived to be a safe haven currency.
This is just one example of how these markets are interwoven. But, it proves to be a very short and important lesson with regards to not understanding the risk of trading one asset, such as Forex, without focusing on potential risks of another asset, in this case, the DOW index.
Incidentally, if we now revert back to example A, we can see that after the sell-off of the Dow Jones, there was a bounce higher in the index, and If we also now revert to example B, we can see that US dollar-yen also reversed from its lows and moved higher.
This also shows that the Dow Jones and US dollar-yen pair are almost moving in unison; they are acting in a way that the market calls correlation.
One of the biggest mistakes that new traders make is to flit from one trading chart to another and from one currency pair to another, without appropriately evaluating the exchange rate levels.
The best way to understand these moves is to read charts from left to right because it tells a story. New traders must learn to understand why price action hits certain key levels and whether this is associated with fundamental or technical reasons. By getting a full grasp of the reasons for currency moves new
traders will more easily be able to identify trading levels and then, of course, adjust their trading around them.


