Introduction
A Bollinger band is a technical indicator used to find the trading opportunities, and it traces the market volatility. The indicator is developed by John Bollinger, and the bands are placed above and below the moving average. The volatility is purely based on the standard deviation, which changes as volatility increases and decreases. The bands of the indicator widen when the volatility increases, and it contracts in the less volatile market. Most of the traders used the 20-period moving averages for the default settings you can use them, or you can adjust them according to your trading style. Most of the traders think that the Bollinger bands only measure the market volatility, but it is not true, the indicator also provides a lot of useful information such as:
- Trend continuation and reversal.
- Possible tops and bottoms.
- Period of the upcoming volatility breakouts.
- The breakout trades above and below the bands.
- Buy and sell trades when price action hits the upper and lower band.
- It also identifies the market consolidation.
Before diving into the trading strategies, we want you to read the below-mentioned facts about the Bollinger Bands.
- John Bollinger CFA/CMT is the creator of the Bollinger Bands.
- The indicator consists of three lines where price fluctuated around.
- The indicator is the excellent tool to understand how widely stock swings from peaks to valleys.
- Do not spend your time to test the random configurations; instead, go with the default settings.
- In order to make money ride the Bollinger bands, go long when prices approach the lower band, and go short when price action approaches higher band.
- If you desire better signals, then find out the trending markets and wait for the pullback near to the centerline, this honestly is the most profitable approach to print cash.
- Filter out the low profile trading signals by pairing the indicator with the other technical tools.
- Bollinger bands perform very well in ranging conditions, look for buy when the price hits the lower band, and look to short the currency when prices hit the upper band.
- A single candle outside the band does not mean that the breakout occurred; most of the time, price action immediately came back to wait for the hold outside the band.
- The indicator works in all the type of markets either it is equity market, forex market, futures, or options.
- The best book on the indicator is written by the John Bollinger “Bollinger on Bollinger Bands.”
- The bands work very well on all the timeframes; even this indicator is one of the favorite indicators of the scalpers.
BOLLINGER BANDS TRADING STRATEGIES:
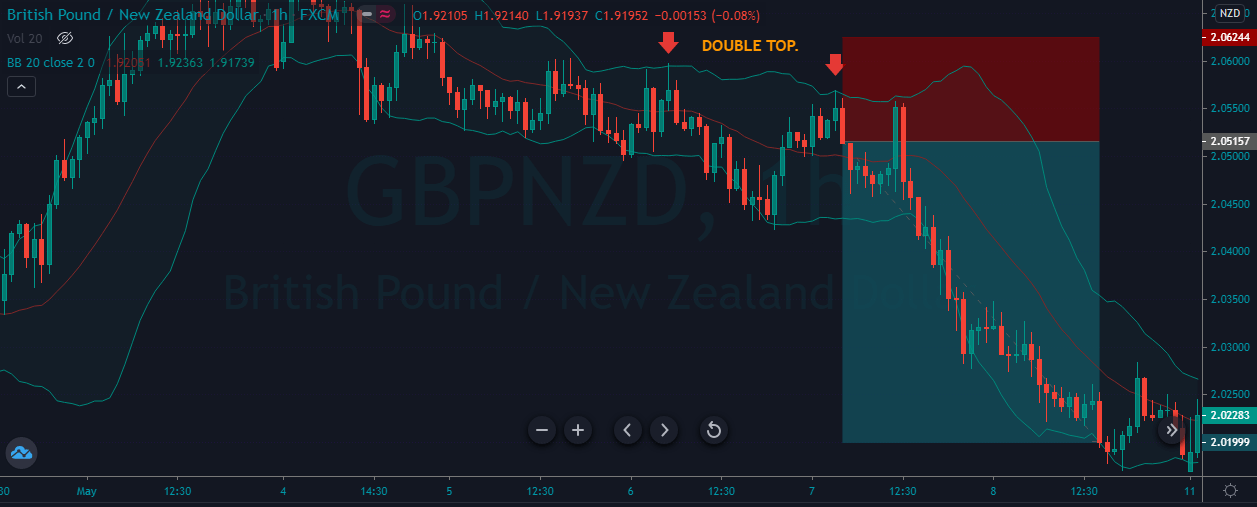
DOUBLE TOP.
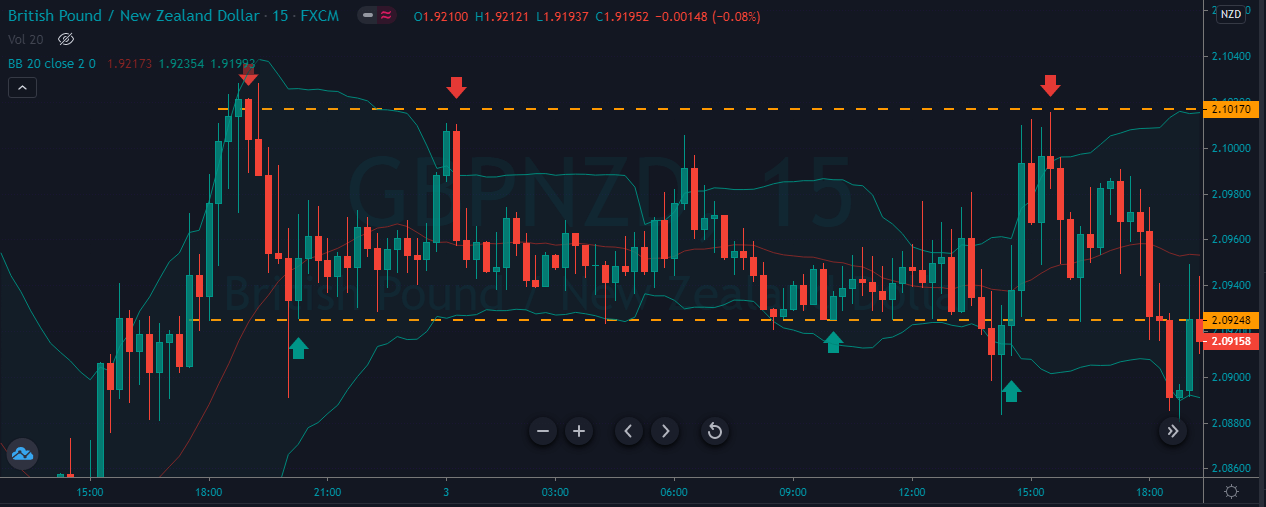
The image below represents the double top on the GBPNZD forex pair.
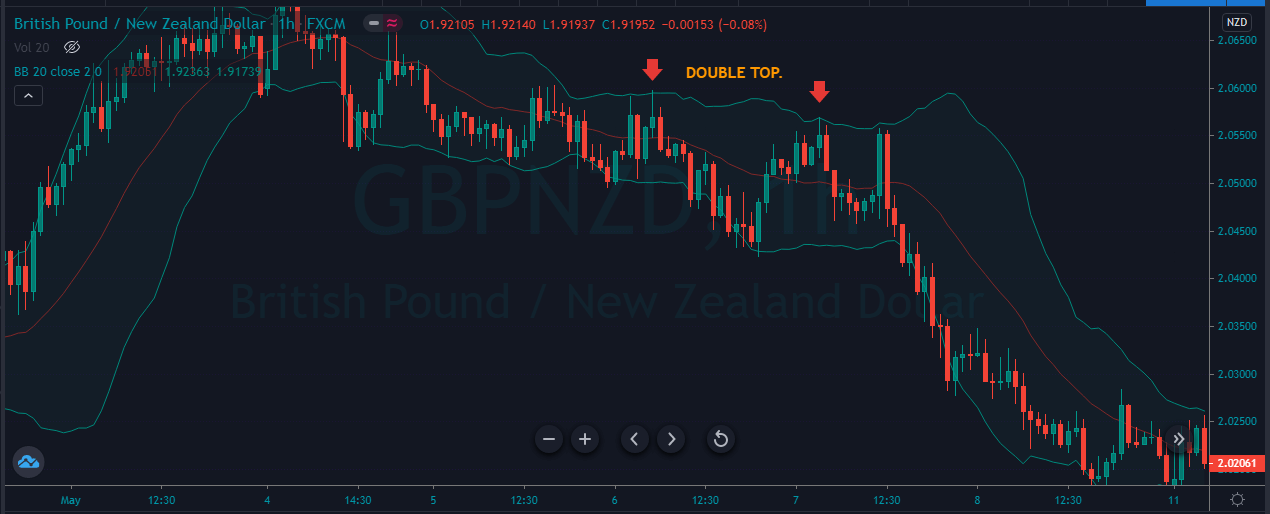
As you can see in the image below, the pair represents the entry, exit, and stop-loss in the GBPNZD forex pair. The trade below represents the double top pattern by using the Bollinger bands. The double top is simply a trading pattern where the buyers try twice to break the major level, and the failed to do so; as a result, we got the reversal. In the image below, the pair was in a strong uptrend both of the time buyers tried hard to break the Bollinger bands dynamic resistance level, but they were unable to break the level. When the price action respects the second top, it was a sign for us to go short in this pair. The stops were just above the entry, and for taking profit, we choose the brand new lower low.
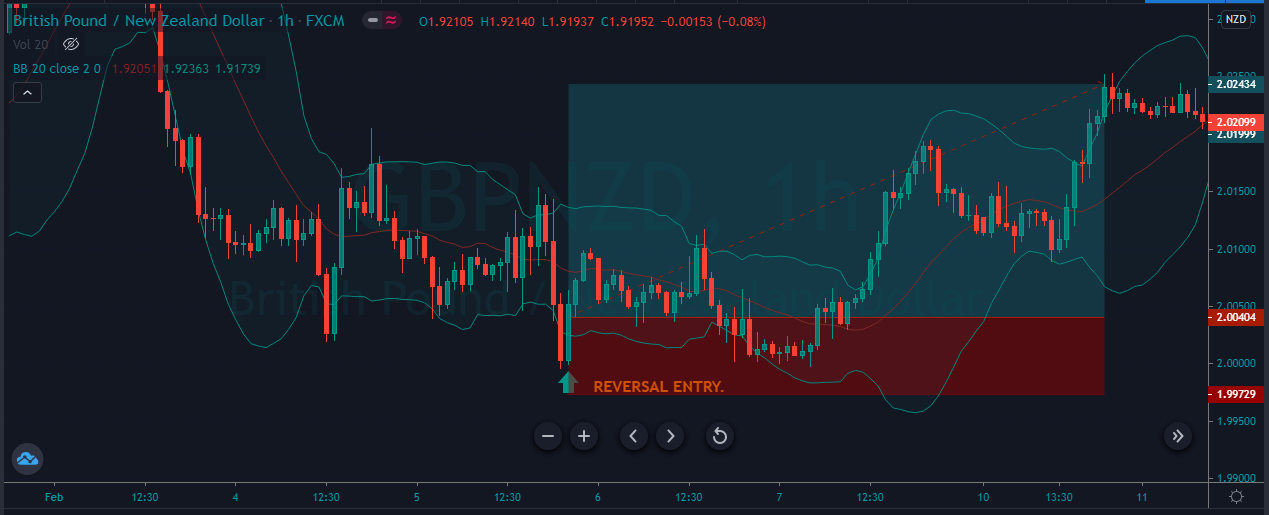
REVERSAL STRATEGY.
The image below represents the reversal pattern on the Bollinger bands forex pair.
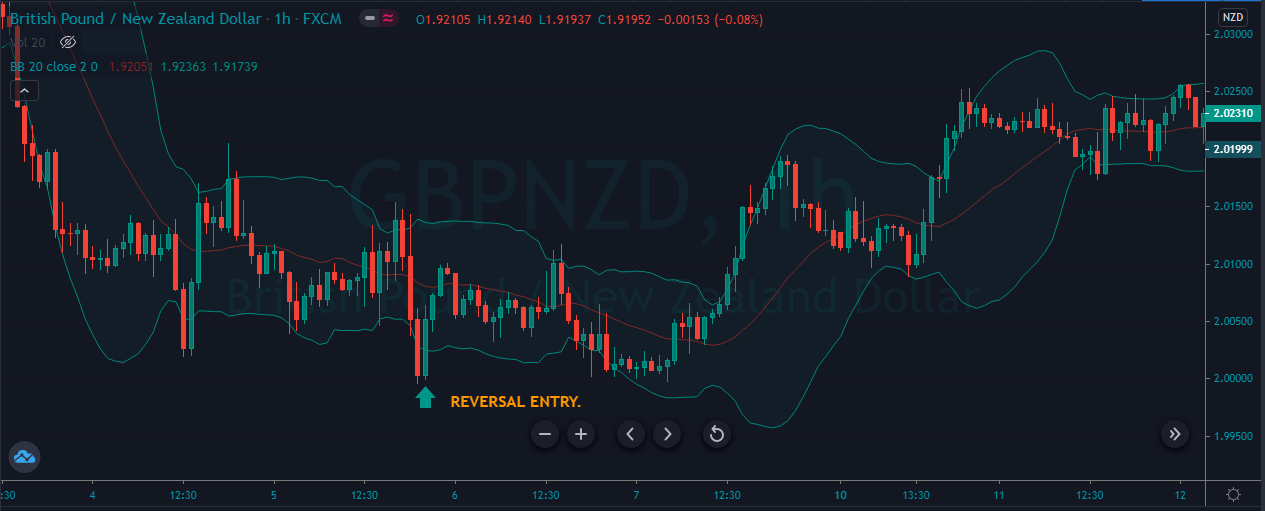
As you can see in the image below, it represents the entry, exit, and stop-loss in this forex pair. The reversal pattern is when the price action breaks below the Bollinger bands and then immediately came back. Some traders called it railroad pattern or fakers or even spikes; no matter what you called it in the end, the pattern represents the upcoming reversal. When the price action prints the pattern, we immediately took the buy entry for the brand new higher high.
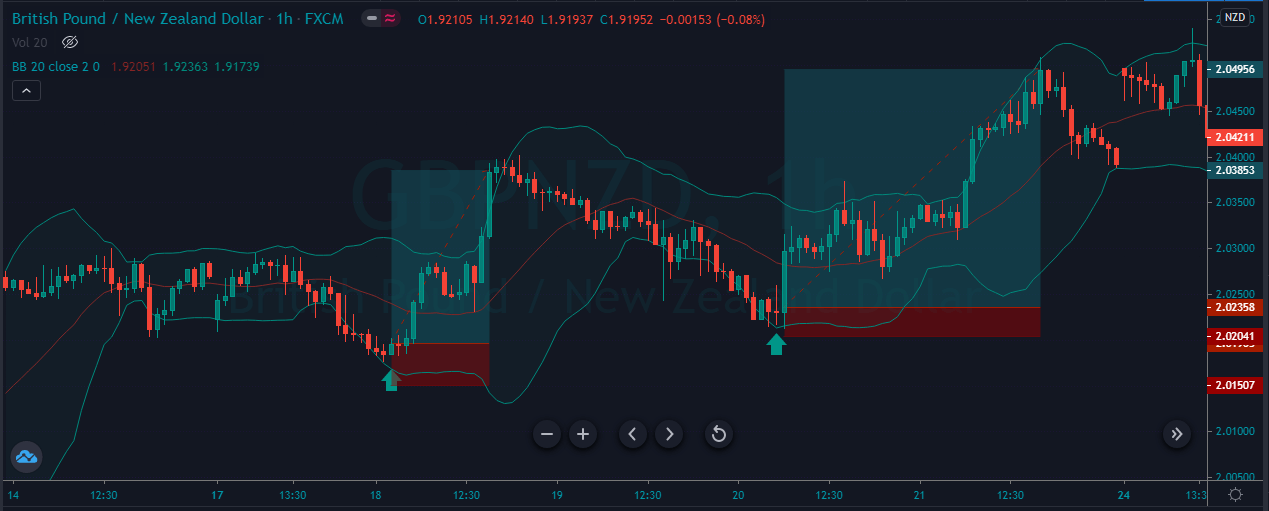
BUYING AT THE LOWER BAND.
The image below represents the two buying trades in the GBPNZD forex pair.
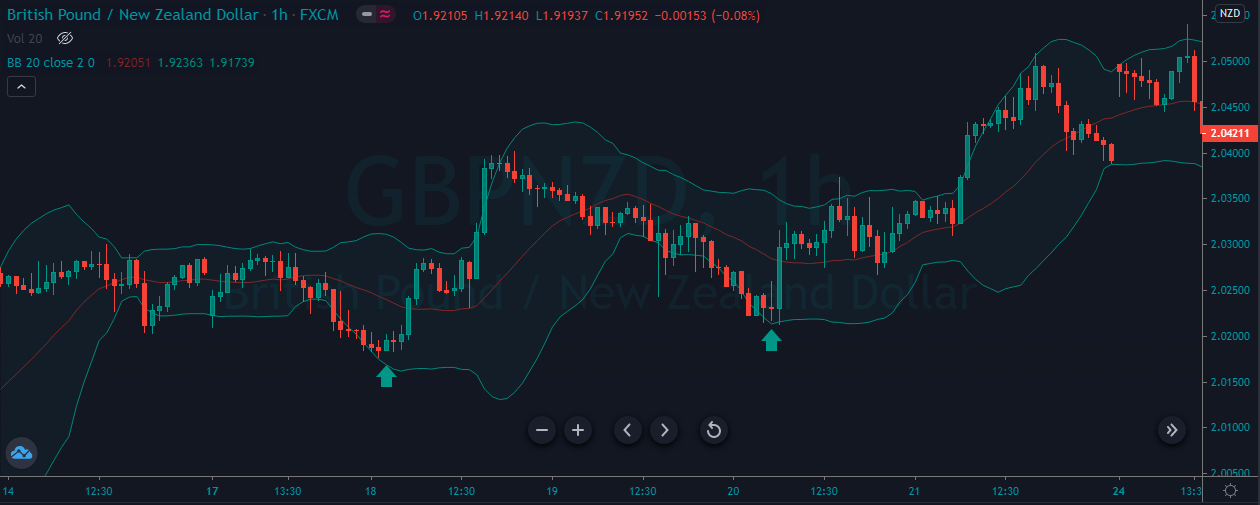
As you can see in the image below, it represents the entry, exit, and stop-loss in the GBPNZD forex pair. This is one of the simplest and most effective trading strategies used by intraday traders. As you can in this one, we choose to trade the lower band because we choose to follow the trend of the market. In a trending conditions market often goes into one side for an extended period of time, even on the face of the opposite party. So whenever you choose to trade the Bollinger upper and lower bands, then look at the market flow first, and only place the trade in the direction of the market flow. In the below image, we took two buying trades in an uptrend; both prints the brand new higher high, and stops were just below the entry.
TRADING THE RANGE AGGRESSIVELY.
This approach works very well for the aggressive traders only because here, we choose to go long and short when the price action hits the lower and upper band as well as the support and resistance level. As you can see, we took three aggressive buys and three sell trades. You can trade the ranges in this way and always go with 1:1 R: R trades.
TRADING BELOW THE MIDDLE BAND.
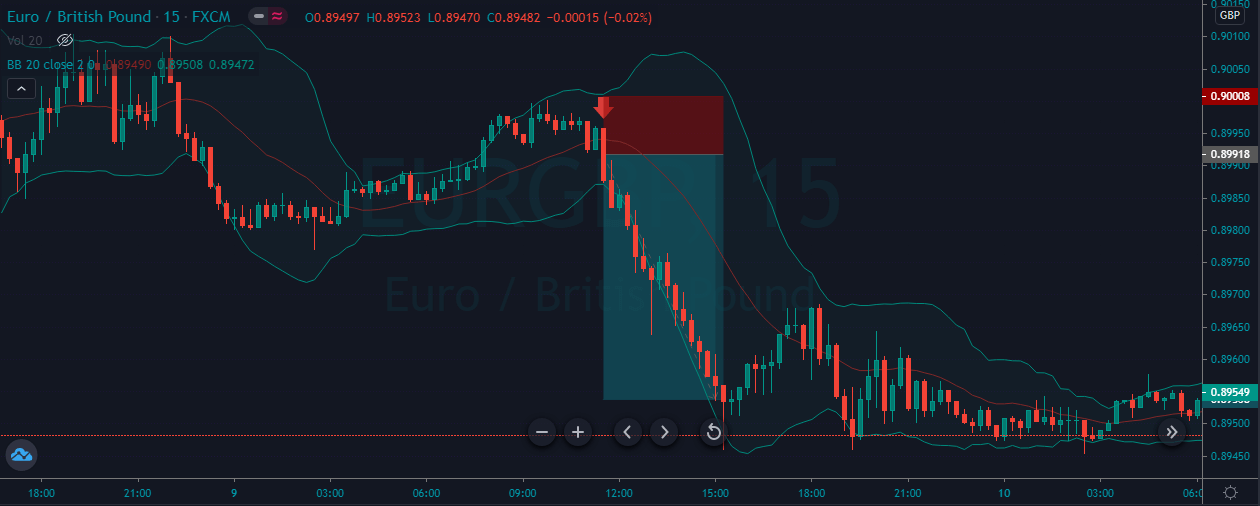
The image below represents the selling trade in the EURGBP forex pair.
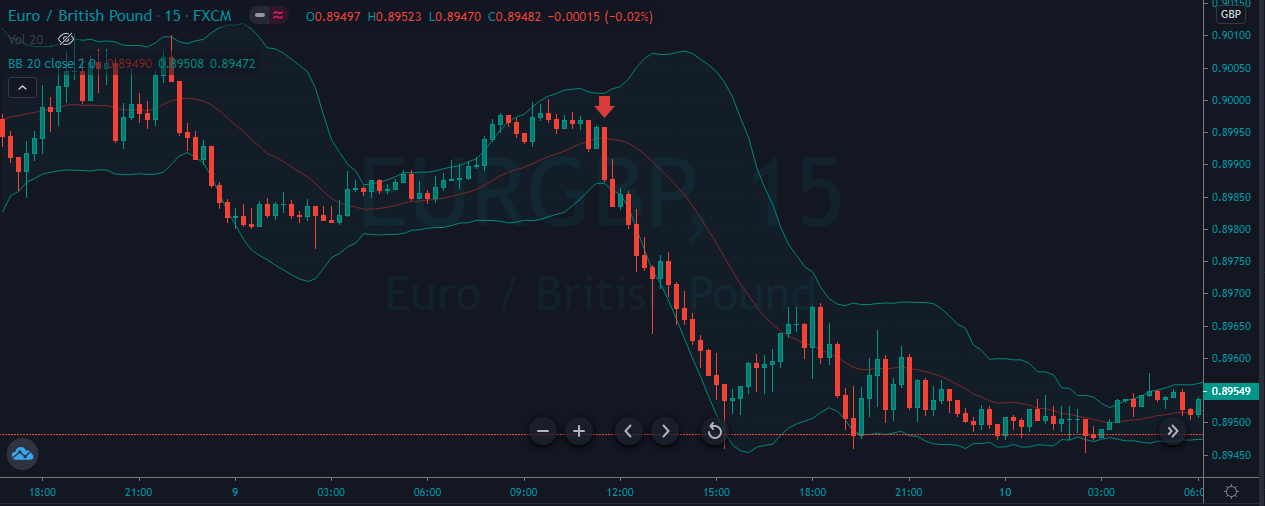
As you can see in the image below, it represents our entry, exit, and profit in this forex pair. This strategy is all about the trending market, where we activate the trade when price action goes below the middle band. In the trend conditions, the middle band acts as a breakout level to trade the market. When the price action gives reversal at the upper band, it is a sign of price action to resume the downtrend, and when it breaks below the middle band, it is a sign of sellers gained enough momentum, and expect the new lower low. In the image below, when the price action hits the upper band, and the sellers break below the centerline, we decided to go short for a brand new lower low.
CONCLUSION.
Bollinger bands are a wonderful trading indicator it provides reliable trading opportunities in the market. Bollinger bands are the only indicator in the market which provides the opportunity to trade every kind of market; it doesn’t matter if the market is trending or in a range or the trend is about to finish. We can use this indicator to trade every market situation. In the article, we provide the five different trading ways to trade the Bollinger bands, you can apply all of these trading strategies, or you can choose to trade the only one or two above strategies. The choice is yours; we suggest you master the one trading strategy first then choose the second one to trade. In this way, you can quickly learn all these strategies without any confusion.