Introduction
The occurrence of divergence is considered by all types of traders, including traders who do not analyze charts without indicators. This is because divergence gives an edge to their trading strategy. In the previous lessons, we interpreted the meaning of divergence and also its different types. In this lesson, we shall put this knowledge into action, where an effective strategy will be discussed.
Trading a regular divergence
To recap a real quick, regular divergence is a type of divergence which indicates a reversal in the market. If it indicates a reversal to the upside, it is referred to as bullish divergence and bearish divergence for a reversal to the downside.
Spotting regular divergence
- Find the overall trend of the market.
- Mark the lower lows for a downtrend and higher highs for an uptrend on the price charts.
- Draw the corresponding movement on your choice of oscillator indicator.
- Determine if both prices and indicators are making the same sequences. If they are moving apart from each other, then we conclude that divergence has occurred.
Trade Example
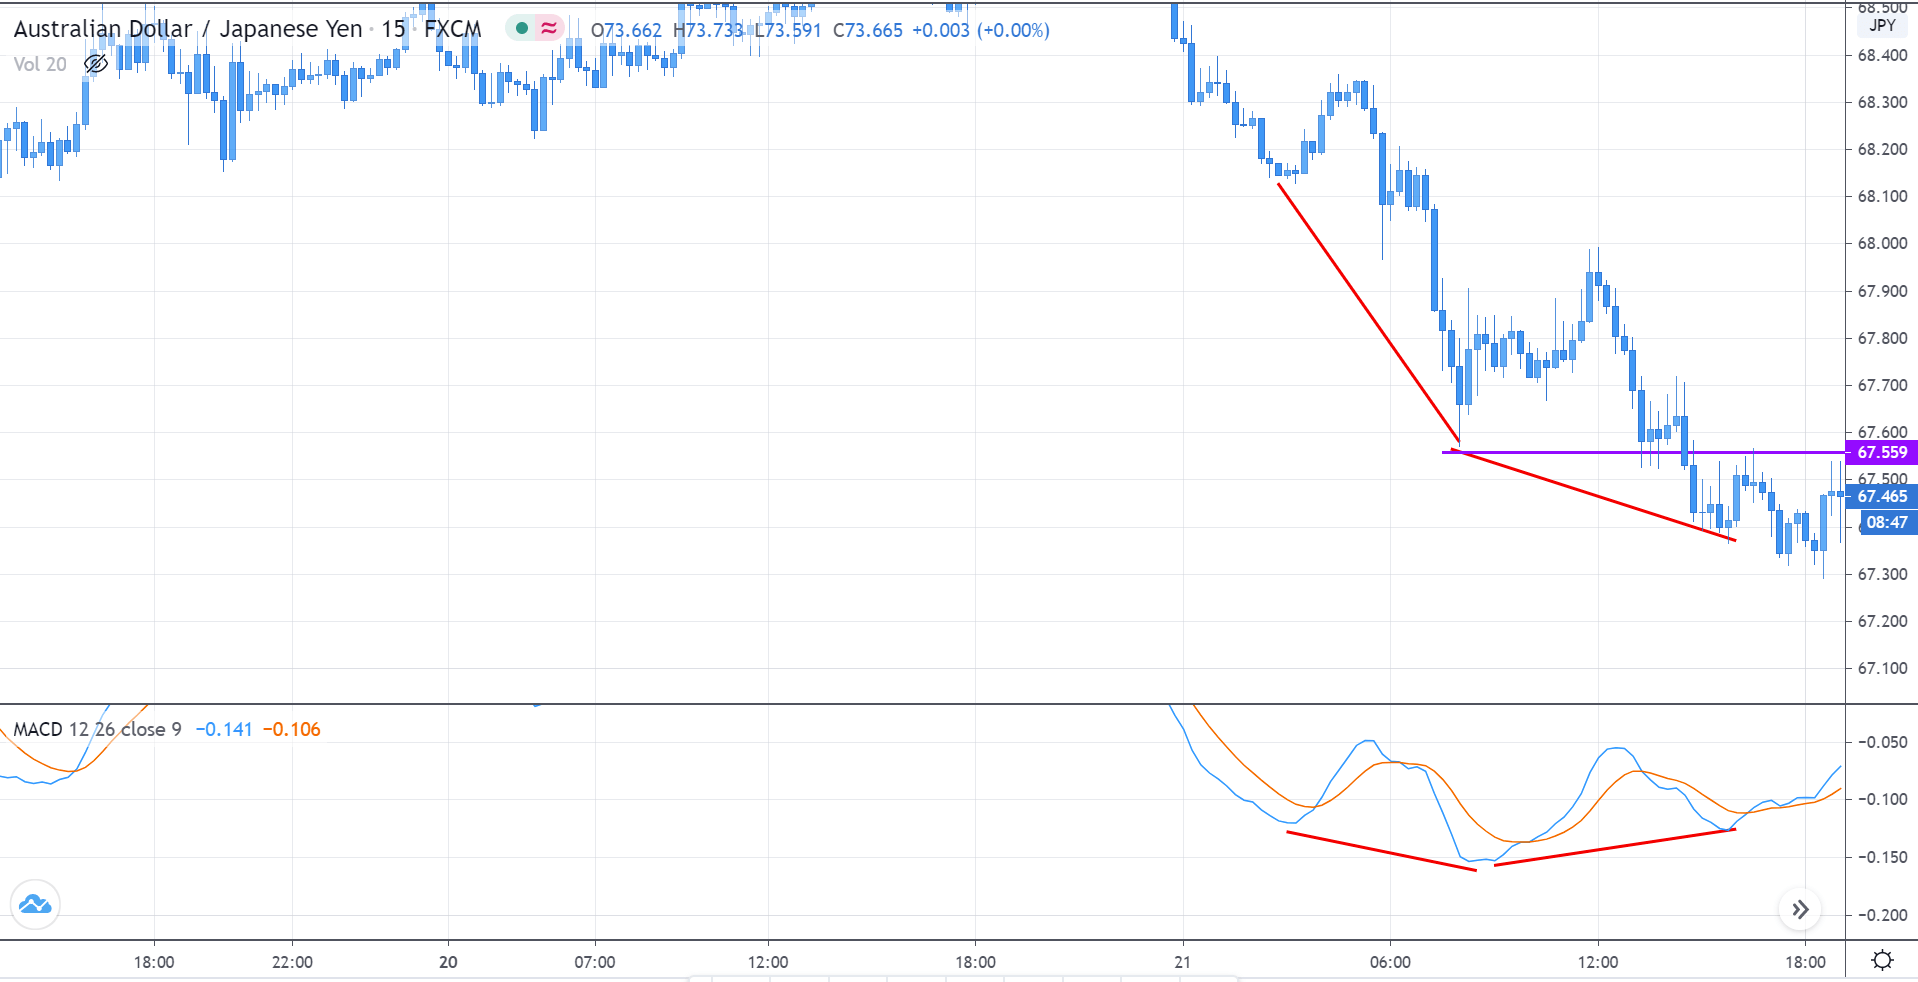
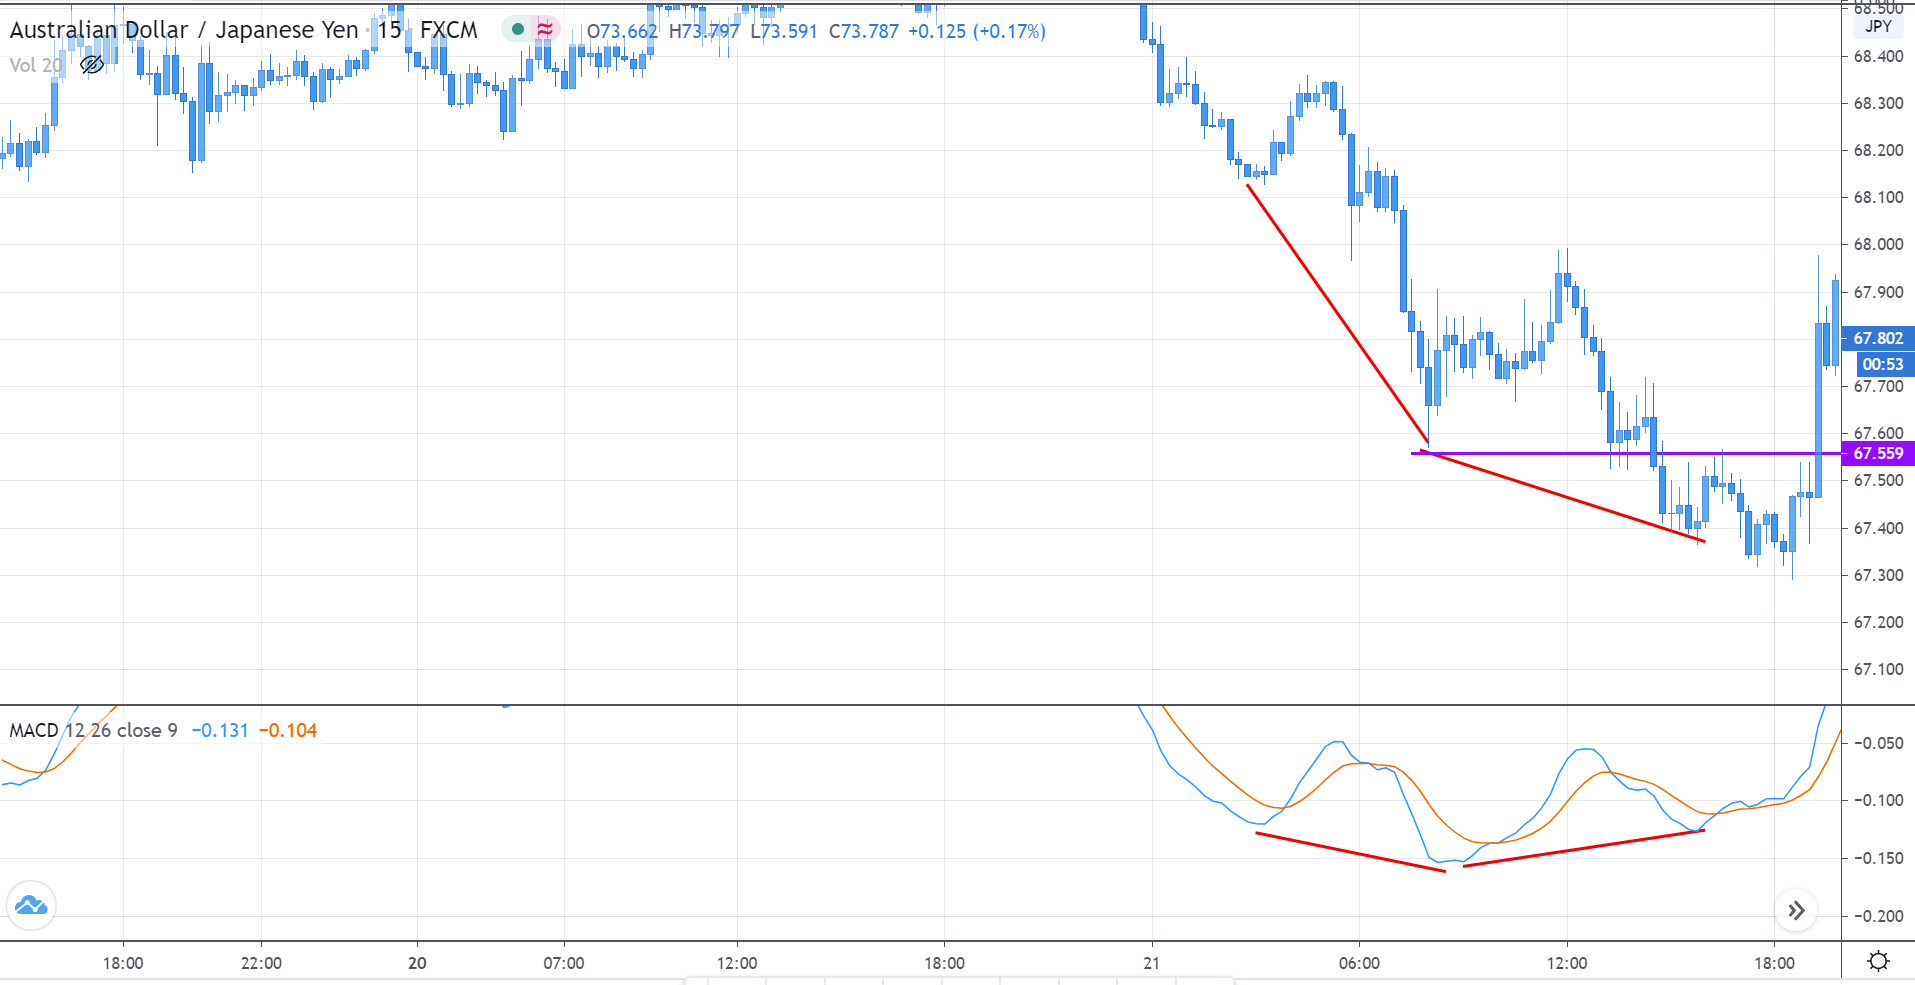
Consider the below chart of AUD/JPY on the 15mins time frame. We can see that the market is in a downtrend making lower lows. For the first lower low in the price, the MACD had a lower low as well. But, for the second lower low in price, the indicator made a higher low. Thus, showing divergence in the market.
Since this is a regular bullish divergence, it indicates a reversal in the market. But, note that divergence does not give a trading signal to buy the security. An indication of a reversal must be based on the strategy. Here are some compelling points to confirm the legitimacy of a divergence.
When divergence occurs in a pair, the first factor is to measure the length and momentum of the down pushes. Comparing the first down push to the second, it is observed that the latter is smaller in length and also took a greater number of candlesticks than the former. This is a considerable indication that the downtrend is weakening.
Secondly, observe what the price does when it reaches the Support & Resistance level (purple ray). We can see that the price touched the purple ray, tried to go below the recent low, but failed to do so. This is another indication of the sellers’ weakening.
Now that the sellers are losing strength, we wait for the other party (buyers) to kick in. In the below chart, we can see the entry of the buyers with one massive bullish candlestick. This becomes our first confirmation that the big buyers are in the market.
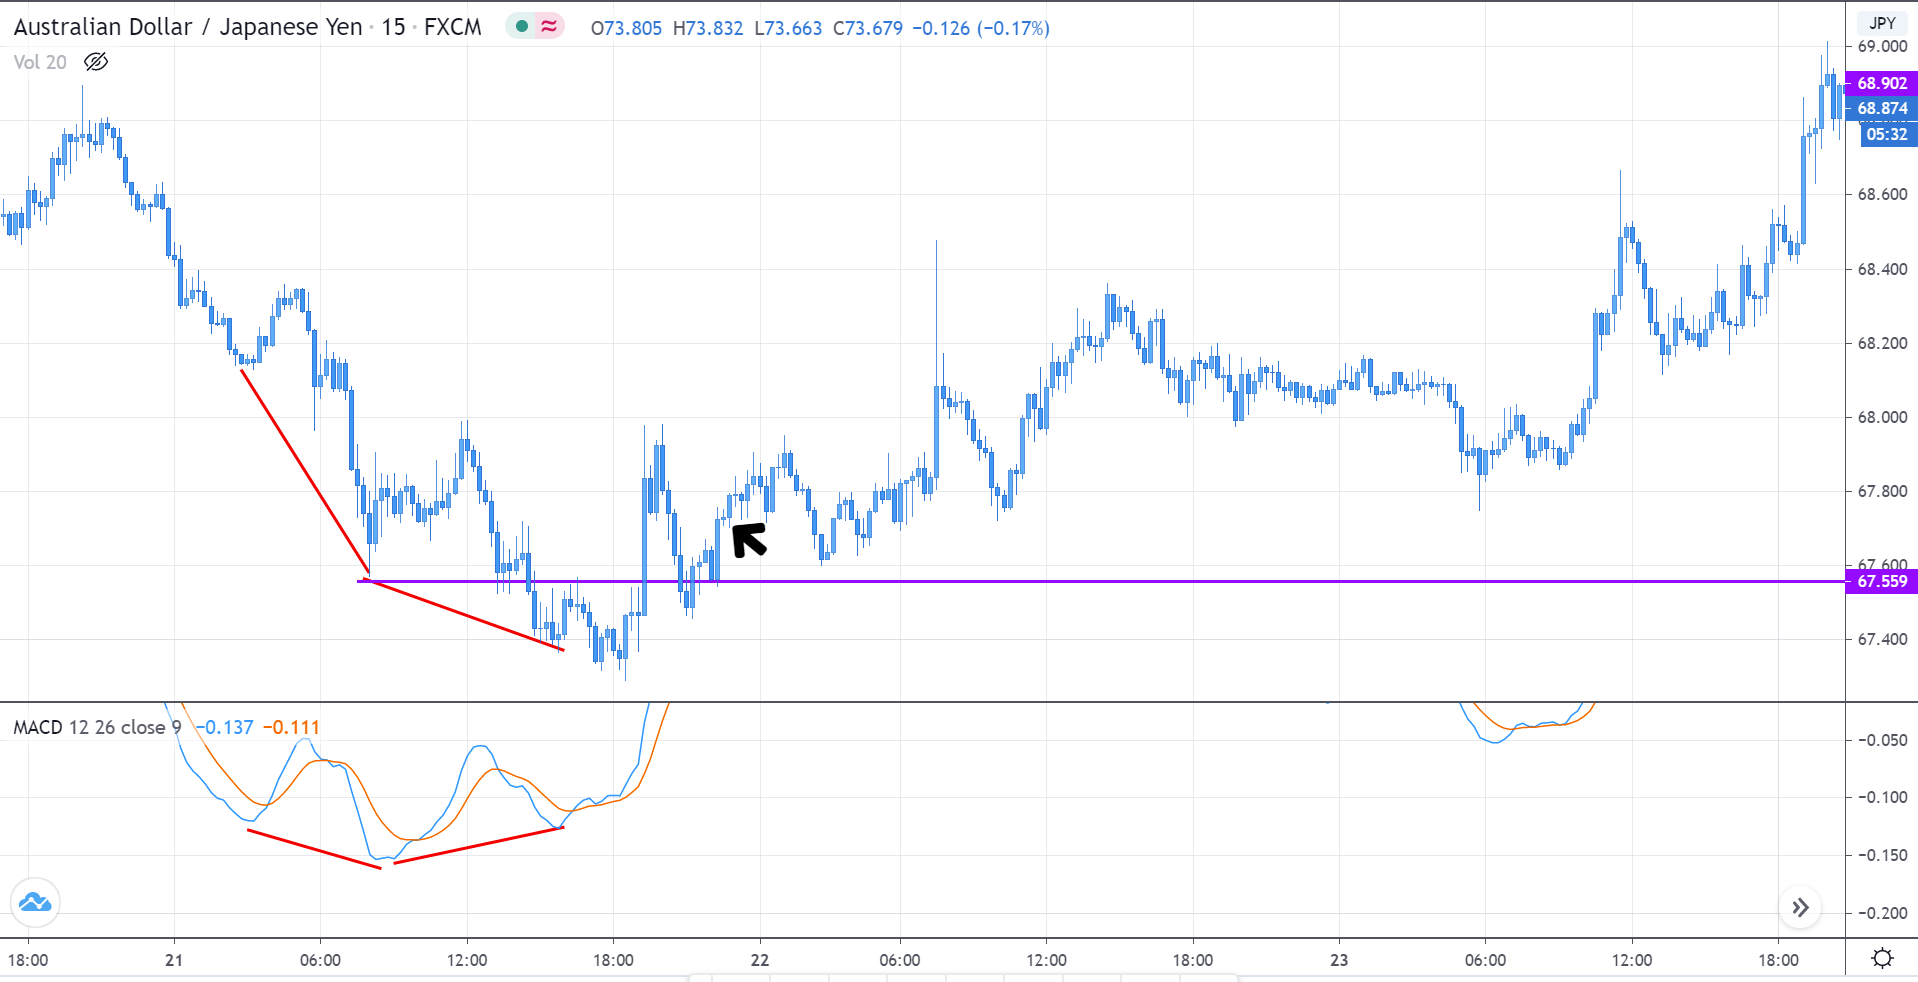
However, it is not ideal to buy right when the buyers show up because, at times, the sellers could take over and continue to make lower lows. Thus, to confirm the reversal, the buyers must hold above the S&R level (purple ray). In the below chart, we see that the price came down, tried to go lower the S&R, didn’t succeed, and held above it. Hence, this confirms that the market has prepared for a reversal, and we can go long when the candlestick closes above the purple ray, as shown by the black arrow.
As a result, we see that the market successfully reversed its direction and began to make higher highs. [wp_quiz id=”77943″]