Description
The GBPCHF cross in its 4-hour chart exposes a bearish sequence that shows bullish reversion signals and could pop-up in the following trading sessions.

The cross started its short-term downtrend on June 05th, when the price action topped at 1.2259 and confirmed the bearish bias of market participants on June 08th when the price action declined developing an engulfing formation. Once the cross bottomed at 1.1630 on June 29th, the price bounced until the previous highs zone reaching an intraday advance to 1.1712. The subsequent drop above the last lower low and the following bounce observed on the June 30th session, which reached a new higher high lead us to expect further upside.
The retrace toward 1.1714 could provide an opportunity to incorporate on the long side with a short-term target placed at 1.1837. This level coincides with the previous swing highs where the price should find resistance before to confirm a rally continuation.
On the other hand, the breakout over the descending trendline observed both the price chart and the RSI oscillator lead us to confirm the possibility of our bullish scenario.
The invalidation level of our trade setup locates at 1.1649.
Chart
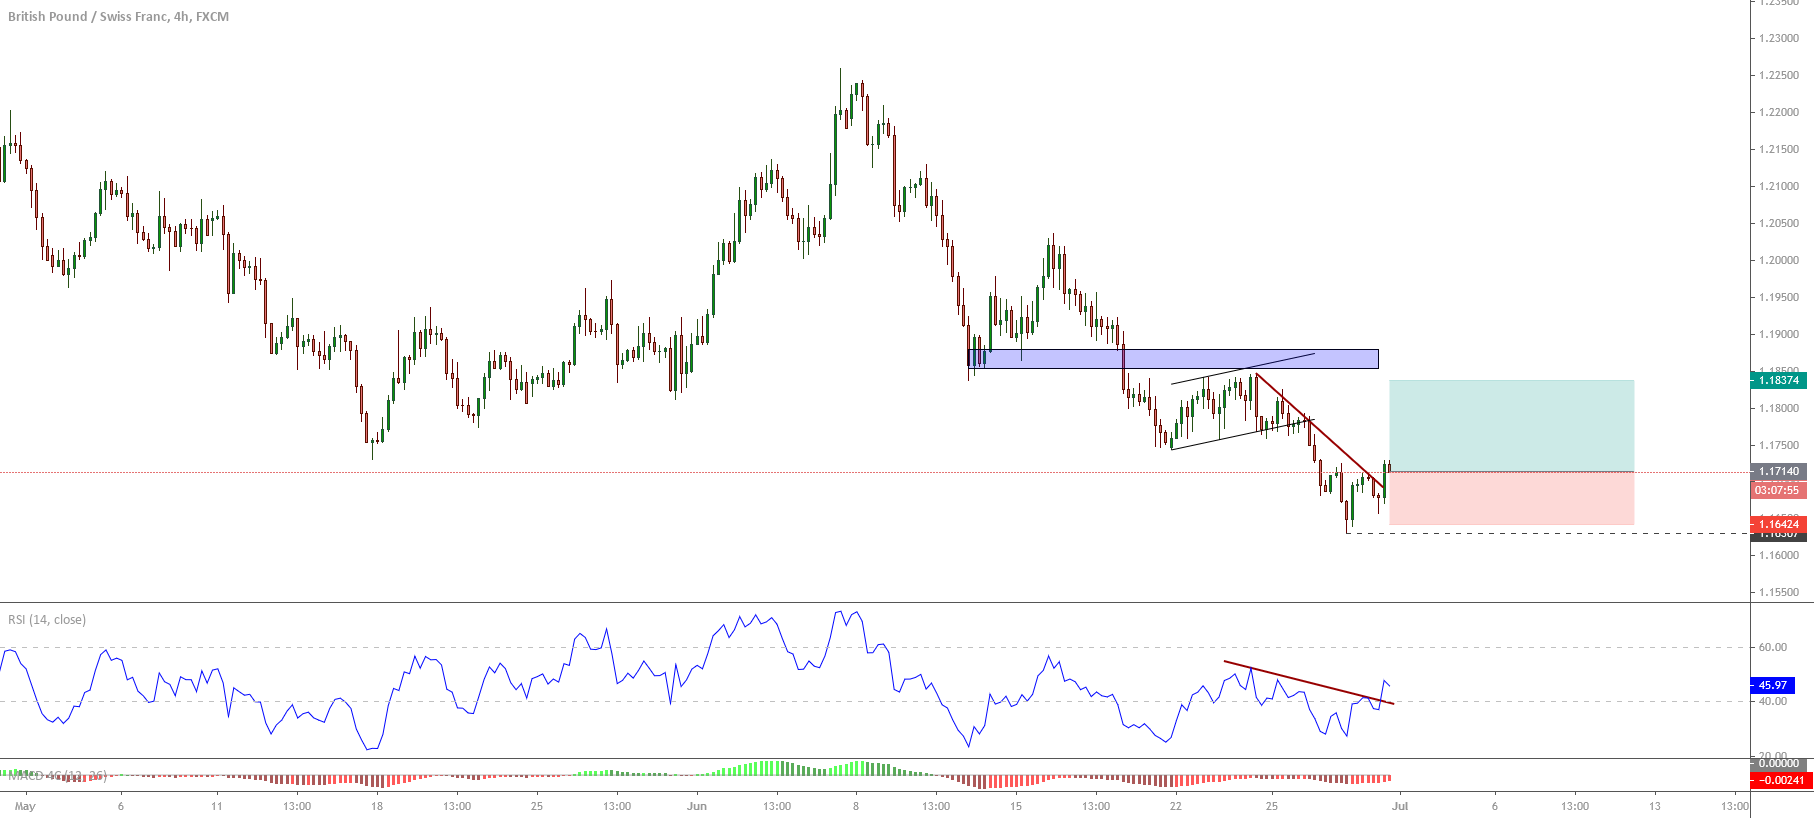
Trading Plan Summary
- Entry Level: 1.1714
- Protective Stop: 1.1649
- Profit Target: 1.1844
- Risk/Reward Ratio: 2
- Position Size: 0.01 lot per $1,000 in trading account.