For the purposes of this analysis, I will be using Ethereum. I imagine most reading will be familiar with TradingView but I will also be using a professional suite of trading software called Optuma.

One of the great factors in Gann’s Analysis – and the thing that diverges most from many other forms of technical analysis – is Gann’s focus on time being the factor for trends and price action. Everything is a slave to it. The news and human behaviour are not random nor does it create the conditions for changes in trends.
Time is the reason.
Square of 9 – Time and Price Squared
We are a little over a week away from the date of June 22nd, which is an important date and angle in Gann’s Square of 9. This is a normal date range to find reversals in trends. June 22nd, (summer) 93 days from March 21st, equal to 90 degrees, opposite of Dec 23rd.
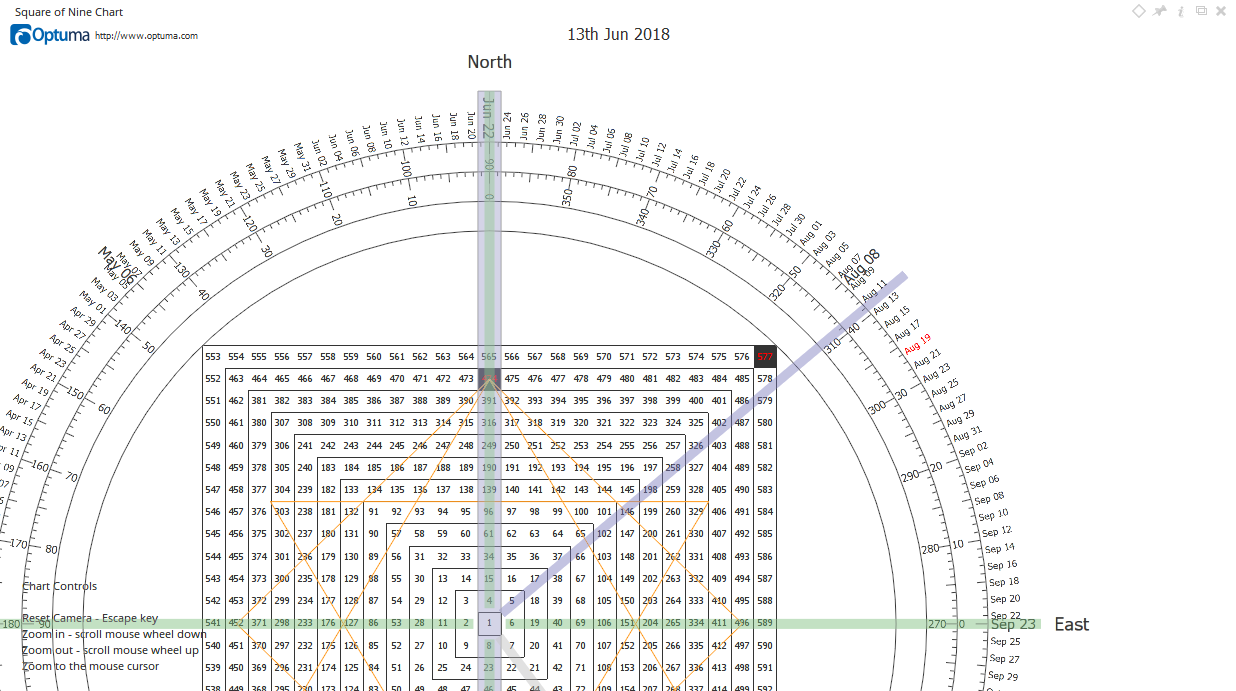
Gann Square of 90
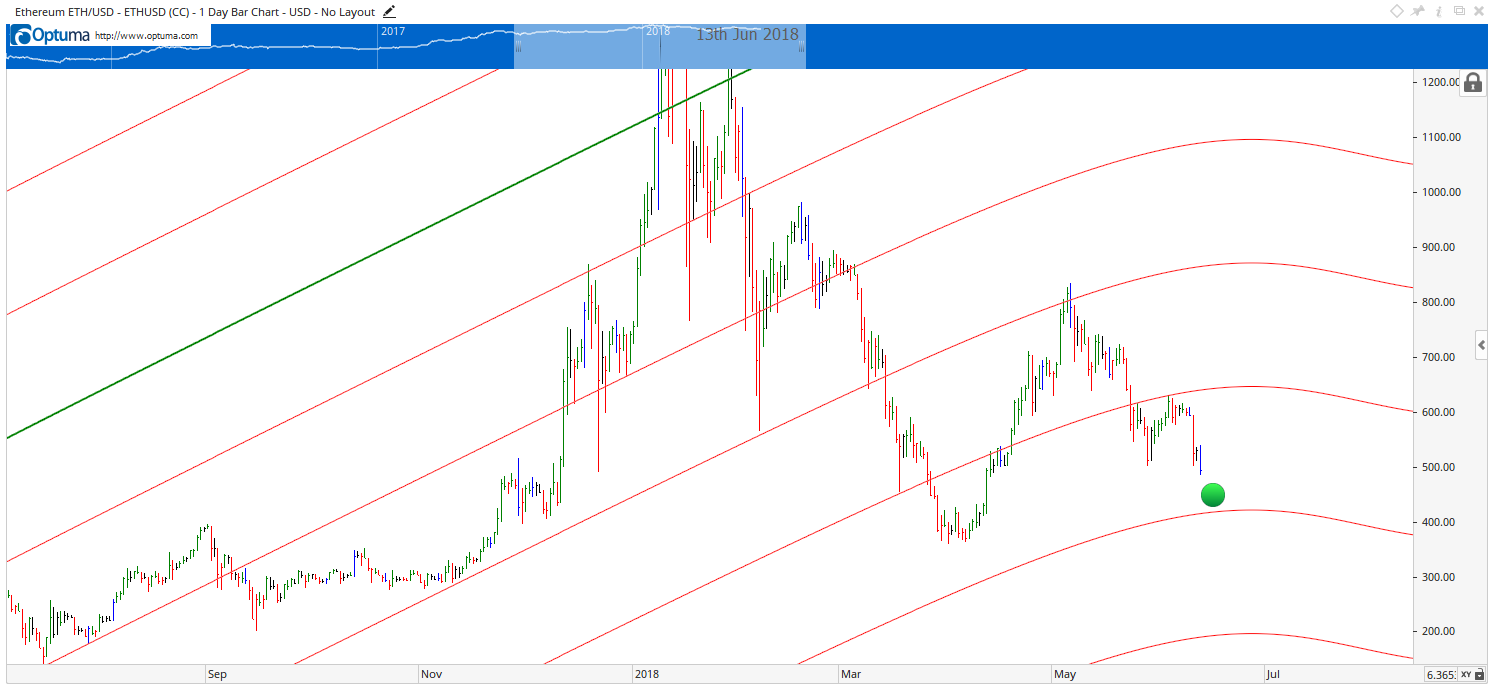
There are a few things to take away from this chart, first, what you are looking at is a more advanced and ‘oldschool’ form of technical analysis. The geometry you see on the screen is called a Gann Square of 90. The tool is often called a Gann Box, but a Gann Box can be used to construct a number of Gann’s square variants (Square of 144, Square of 12, Square of 24, etc).
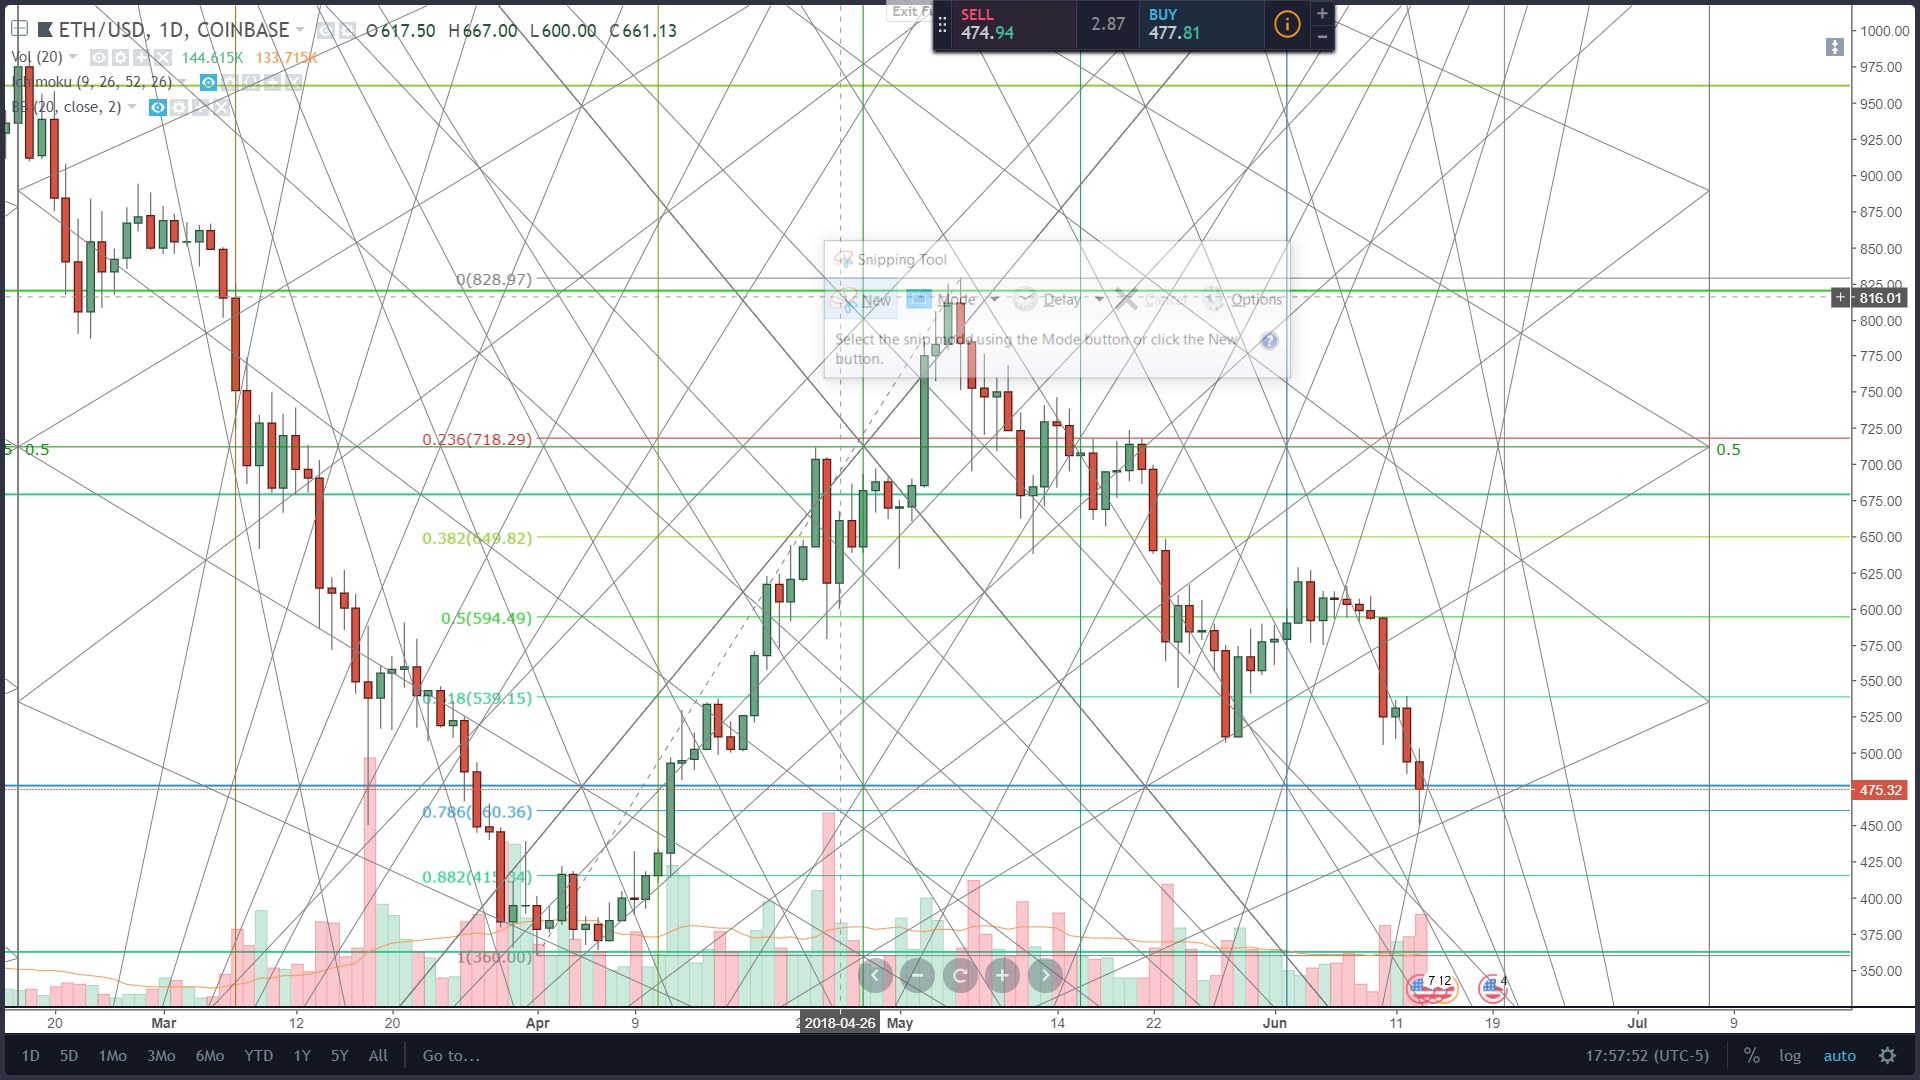
Shared Fibonacci values
Price action has formed a base at two Fibonacci zones which are the same but from different swings. The shared Fibonacci ratio is the 0.786 level. The first is from the most recent swing from the dates of April 1st, 2017 to May 5th, 2018. The next Fibonacci ratio comes from the beginning of Ethereums’ breakout back on September 14th, 2017 to the all-time high on January 13th, 2018.
The Number 144
This is probably the most important item here. The number 144 is one of the most important in Gann’s work. The number 9 is also important, probably the most important number in Gann’s work. 1+4+4 = 9. Divisions and multiples of 144 equate to various price levels that are stopping points for trends. 144 x 3 = 432, which was (depending on data feed) near the lows of the day before buying stopped further downside pressure.
We are also within the 9 day period of the 144-day cycle. The 144-day cycle terminates trends.
Consider that the all-time high was around January 20th and 144 days from that date is near June 22nd.
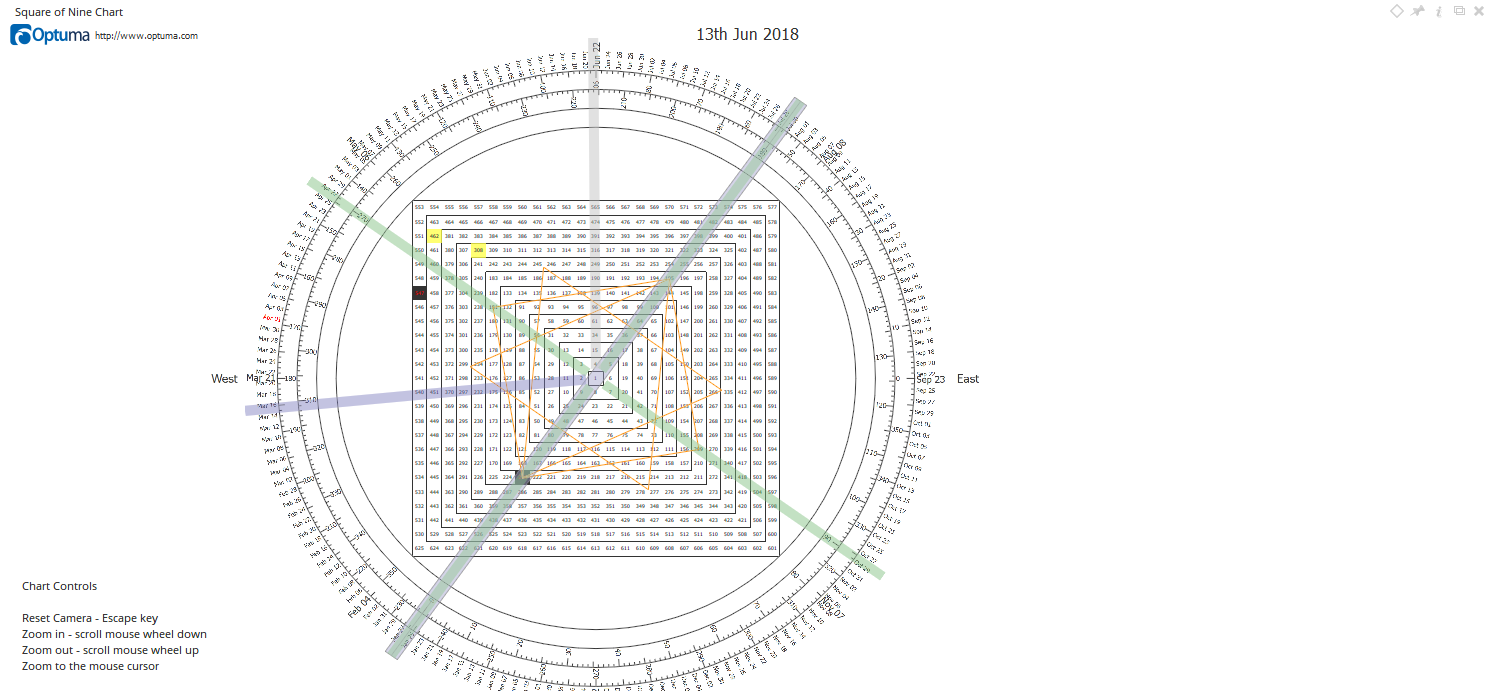
Gann Planetary Line of Mars
For those unfamiliar with Gann’s style of analysis, then the operation and function of the longitudinal position of planets will seem even more foreign to you than the angles and squares. A quick explanation here is that Gann plotted the longitude coordinates of all the planets onto his charts and found that they were natural support and resistance for price. They were static. Fixed. Not subjective.
And, for whatever reason, some charts were more sensitive to some planets angles. For almost every cryptocurrency I’ve analysed (about 132), they all find sensitivity to the planetary angle of Mars and it’s harmonics (the divisions between the synodic cycle/angle). Price found support at an inner harmonic of Mars. The Green and Red ‘wavy’ lines represent the longitudinal position of Mars as viewed from here on Earth (geocentric).
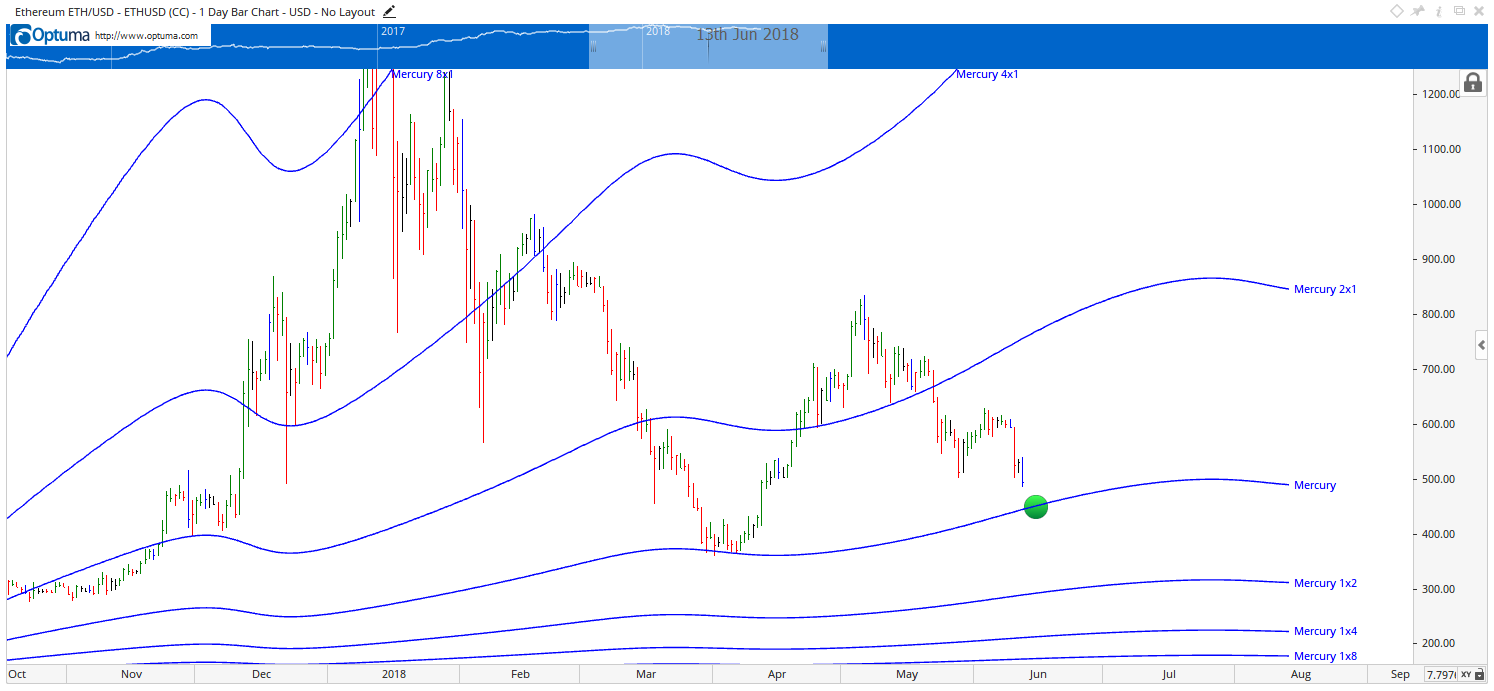
Gann Planetary Lines Fan
Gann was never a fan of planetary lines, but we can convert the same formula he used for planetary lines and paint them onto a chart with the Gann Fan tool. From the most recent major swing, we plot out the planet Mercury – Mercury is a fast moving planet and the degrees of its fan create excellent short-term support and resistance areas.
Price stopped at the top of the ’45-degree’ line of Mercury.
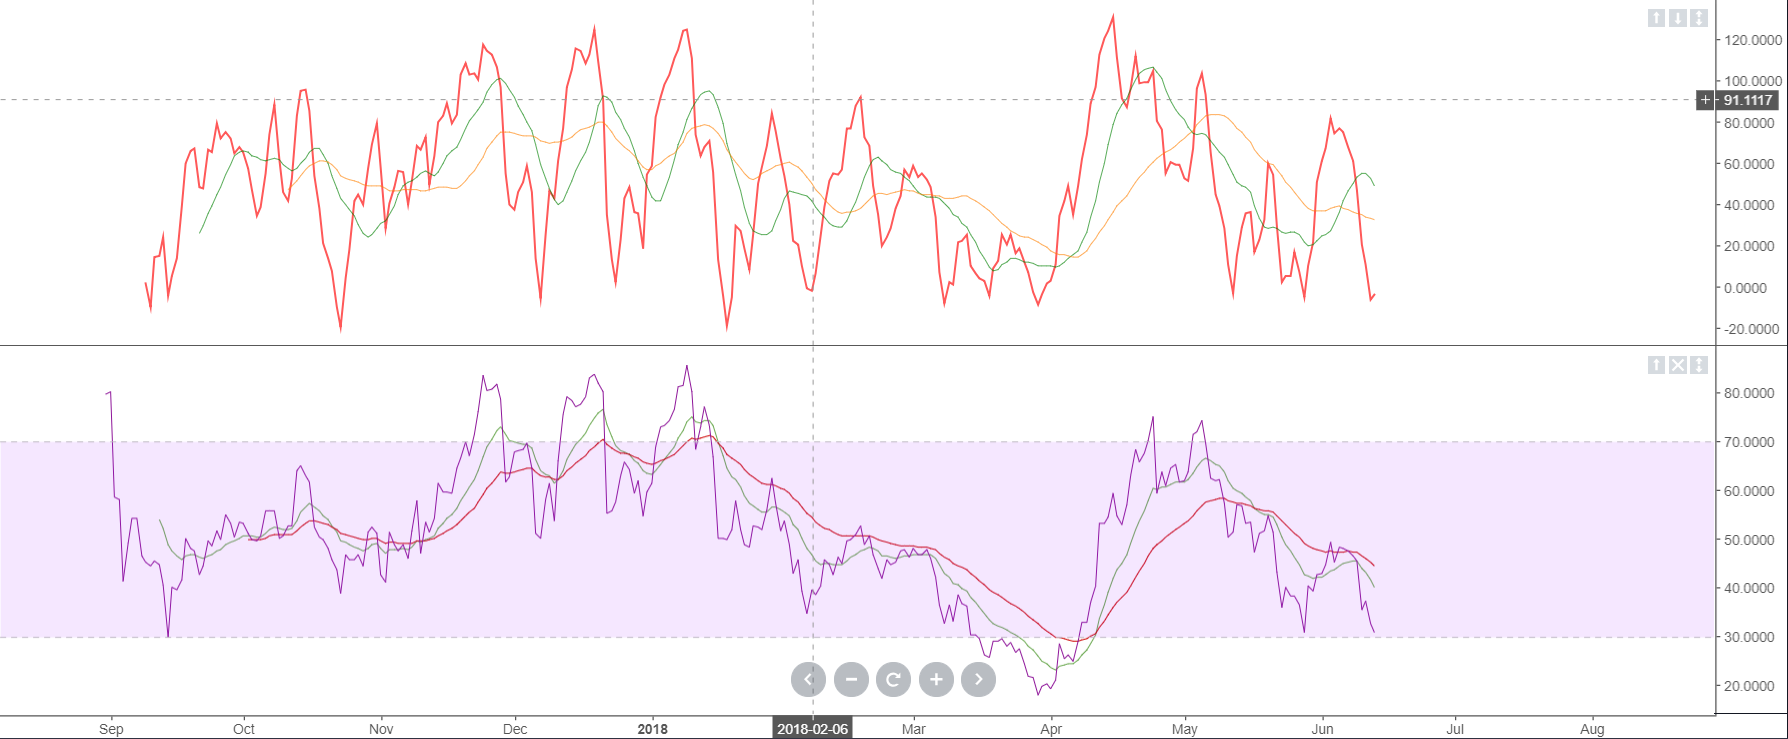
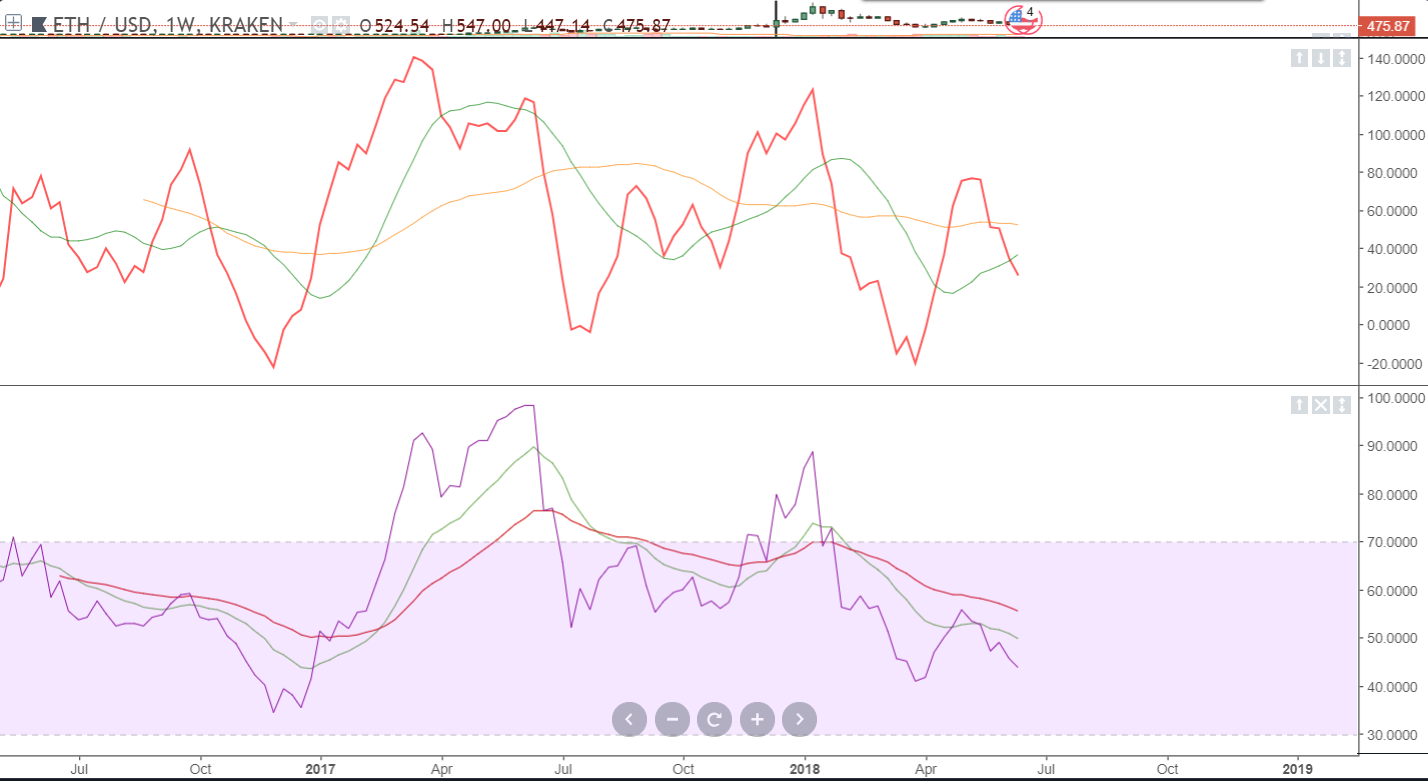
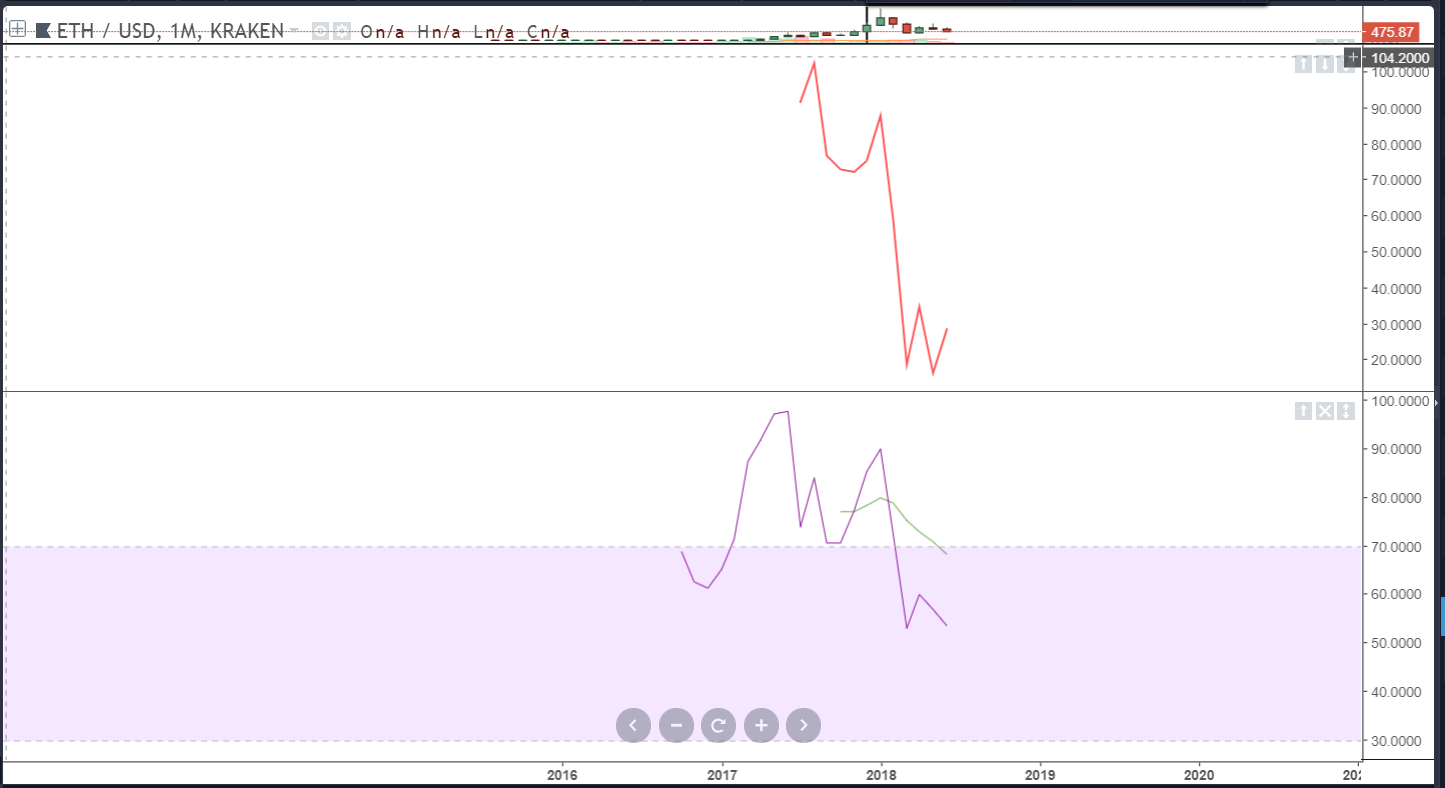
Multiple Time Frame Oversold Conditions
Another strong indication of an impending reversal and bottom found is the oversold conditions on the daily, monthly and weekly charts. The indicators here are the Composite Index (above) and the Stochastic RSI (below).
Daily
Weekly
Monthly
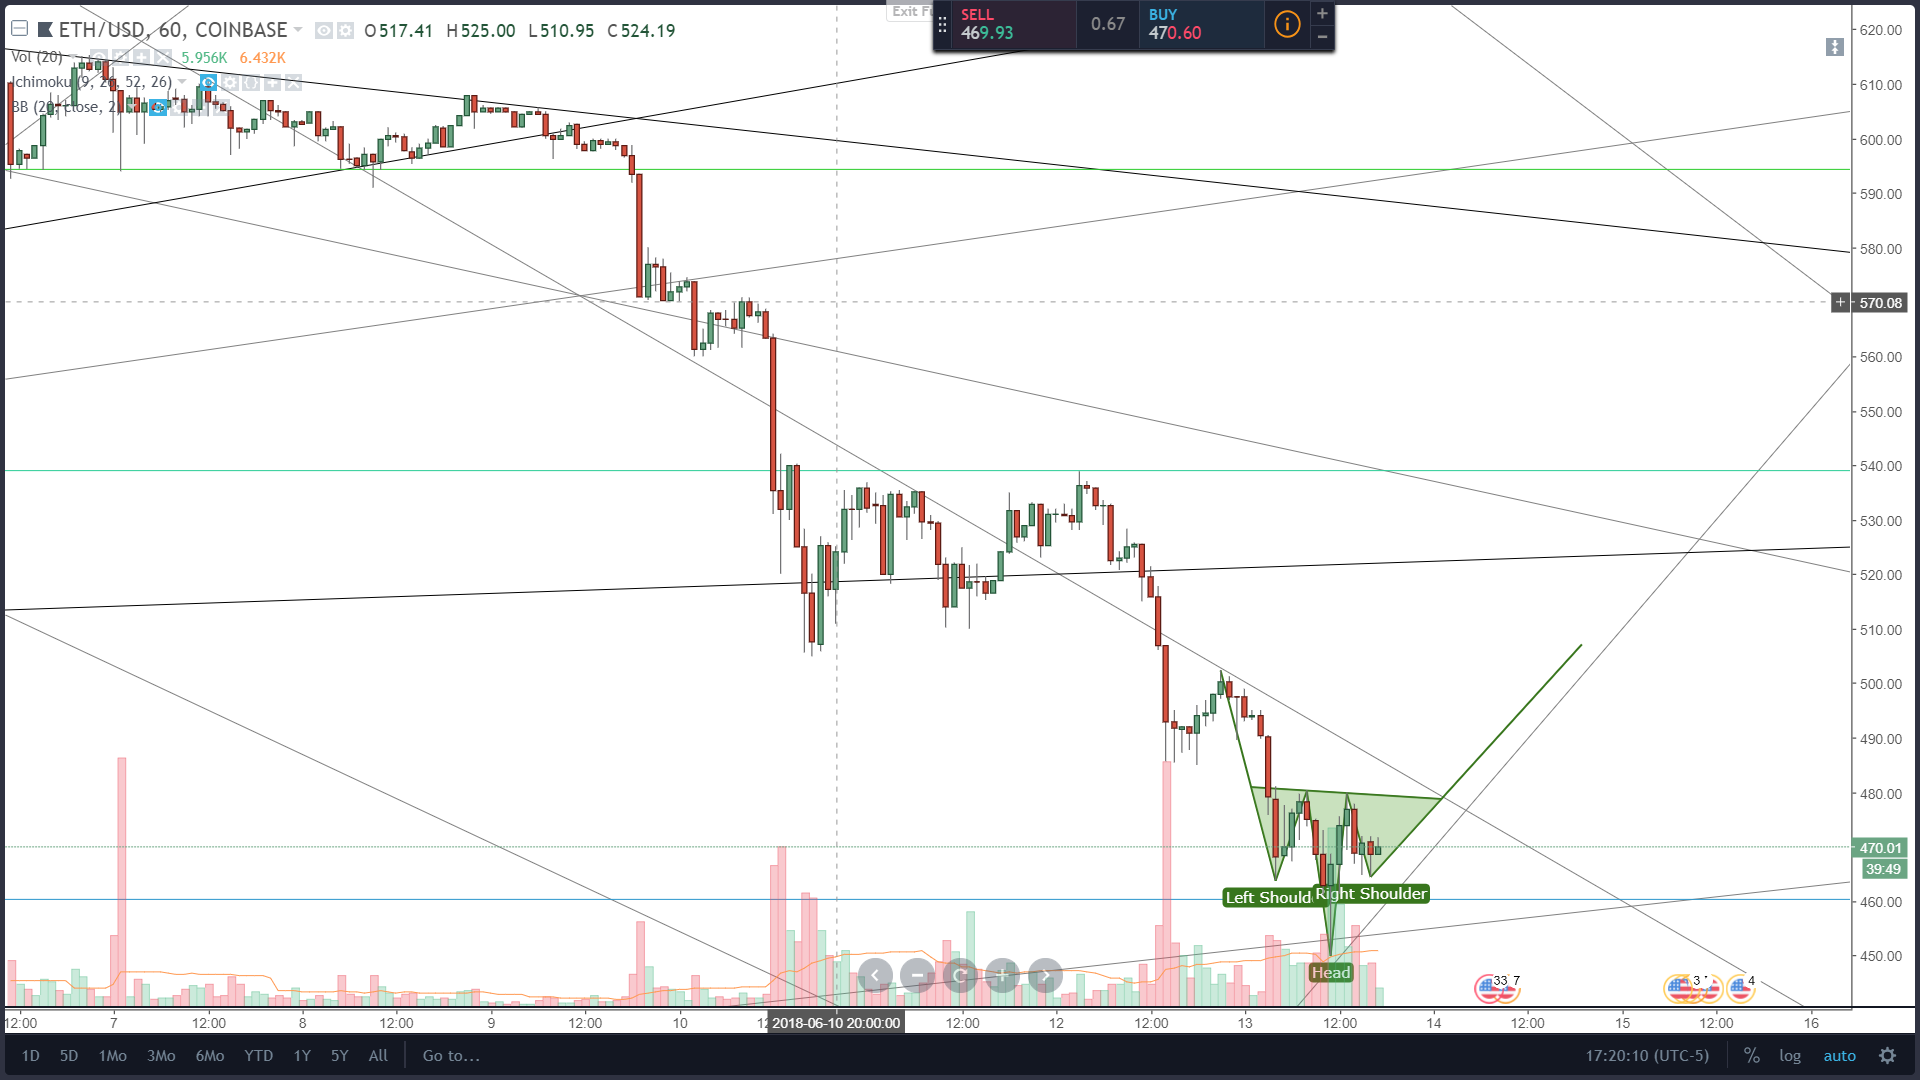
Simple Pattern Forming
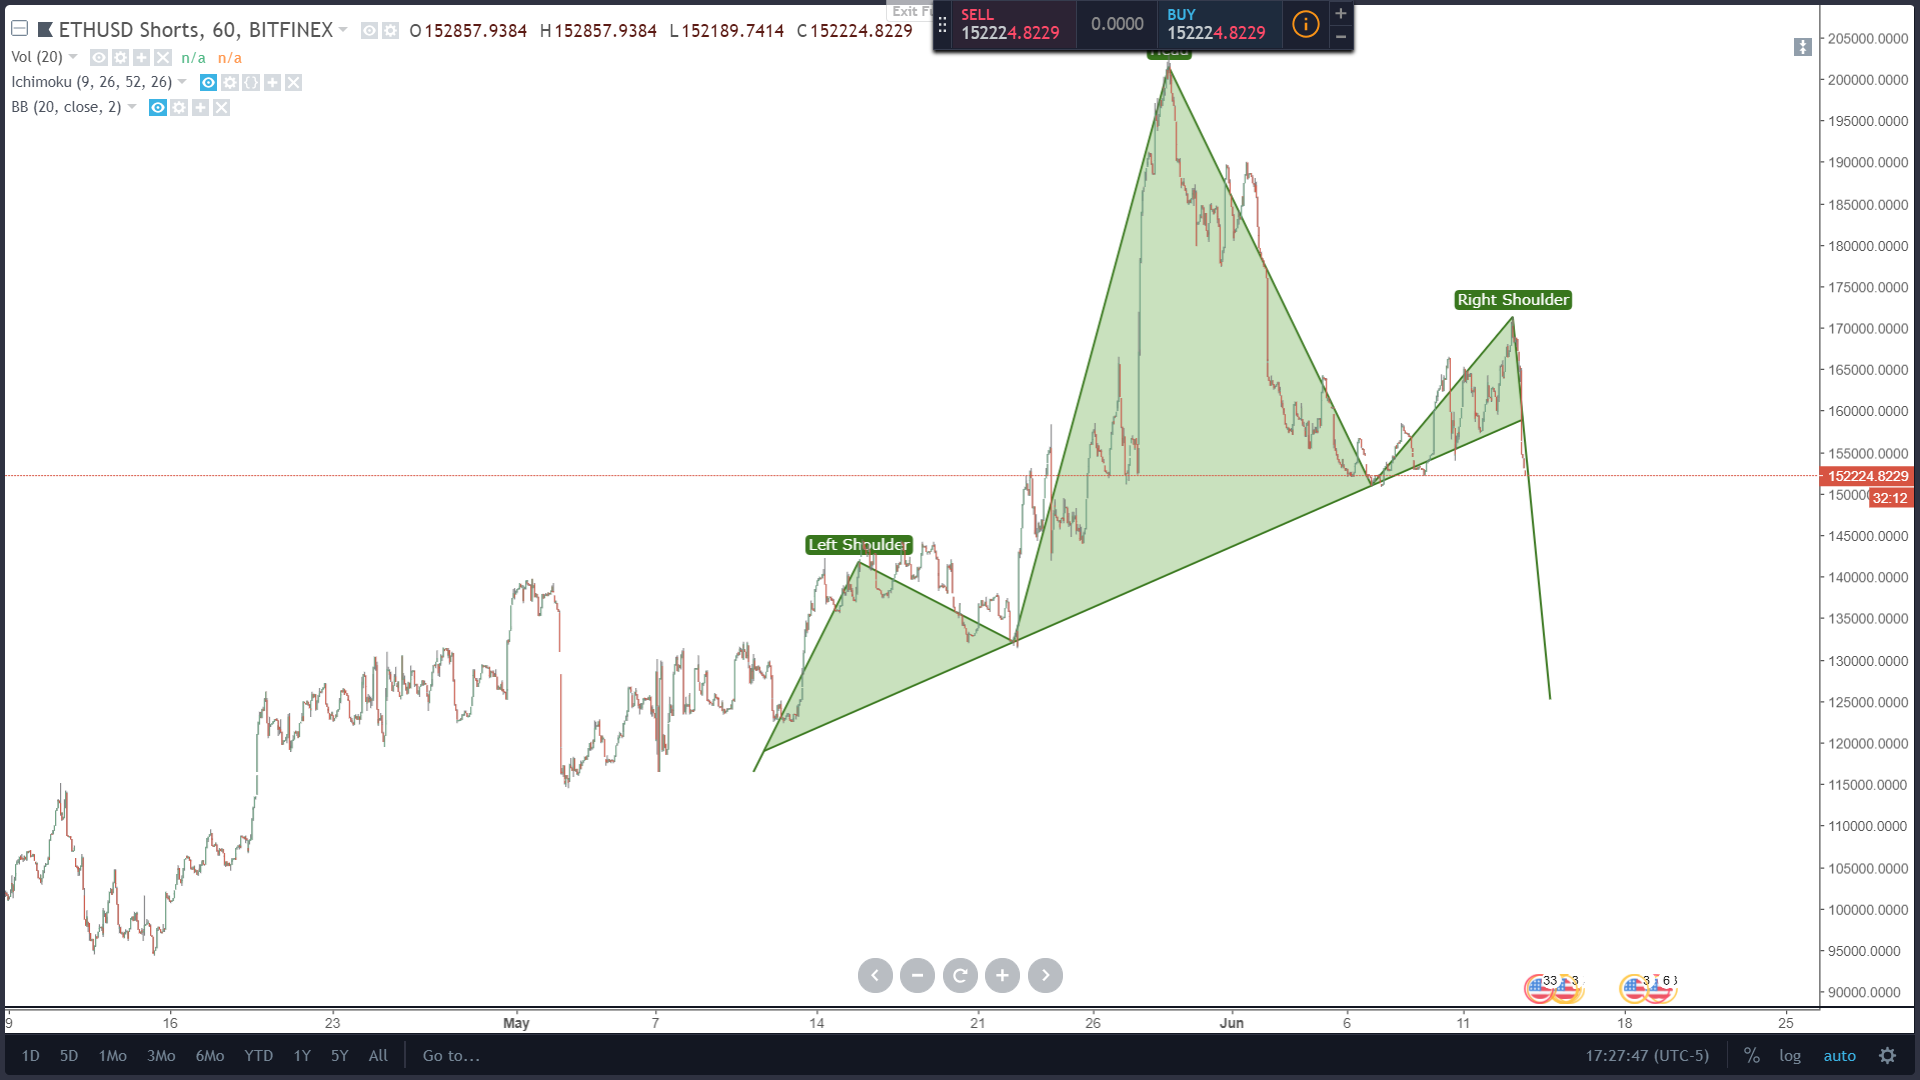
The simple pattern of an inverse Head And Shoulders pattern is being formed. There is also a normal Head And Shoulders pattern forming on the ETHUSDShorts chart from Bitfinex – indicating shorts are abandoning their positions to cover.
Inverse Head and Shoulders
Head and Shoulders of ETHUSDShorts
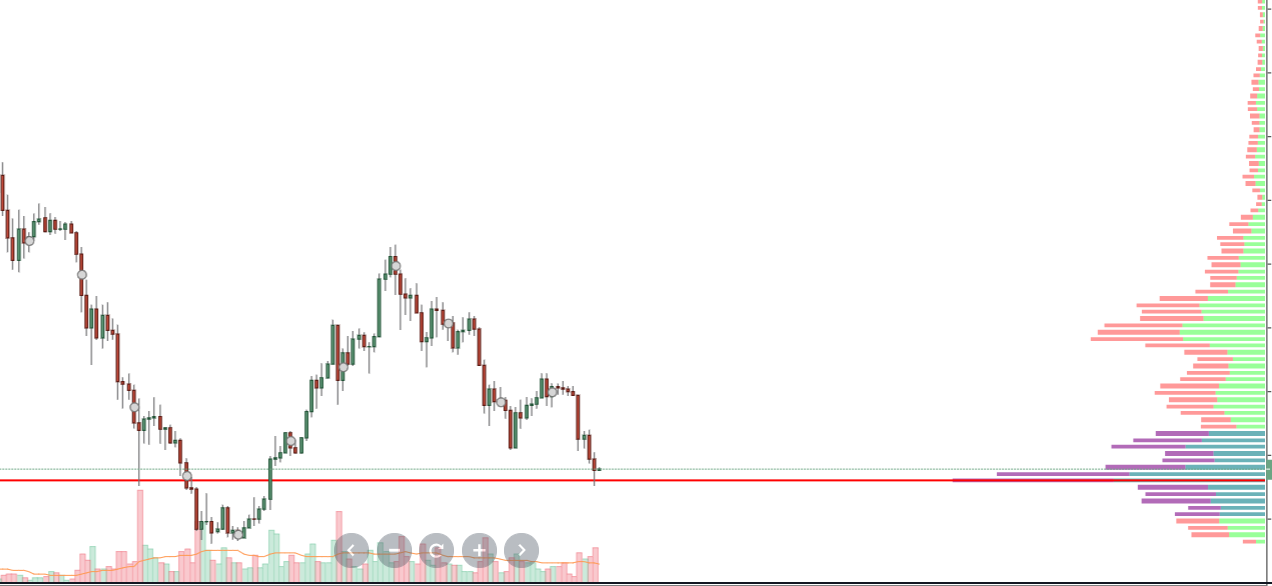
Volume
Using VPA (Volume Price Analysis) and VAP (Volume At Price) we can see a confluence zone formed here. On the VAP profile, there is a very nice and supportive high volume node that price is currently sitting at. Additionally, the price is trading within the highest 35% of the volume traded. The volume itself is heavy and supports the bullish hammer candlestick that was formed on the daily.
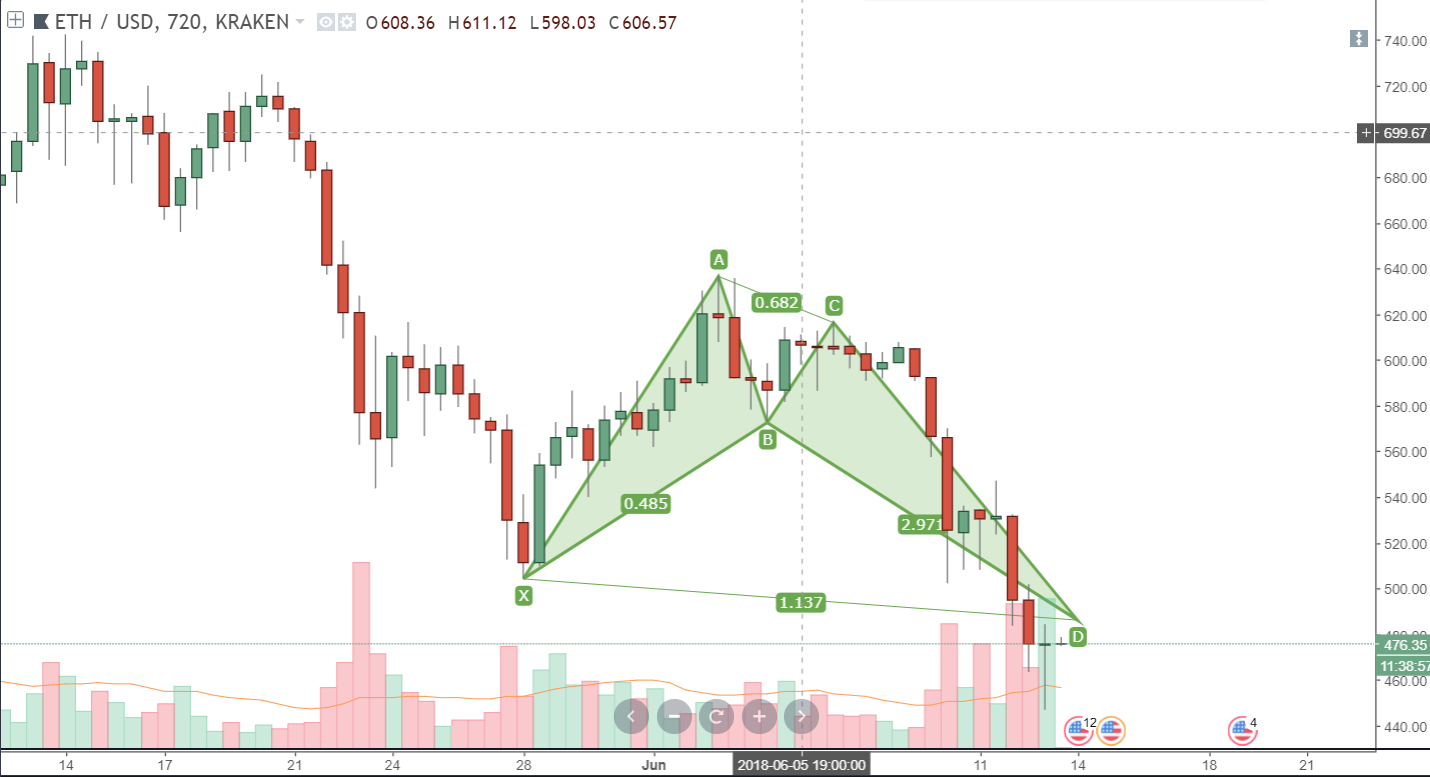
Gartley Harmonics
Without going into a lot of detail, Gartley patterns are either dynamic in their set value zones relative to their required Fibonacci levels or they are very static. An entire series could be written regarding Gartley’s harmonic patterns, but very quickly, we need to only know what Gartley has formed on this chart: Alternate Bullish Bat Pattern. This signals a reversal in price action.