Description
The EURAUD cross reveals intraday recovery signals on Wednesday, suggesting the possibility of bullish movements in the following trading sessions.
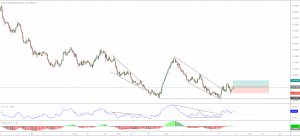
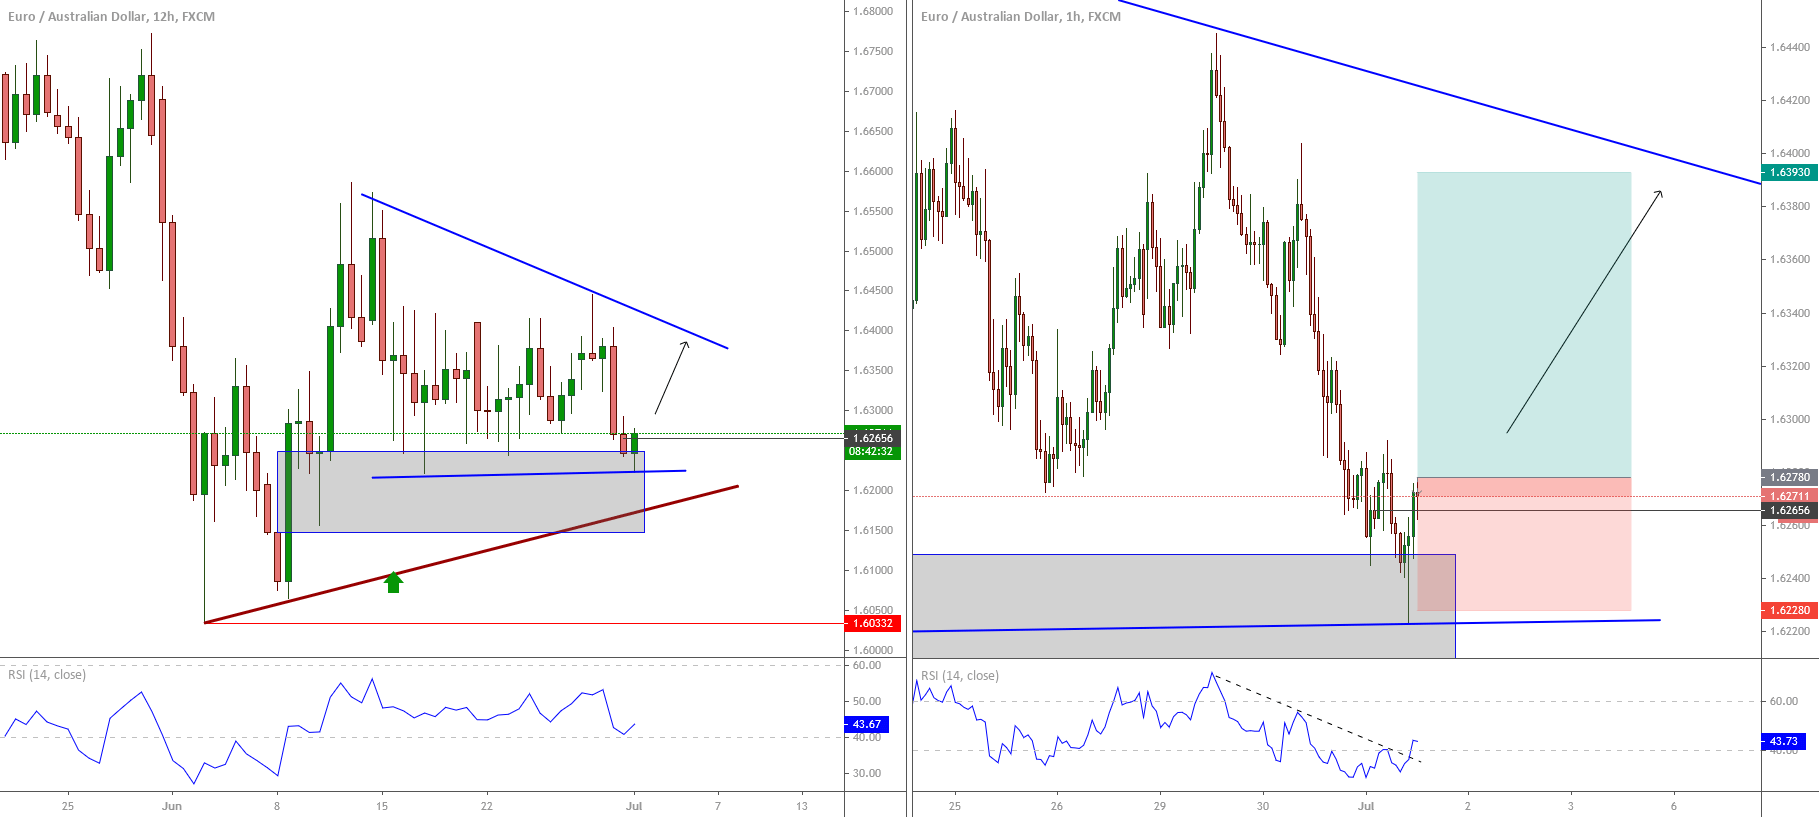
The EURAUD big picture exposed in the 12-hour chart (left side) illustrates an upward sequence that began on June 02nd when the price found fresh buyers at 1.6033.
Currently, the price moves sideways, developing a triangle pattern, where the price action tests the base-line of the chart structure. On the other hand, the EURAUD cross reveals the formation of a reflecting candle suggesting the exhaustion of the short-term bearish sequence.
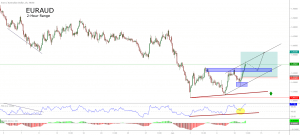
The right side chart corresponds to the EURAUD hourly chart. We observe the intraday bullish reaction as a bearish trap, suggesting the possibility of further upsides in the following trading sessions.
Our outlook for the EURAUD in the coming sessions foresees an upward move from the current area towards the upper line of the triangle pattern in progress with a potential profit target at 1.6393.
Chart
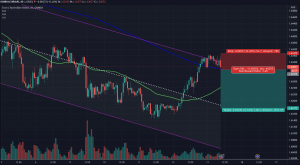
Trading Plan Summary
- Entry Level: 1.6278
- Protective Stop: 1.6228
- Profit Target: 1.6393
- Risk/Reward Ratio: 2.3
- Position Size: 0.01 lot per $1,000 in trading account.