Description
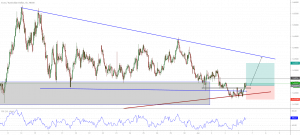
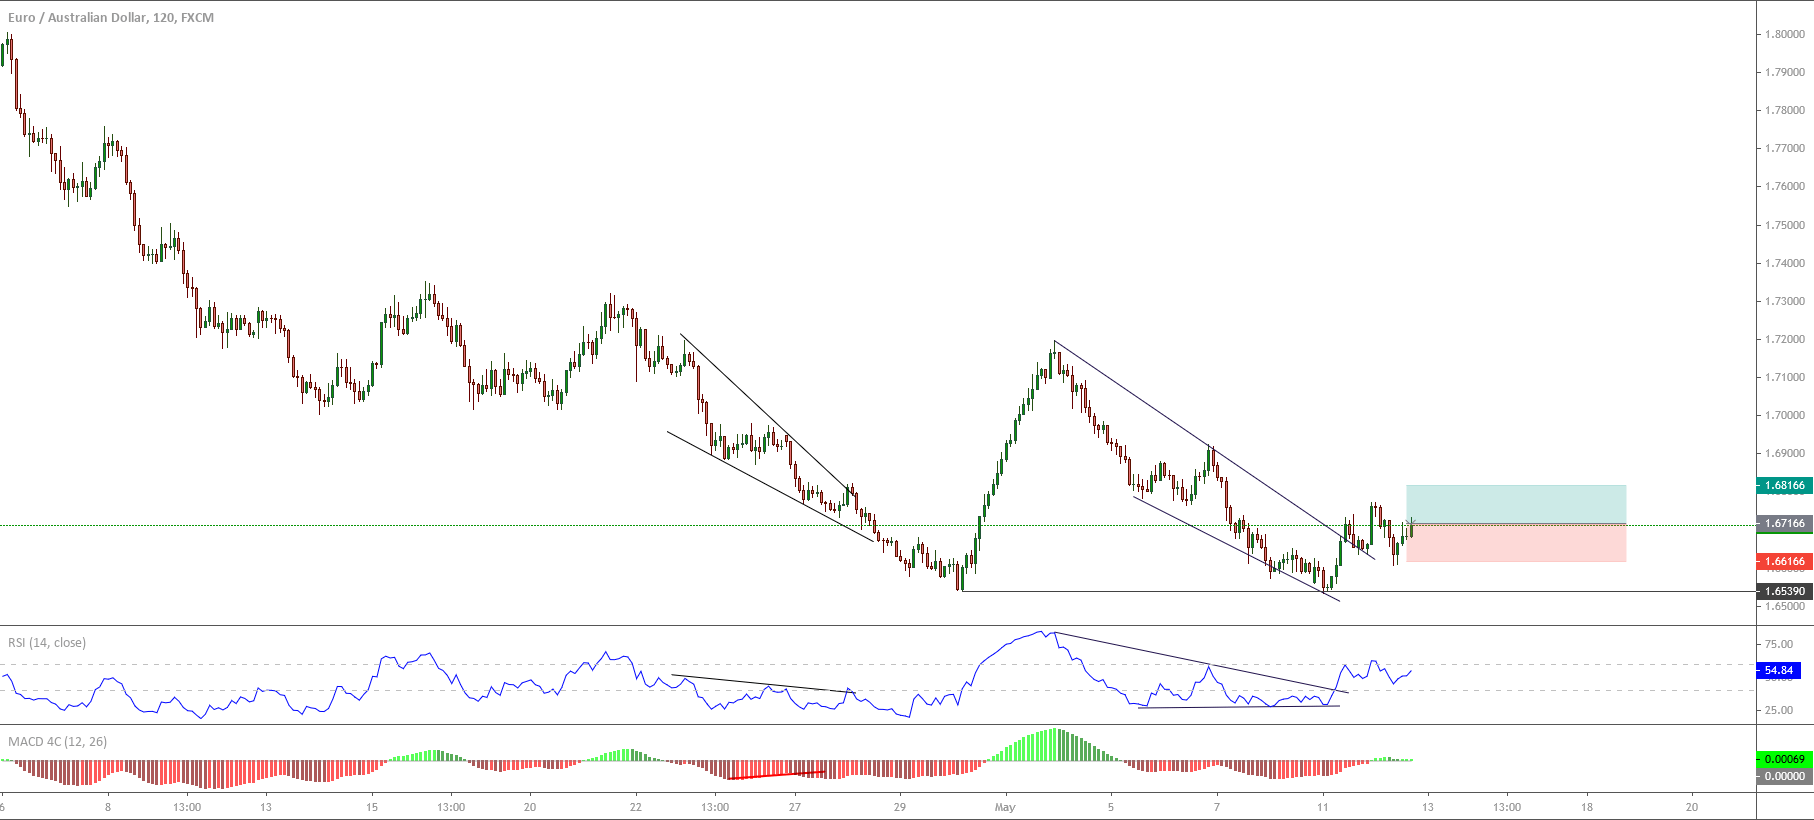
The EURAUD cross in its 2-hour chart exposes the price action reacting bullish after the re-test of the short-term support at 1.65390.
The second bearish leg and its subsequent bearish failure make us foresee the EURAUD cross an upside that could boost the price until previous highs.
On the other hand, the RSI oscillator shows an upward breakout, which supports our bullish scenario.
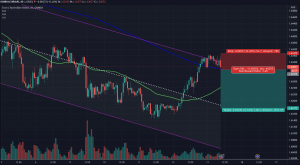
A buy-side position could be placed from the current zone at 1.67166. Our conservative scenario foresees a potential profit target at 1.68166.
Finally, the upward scenario will be invalid if the price drops and closes below 1.66166.
Chart
Trading Plan Summary
- Entry Level: 1.67166
- Protective Stop: 1.66166
- Profit Target: 1.67166
- Risk/Reward Ratio: 1
- Position Size: 0.01 lot per $1,000 in trading account.