Introduction
The rectangle is a classical horizontal chart pattern which appears in an up and downtrend. The tops and bottoms of the pattern are parallel to one another; also, the high and lows are horizontal. There are two ways to trade the pattern you can buy at the support and sell at the resistance, or you can wait for the breakout to happen to take a trade.

HOW TO DRAW THE BULLISH RECTANGLE PATTERN.
- First of all the market should be in a strong uptrend, because big money is only going to make in a trending market.
- We need the two equal lows and highs to draws the horizontal lines that should contain the price action.
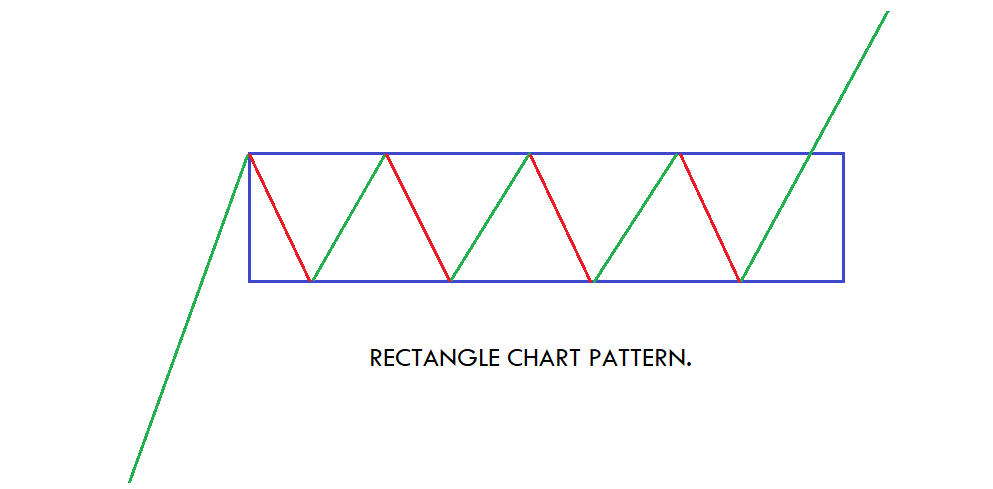
The image above represents the Rectangle Chart Pattern.
THE PSYCHOLOGY BEHIND THE RECTANGLE CHART PATTERN.
In an uptrend, before the rectangle pattern market is under the control of the buyers and at the significant level buyers stopped buying and price action started turning sideways. In the consolidation market, you will witness the equal amount of highs and low which is a sign that no one is in control and you wait for the breakout to happen at either direction to take the trade. If the price action breaks to the upside, then it means the buyers are back into the game, and you can go for the brand new higher high, and if the breakout happens to the downside, it merely means you are going to get a reversal trade.
5 STEPS FOR TRADING THE PATTERN.
-
BEFORE THE PATTERN FORMATION RECOGNIZE THE PRIOR TREND.
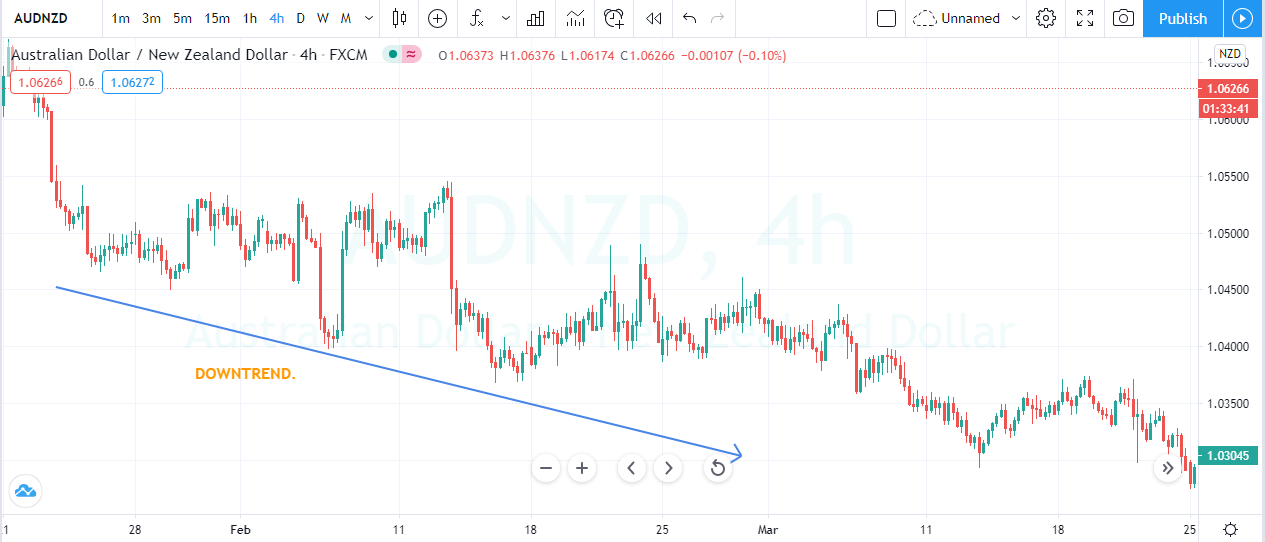
Just because you can spot the pattern in the market, it doesn’t mean immediately trade it. Remember, we need the right context, and everything needs to line up before trading the formation. If the market is in an uptrend, then your goal is to go long in the market and if the market is in a downtrend, then only go for sell-side rectangle pattern. Identifying the trend is probably the most significant ingredient that can determine the success of the pattern.
The image below represents the downtrend in the AUDNZD forex pair.
-
IDENTIFYING THE PATTERN.
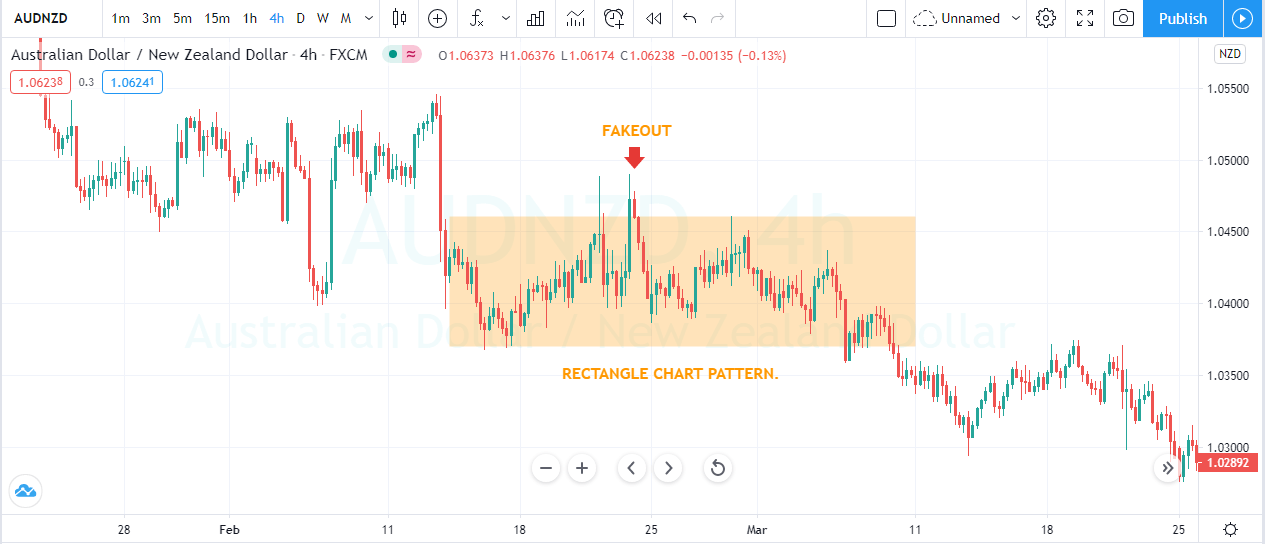
The next step for you is to identify the rectangle price formation to make cash from the market. Look for the trending market and wait for the price action to hold at the significant support or resistance (according to the trend) for some time. When the price action prints the smaller range on your trading timeframe then you can draw the rectangle pattern on the price chart.
The image below represents the rectangle chart pattern.

-
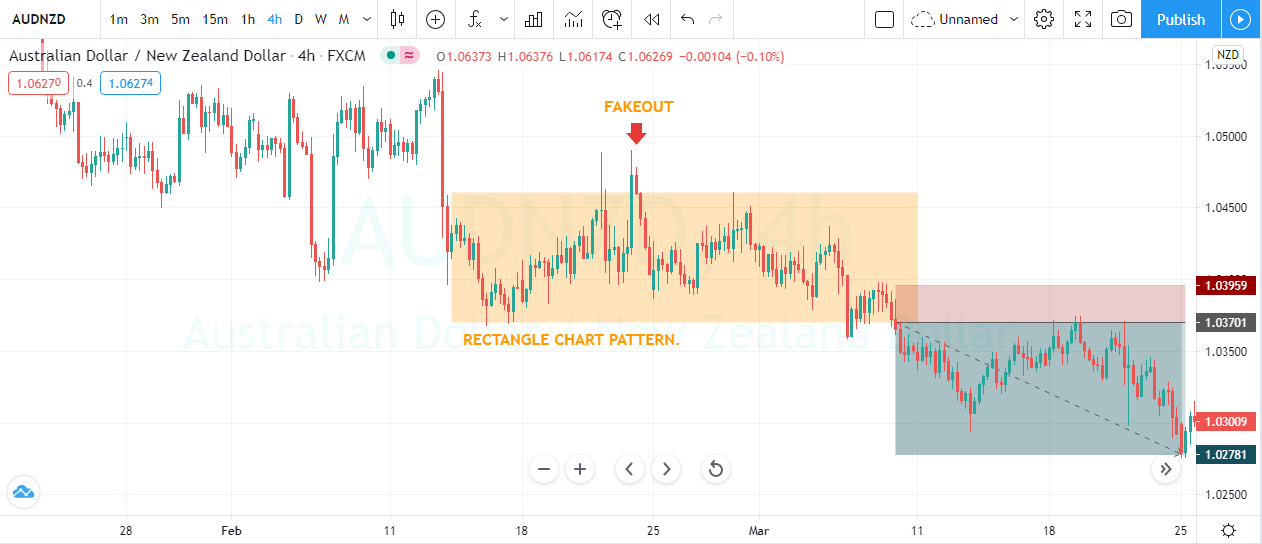
WAIT FOR THE FALSE BREAKOUT.
We are here to trade the pattern as a continuation of the trend but sometime in the market rectangle pattern also act as a reversal pattern. Here in this strategy, we used the unique trading technique to trade the formation successfully; in this way, you can easily avoid the low probability trades.
Generally, for the buy order, we need the price action to break the resistance area of the pattern to trade the market. Before entering a trade waits for the price action to break below the support area and let the prices came back immediately. In short, we are looking for the fake-out before entering a trade.
But why is false breakout important?
Typically some newbie traders or impatient traders enter the market even before the proper formation because the greed to make tons of money is very high. So when these newbie traders enter a trade, they put the stops just below the entry and when the market print the fake-out, they immediately stopped out which fulfil the orders of the more prominent players. Secondly, it traps some sellers who take the support level breakout trades. Both of these actions fuel the upside momentum when the breakout happens.
In the image below the more substantial buyers goes up but immediately sellers eat everything and close inside the pattern. This was a confirmation sign that the sellers are there and soon we can expect the brand new lower low.
-
BUY AT THE CLOSING CANDLE THAT GENERATES THE RECTANGLE BREAKOUT.
When the price action confirms the above rule, the next step is to enter a trade. Wait for the price to break above the rectangle formation to take the trade. Some traders wait for the prices to hold above the pattern to take the trade, but we here aren’t going to follow the rule because the fake-out already confirm the pattern. So when the prices close above the rectangle, it means bulls are in control, and you can go long, and in a downtrend when the prices close below the pattern, it means bears are in control.
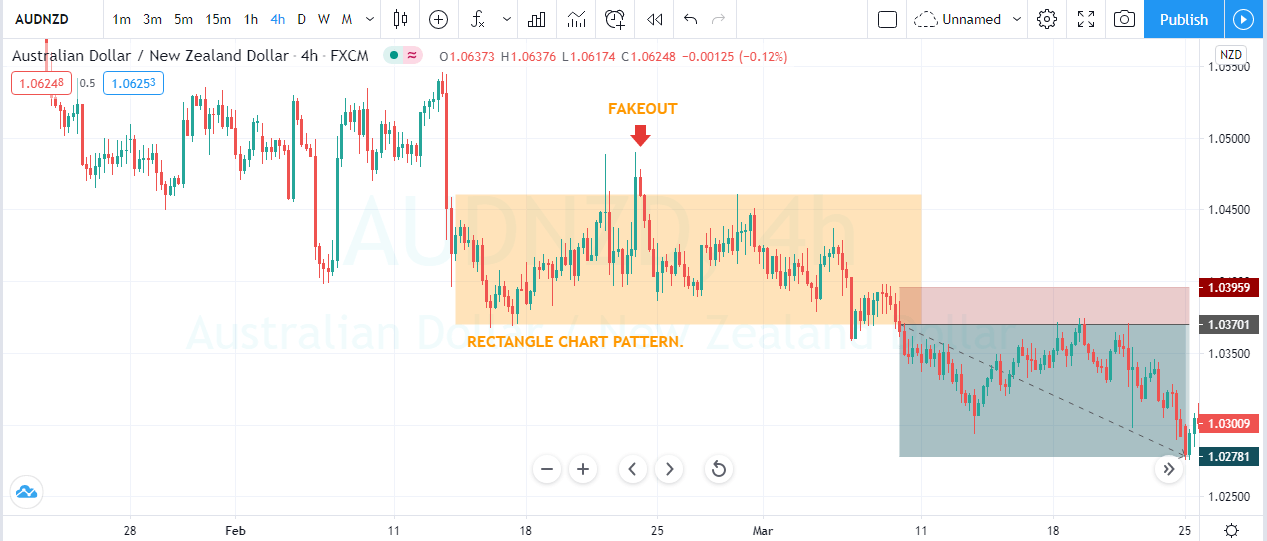
The image below represents our entry in the AUDNZD pair. When the prices closed below the pattern, it was a sign of sellers dominated the game. We took the entry at the closing and chose to go for the brand new lower low.
-
TAKE PROFIT AND STOP LOSS ORDER.
According to the textbooks, you can measure the distance between the two parallel lines and add that to the breakout to obtain your profit targets. You can follow this way, or you can close your trade according to the market situations. If you are a conservative trader, then you can put the stops below the rectangle pattern, or if you are an aggressive trader, then the stops must be just below the resistance line. We advise you to put the stops just above the closing of the most recent candle because fake out already confirms the pattern.
The image below represents our exit and stop loss in this trade. The fake-out confirms the pattern that’s why we choose to go with the smaller stop loss. The price action was started struggling around 1.300 area, so we choose to close the trade early.
CONCLUSION.
The rectangle pattern is a very popular pattern among the traders; this is because this pattern is straightforward to spot and simple to trade. This pattern is a real-time tool whereas most of the indicators lagged. You are only going to get this pattern in the trending market conditions and make sure the ongoing trend should not be volatile enough.