Categories
Forex Basic Strategies Forex Trading Strategies

Heikin Ashi Pure Trading: HA With Williams %R Spin

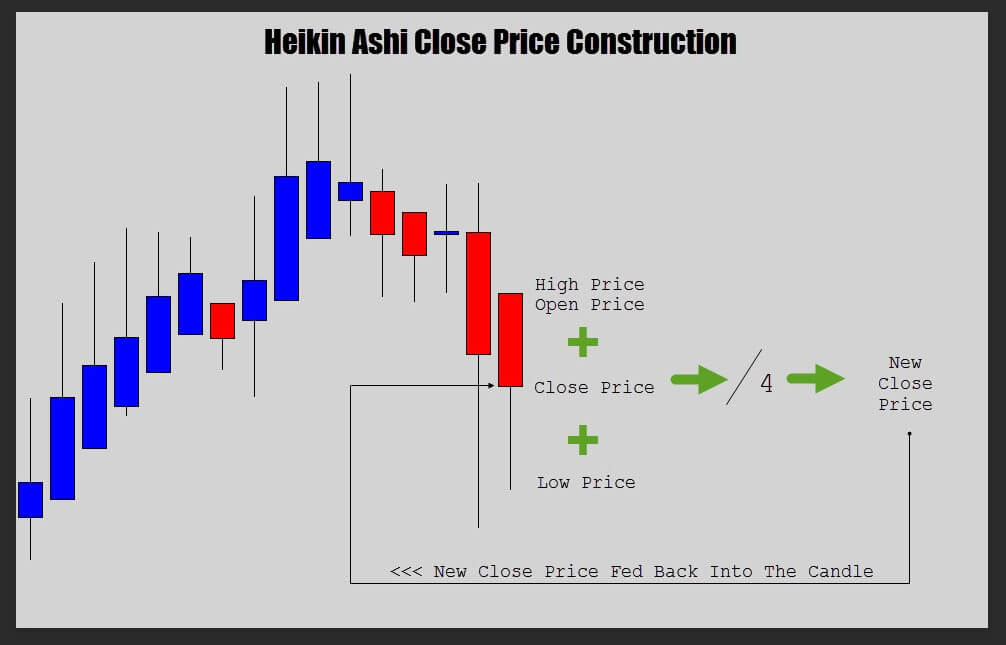
Heikin Ashi is a chart modification that transforms how candles are presented so a trader can see a trend more clearly. Noise reduction is the primary purpose of HA however strategies that use it are many. Our following example of using Ha does not mix anything else just pure HA trading. Of course, you can improve on it with rules and other indicators, still, we leave that up to you. HA interpretation is subjective and here is how we like to use it. 

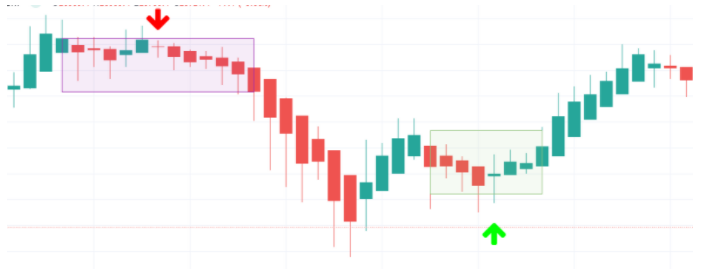
Reading Heikin Ashi candles is similar to the regular ones except these have clear patterns. HA candles color tell the trend however, they also have a wick that actually gives info about the trend momentum. HA candle with a wick on one side is a good indication a trend will move on. Uptrend candles have usually green-colored bodies if not customized and have a wick above. The opposite is for red bearish trend candles. Once the trend starts to slow or consolidate wicks on both sides will appear. A good signal a trend is over is two or more HA candles resembling a Doji as shown in the next picture:

Big candles with a long wick on one side is a strong indication of a good trend momentum, however, pay attention to the sequence. HA filters noise so expect to see more series of candles of the same color. If you see small bodies with wicks on both sides then this is definitely a flat market you do not want to be trading, especially if you cannot count more than 2 same-colored bodies in a row. When building a system with HA you can set this up as a rule to avoid losers. 

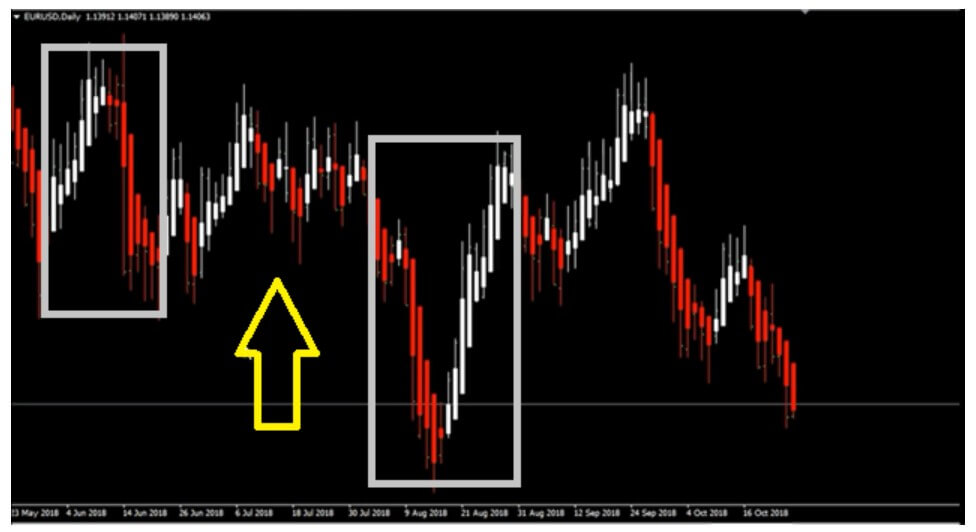
Our HA strategy incorporates one more aspect of trading which is not obvious yet commonly used by experienced traders. It is the higher time frame alignment. If you are trading the daily chart, then consider weekly and monthly, two higher time frames. When you see a good momentum HA candle with one wick on all three time frames, this is a high probability trade. Trends tend to keep trending, some are steep and fast others are slow and long with many corrections but generally, trend following strategies are considered the best. Aligning all three higher time frames you consider trends that are older and bigger than what you see on the lower timeframe. Like this, we add up all probabilities from these trends into one. Applying the higher timeframe alignment rule implies we will have fewer signals to trade but these trades will have a better win rate and better yield. A rule that manages to eliminate 2 losers and one winner is a good one and makes the P/L line look much better. 

If you need more confirmations a trend is emerging you could incorporate a rule to enter a trade only if two consecutive strong trend HA candles appear. Test this rule out and if you have eliminated some fake signals, try with 3. Making too many short-lived trades could also be an issue. Consider a similar exit rule in such scenarios by waiting for two or three candles of the opposite color. It is important to keep trying new things on the same backtesting sample to know if you have improved the strategy. Also, try to sample various currency pairs for the same period and aggregately see if improvements are made. 

The above strategy is pure HA that produces good results and is one of the best practices on how to use HA. Of course, it could be better if we add more tools to it, but not any tool. Williams %R is one indicator that we like to use differently than intended. For example, we set the Willimas %R to 14 periods on a daily timeframe or you can go lower time frames, it will still work great. Whenever we see the line crossing the 50 value, we see it as an additional confirmation of a trend. In combination with the HA, this strategy gives great results. Here is the picture of a few trades in a difficult market environment:

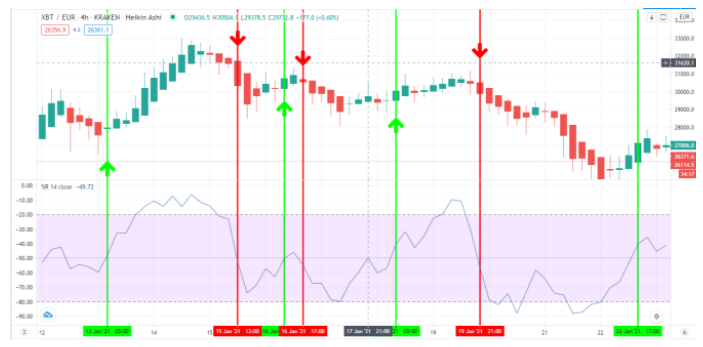
Even though market conditions are not so favorable, we managed to have only one loser, can you guess which one?

Ichimoku is a trend following composite indicators but could it be improved by using another Japanese tool like the HA? We will use only the Kumo cloud and it will serve us as the trade direction filter. We will use the default settings. Whenever the HA candle pierces the cloud we only trade that direction trades. So if the price is below the Kumo we only sell and if above we only buy. Here is how it looks like:

Credit: The Secret Mindset

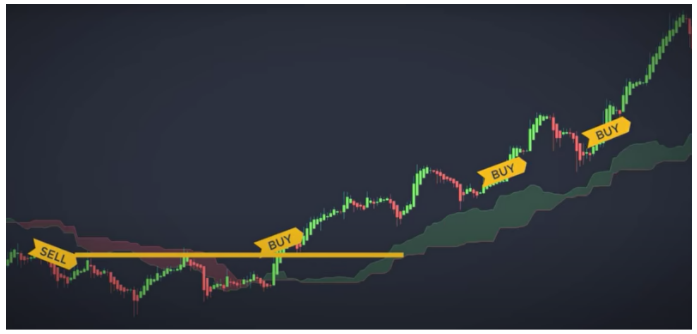
So we avoid trading corrections since they are against the trend and likely losers. However, we notice the first trades that break out of the Kumo are not the best ones and these play the biggest negative balance changer. We can incorporate a simple rule here to avoid this – skip the first trade signal and enter only consecutive obeying the Kumo direction rule. We still want to see HA candles with only one wick and not too far from the Kumo to confirm it is a trend continuation. 

The cons of the HA is that it eliminates the information from the classic Japanese candlesticks, such as the high and lows. This means HA cannot be used for Price Action, one of the most used analysis methods. Smoothed HA does not modify how you see the chart candles but instead plots a moving average-like line. The result is that you can use both styles in one strategy:

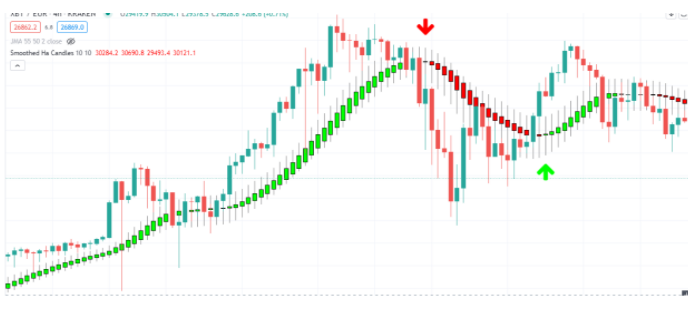
Smoothed HA acts more as a moving average that is bast used as the trade direction filter, like a regular MA, use it as trend exhaustion or reversal when the price breaks through it or use it to confirm trends with the candle color change. You get the idea there are many other interpretations but these are best practices. Smoothed HA intended to use it alongside Price Action patterns and lines. Lower settings of the indicator are used for scalping strategies and trailing stops, typical for these strategies is the 5,5 setting on both integrated MAs of the smoothed HA. 10 and 10 periods can serve as a general use trend following support line where price bounce off it to resume trending or signal an exit on price cross. 20, 20-period settings make Smoothed Heikin Ashi good for pullbacks during unstable trends. Forex is a place of choice for such settings. Longer periods are also good for “buy the dip” strategies but trends that extend for a long time typically found in stocks or indices. 

Combining two Smoothed HA use is similar to the two moving averages however you can create different scenarios with the Smoothed HA bars and wicks. The most successful one is using the faster one for exits while the slower one is good for gauging trend direction and rebounds.

Our best trading practices in the next article will involve a very rare setup that consists of indicators that also measure an important market characteristic – volume. Customized yet simple, and very powerful for trend trading. 

Categories
Forex Basic Strategies

A Different Heikin Ashi Strategy – Trend Exit Guide

Most traders initially rely on what they hear, read, or otherwise find to be useful and informative, especially due to the enabling nature of this age of information exchange and media saturation. More often than not, these pieces of data prove to be half-truths, if not worse, and such a lack of skills and knowledge is then easily transferred across the global forex market. Due to the unrestricted access to partial, non-factual information, traders absorb too many fallacies, especially when these are related to indicators and strategies to earn a bigger profit. The same goes for the widely praised Bollinger Bands and Fibonacci, among others, which are some of the oldest and the most outdated tools that numerous sources still glorify despite their age and poor performance.

Some other tools and topics are simply copied from one source to another without much creativity and personal input. Nowadays we have heaps of materials with no innovative additions, which may not necessarily involve any new creation except for an original perspective. In this article, we will attempt to provide a fresh outlook on another popular topic from the world of forex trading – Heikin Ashi trading strategy. Also, this is just one example and opinion based on one group of professional technical swing traders, you can interpret the information the way you see fit.

Heikin Ashi is often perceived as one of the most basic indicators under the MT4 group, which another reason why some professional traders question its quality. In addition to being similar to another well-known indicator, Japanese Candlesticks, its name actually originates from Japanese and it translates as an average bar. Beginners mostly find it extremely useful because it makes finding the trade entry considerably easier. However, most available sources provide an insufficient amount of data as well as to abound in the lack of the right tips that can help traders earn a profit. It is common knowledge that, as with other similar indicators, Heikin Ashi offers two distinct candles, where the white candle suggests that a trader should go long, while the red one implies the opposite. Despite its simplicity, traders are not given an opportunity to make any settings adjustments, which additionally reduces the quality of this tool.

Furthermore, this indicator is so easy to see that everyone can see the same signals at any location on the planet, thus stripping you of the exclusivity that naturally comes with using a good indicator. Bearing all these facts in mind, any individual at any point in their forex trading carrier must be aware that simplicity and popularity do not necessarily equal supreme quality.

Regardless of this tool’s shortcomings, we should strive to be objective and provide a clear list of actions which traders should avoid if they decide to use Heikin Ashi. Firstly, traders should not use this indicator to enter trades because the number of losses is almost always higher than the number of gains. As we already said that Heikin Ashi is generally favored for its ease of use, beginners, as well as all other traders, should attempt to do a demo trade and see this for themselves. It is extremely easy to get excited while using this indicator early on, but using it to enter or even exit a trade will only make you feel more frustrated and incompetent at trading in this market. Moreover, Heikin Ashi’s candles function in an entirely different way from the regular forex candles we are used to seeing.

If you take a look at the image below, you will surely see a few prominent reversals in the chart (marked grey). These inviting points are precisely the places where you should remain focused just because most people fail to grasp the severity of entering a trade in between the grey areas (marked yellow). By measuring how trading, in this case, would turn out in advance, you could in fact understand that your price would probably never reach your take profit. What is more, before you could even see any profit from such a trade, you would probably need to go through more than a few losses, and no success afterward would be able to compensate for the degree of loss you previously experienced. Therefore, if you only allow yourself to see the surface and feel compelled to enter a trade only because of some superficial positives, you may lose all your confidence and severely endanger your financial stability as a result.

While we owe it to ourselves to call a spade a spade, this indicator can still offer some value, which other sources do not seem to be interested in. To be able to extract any such benefits from Heikin Ashi, you primarily need to be a trend trader using your own system. To manage a win, you will take half of your trade off after a certain number of pips and your move stop loss to the break-even. In case you have yet to discover an exit indicator you would prefer to use, Heikin Ashi can temporarily assist you with the rest of your trade. Simply put, if a trader is already going short, they will have to wait for the candle to become white to exit and vice versa. This indicator is not the best tool you could use to finalize a trade, but it certainly can be of great assistance if a trader has not decided on a specific exit indicator yet.

In comparison to not using an indicator to end a trade, Heikin Ashi can definitely render more pips and thus bring you more money than the other way would. However, if you already have an exit indicator you like or you are exploring your options, you can always use Heikin Ashi to compare the results it gives you to the ones your indicator of choice produces. It this comparison demonstrates any advantage of Heikin Ashi over the other indicator, you will know to continue looking for a better tool. This approach will save you much time and help you develop a safe and functional system you can rely on.

We know how important having a good algorithm is and Heikin Ashi can not only help you discover a good exit indicator, but it can also yield a great number of pips, even to beginners. Nevertheless, earning a few coins here should not stop you from looking further for an excellent tool that can bring even more success to your account. Keep searching for trend indicators and do not give in to passing compulsions that this indicator entails on the surface level. Avoid reversal trading and strive to see the entire chart as a whole measuring possible wins and losses and demo trading to compare. You can truly stand out from the crowd by learning how to differentiate between acting upon a feeling and making decisions based on some tangible data.

Do not be misguided by a vast number of sources promoting price levels, support/resistance lines, and other ineffective strategies that will not get you in or out of a trade on time or without losing a substantial amount of money. With a clear strategy, a trading mindset, and an effective exit indicator, you can get to wherever you want to be and Heikin Ashi can serve as a transitioning step on the way to reaching your goals. Finally, understand that all the time you invest in learning about Heikin Ashi and other indicators, testing, and making necessary comparisons will only help you grow as a trader for these are the skills you will always be able to call upon in the future.