Description
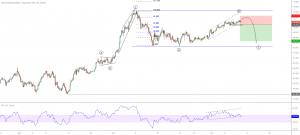
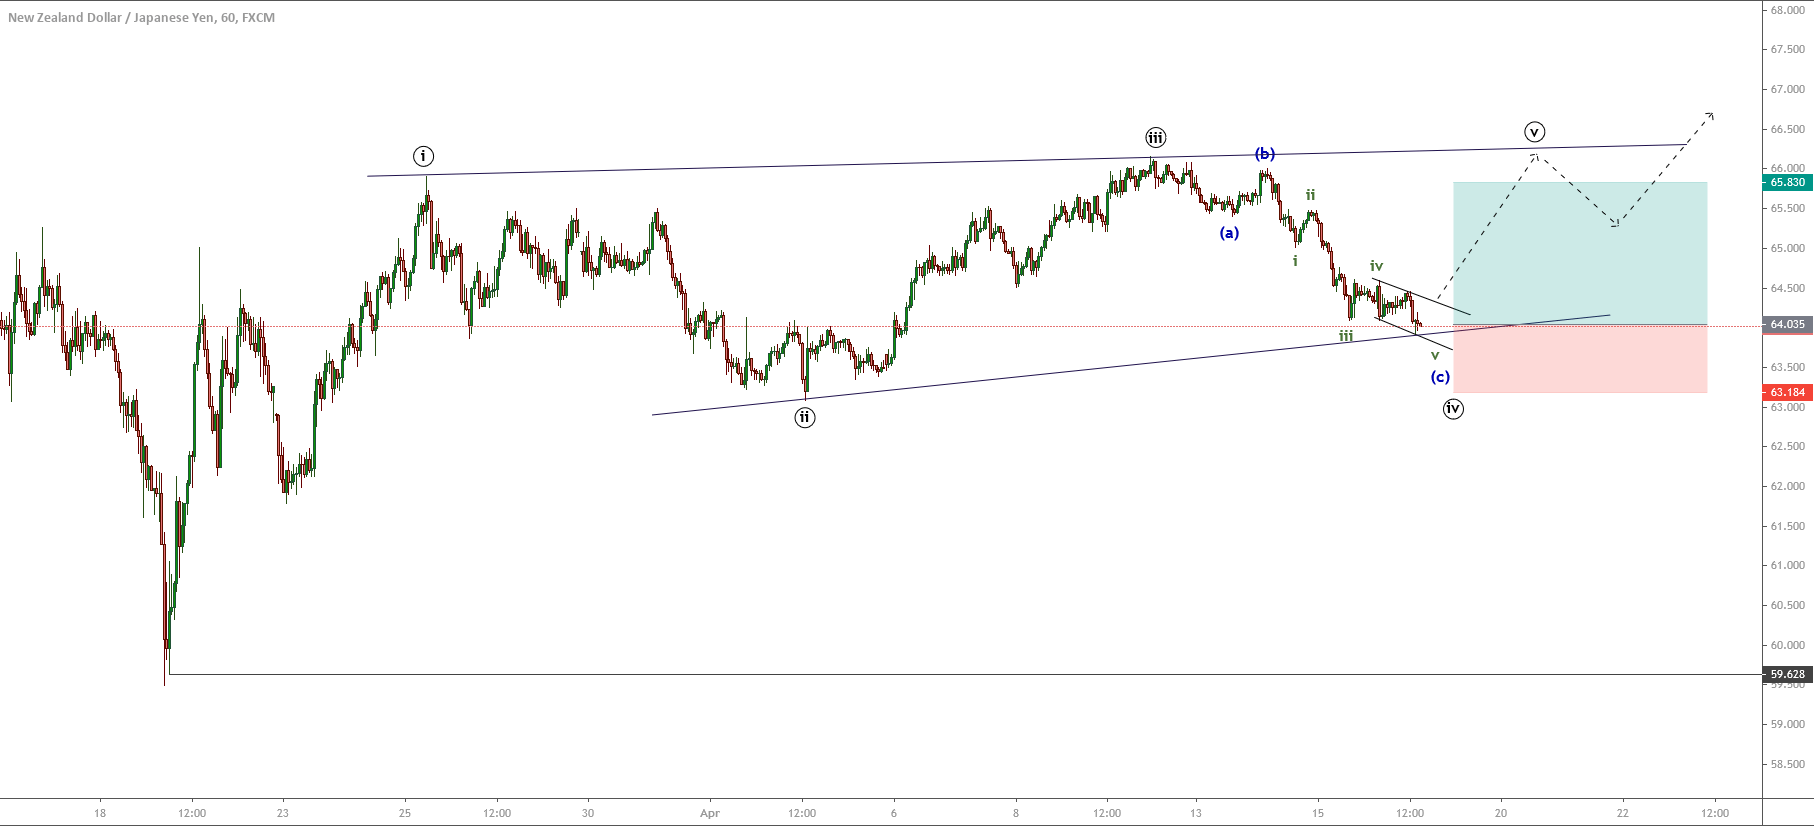
The NZDJPY cross in its hourly chart illustrates the progress in a potential leading diagonal pattern. This Elliott wave formation calls for further upsides in the coming sessions.

According to Elliott wave theory, the leading diagonal is a five-wave formation subdivided in a 3-3-3-3-3 internal sequence, in where its five segments overlapped one each other tends to appear in a first wave.
Our bullish scenario considers the upside corresponding to its fifth wave of Minute degree identified in black, from the level 64.035, with a potential profit target at 65.830. The invalidation level locates at 63.184, which corresponds to the end of the second wave in black.
Chart
Trading Plan Summary
- Entry Level: 64.035
- Protective Stop: 63.184
- Profit Target: 65.83
- Risk/Reward Ratio: 2.39
- Position Size: 0.01 lot per $1,000 in account.