Description
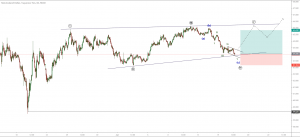
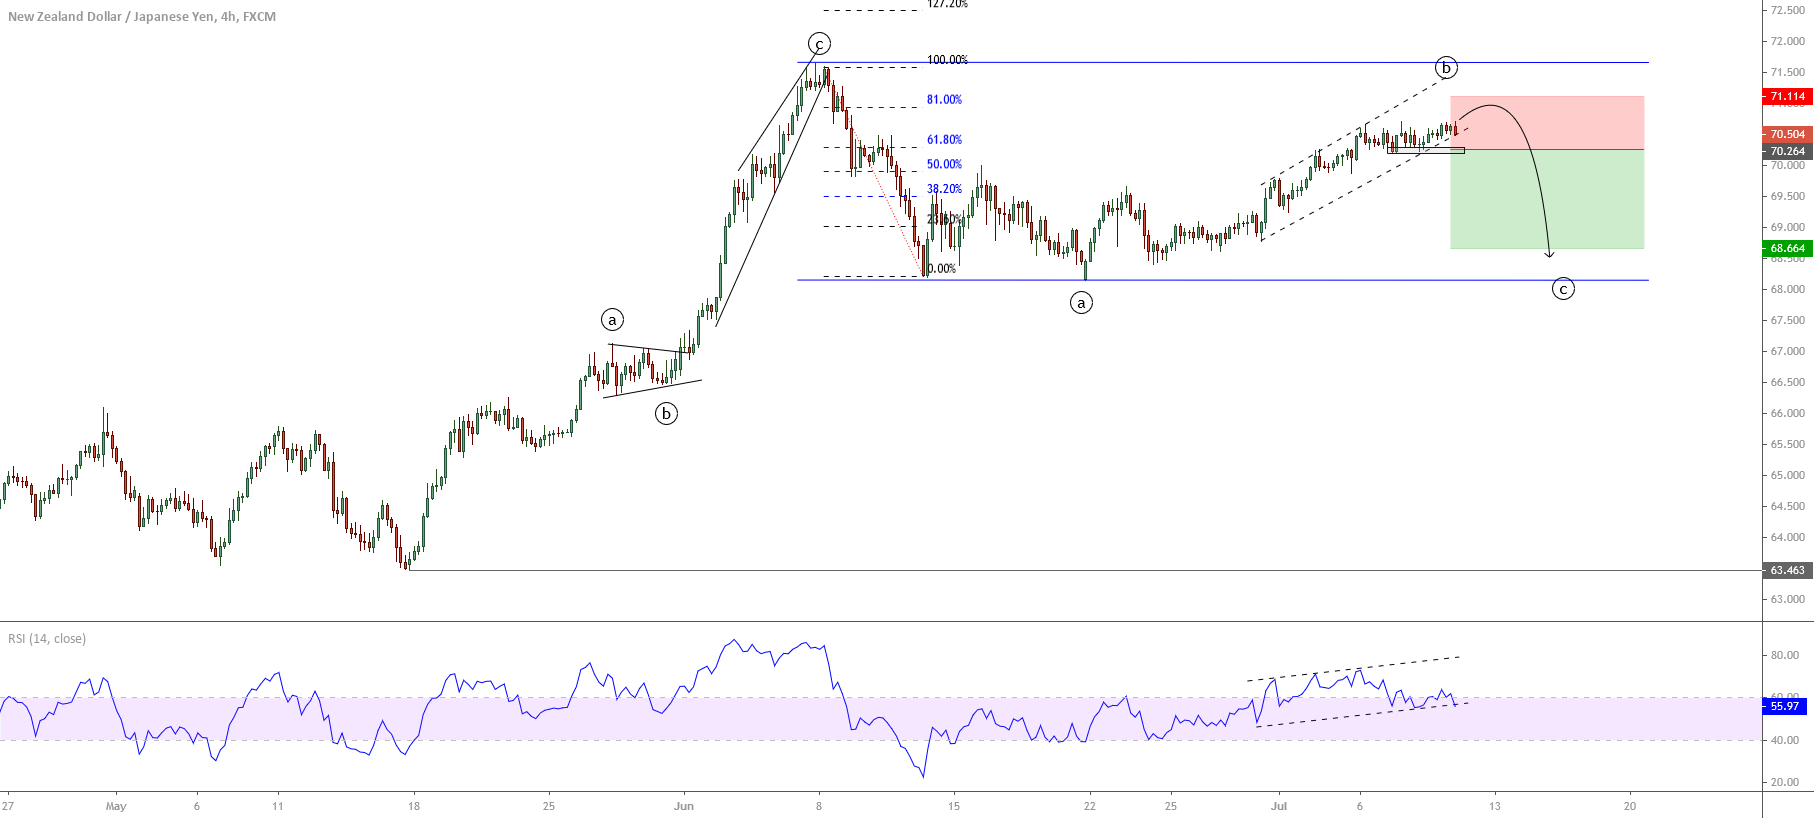
The NZDJPY cross in its 4-hour chart exposes the advance in a sideways structural series that corresponds to a potential regular flat pattern, which shows signals of finalization of its wave ((b)) giving way to its wave ((c)) of Minute degree labeled in black.
The mid-term picture illustrates the last upward sequence that began on May 15th at 63.463. This ascending movement, which seems to be an impulsive sequence, corresponds to an aggressive corrective formation, which ended on June 07th at 71.667.
Once the price completed its wave ((c)), the price action started a massive sell-off win three moves until 68.156 reached June 21st from where NZDJPY cross began to advance in its wave ((b)) developing a narrow range. The lower volatility revealed on the wave ((b)) progress shows us the alternation principle, which calls for a further decline corresponding to wave ((c)).
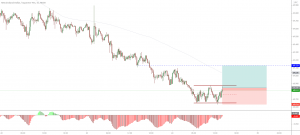
On the other hand, the RSI oscillator illustrates the decreasing momentum of the wave ((b)). In this context, the breakdown below the previous lows at 70.36 could allow us to incorporate us to the next wave ((c)), which could drop until the zone of 68.66.
The invalidation level of our bearish scenario locates at 71.114.
Chart
Trading Plan Summary
- Entry Level: 70.23
- Protective Stop: 71.08
- Profit Target: 68.63
- Risk/Reward Ratio: 1.88
- Position Size: 0.01 lot per $1,000 in trading account.
Check out the latest trading signals on the Forex Academy App for your mobile phone for Android and iOS.