Description
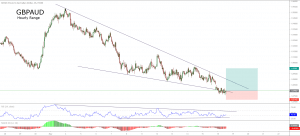
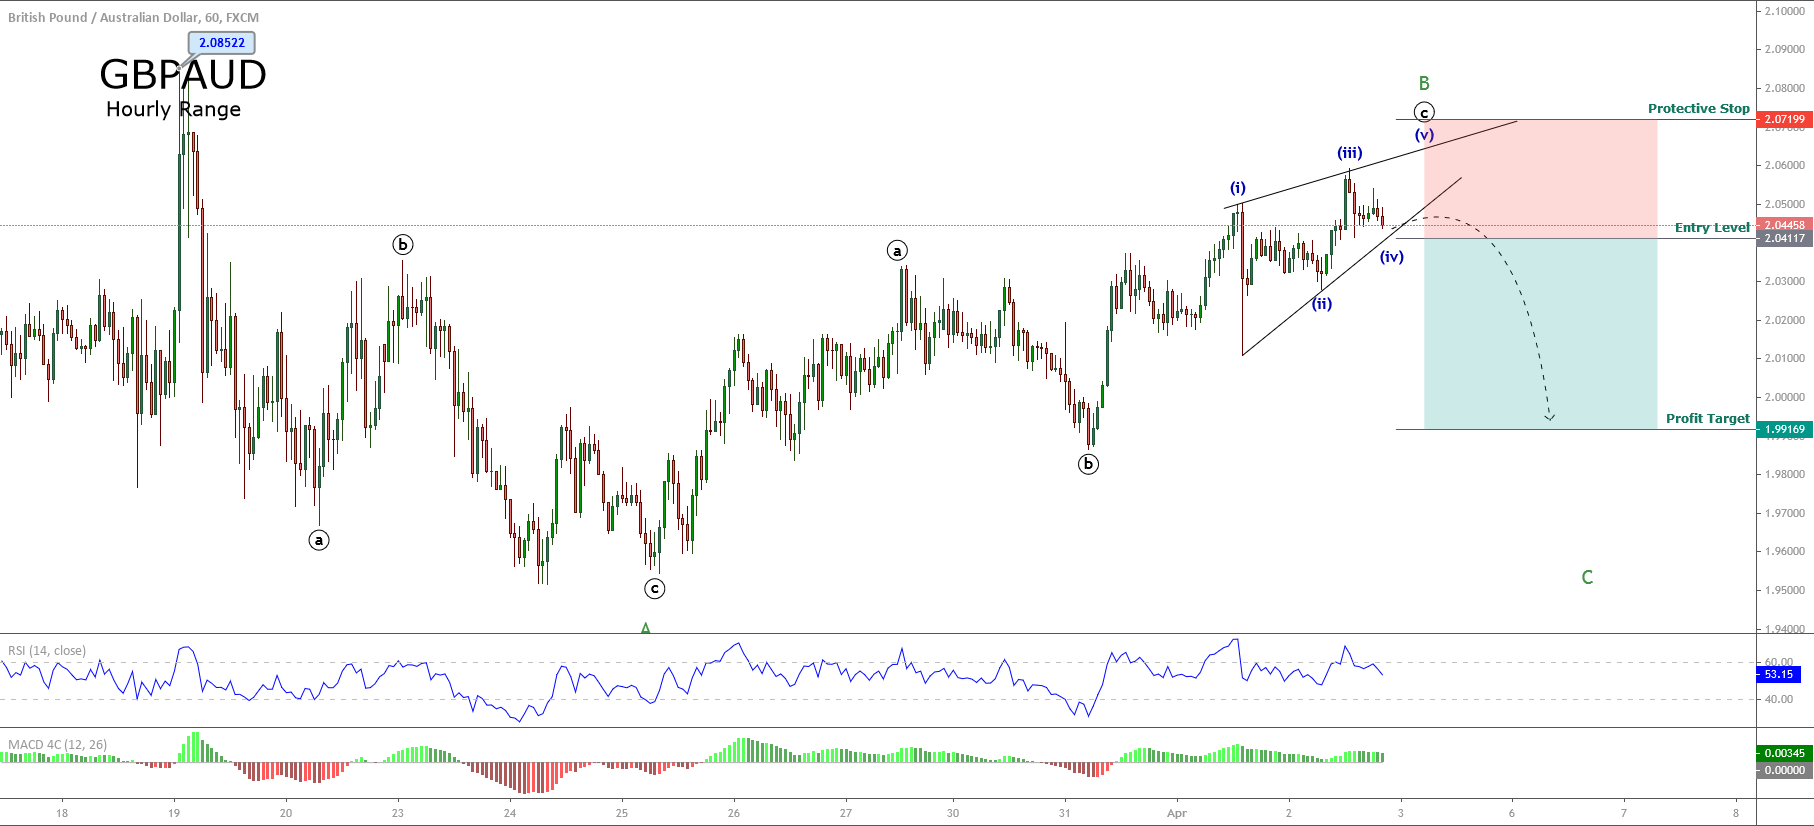
The GBPAUD cross in its hourly chart shows the progress of a corrective sequence that could correspond to a wave B in an exhaustion stage.
Once the cross reached its top at 2.08522, the price began a corrective structure. According to Elliott wave theory, the corrective sequence holds three segments.
From the chart, we observe that the second wave corresponds to a zigzag pattern (5-3-5), from where the price action suggests that the second wave corresponds to an incomplete ending diagonal structure.
The breakdown and close below the last pivot level at 2.04117 could be indicative of further declines, which could reach until 1.99169.
The level that invalidates our bearish scenario locates at 2.07199.
Chart
Trading Plan Summary
- Entry Level: 2.04117
- Protective Stop: 2.07199
- Profit Target: 1.99169
- Risk/Reward Ratio: 1.6
- Position Size: 0.01 lot per $1,000 in account.