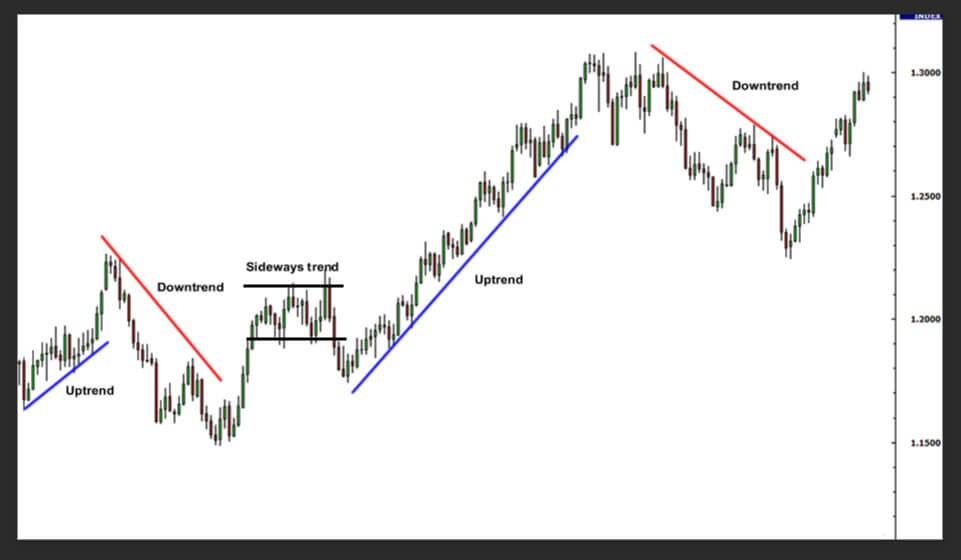
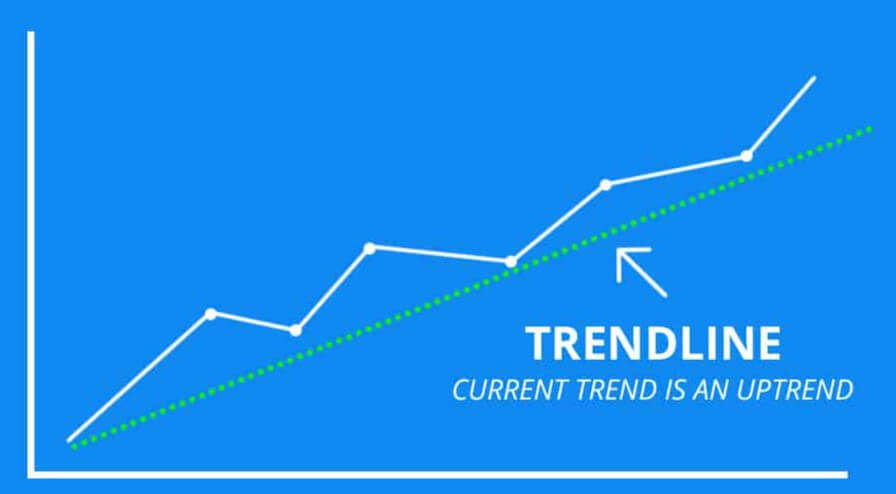
Trend lines are simply lines that are drawn on a chart that when analyzed will give you as a trader an idea of the possible directions of the markets. A trend line is generally drawn over a pivot high and under pivot lows in order to show h prevailing direction of the markets. They are a visual representation of the support and resistance levels for the timeframe that you are looking at, they can show the direction and the speed of the price, and can also be used to help in the aid of working out various different patterns within a chart.

That’s what trend lines are, but what exactly do they show us? Trend lines are one of the most widely used and important tools that many traders use, especially for those into technical analysis. Instead of looking at past results and patterns, people who use trend lines are looking for the current trends in the markets. They will help a technical analyst to determine the current direction of the markets, as well as how quickly the rice is moving in that direction. Many traders believe that the trend is your friend and will trade in the same direction, so they use the trend as an indicator as to which direction to trade in.
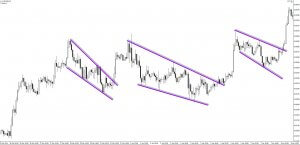
Trendlines are pretty easy to use, even for those that are just starting out with trading. They can be drawn onto a chart in a simple way using open, close, high, and low markets. Some traders also like to use more than one trendline, they connect the highs to create an upper line and the lows in order to create a lower line. This will then create a channel that will offer the trader a view of the support and resistance levels. This can then be used to look for breakouts, a situation where the price breaks above or below the upper or lower lines, and this for some is the best opportunity to put on a trade.
There are some limitations to trendlines. The main limitation is that they need to be readjusted as more price data comes in. Keeping the same line when the markets have changed will make the indication that they are providing completely irrelevant to the current situation. So you will need to adjust it each time the prices change. There is also no set place to attach the points to, different traders will use different data points, meaning that each person’s trend lines will be slightly different from each other, which can, in turn, give a completely or slightly altered image of what the markets are doing. If you create a trendline during a period of low volume, as soon as the volume increases it can easily break through the lines, so trend lines are more reliable during times of at reduced average volume.
There are ways to get around the fact that they need to be constantly adjusted. There are some indicators and expert advisors that can help to draw on the lines automatically, these can also then be used to update the lines without any input from yourself. The downside to this is that it will be doing it automatically, so you won’t have much control over where the lines are being drawn. You’ll need to work out whether you want to put the work in and do it manually and accurately to your own likes, or to allow it to happen automatically but understand that the ones may not be in the exact places that you prefer.
So the question now is whether or not you could use trend lines by themselves in order to trade. The answer is both yes and no. Not the most helpful I am sure that you agree. Trend lines offer us a lot of information and can be enough for some people and for certain more simply trading strategies. Using the trendline will give you an indication of the direction that the markets are going, and many traders will only trade in the same direction as the trend. So the indicator does give you an idea of the direction to the trend, but the problem is that it does not give much more information than when used by itself.

You can also use two trend lines, an upper and a lower. This can give you slightly more information. Having both the upper and lower trendlines will create a channel that the price is moving along, and you can use this channel to work out a little more information. If the channel is narrowing or widening will give you a little idea of what the markets are about to do. You can also use those trend lines to look for breakouts. The price should be moving between the channels. Once it breaks out from either the lower or the upper line, then this could indicate that a breakout is about to happen, something that a lot of traders like to trade.
Ultimately, the trend lines are very simple to use but they offer limited information. So you can use them alone in order to analyse the markets and to trade. There may well be some people who are successful at trading this way. Having said that, a lot of traders like to use trend lines along with a number of other indicators, and the trend lines are exactly that, an indicator. They do not give you exact trades to enter, they do not provide you with a whole host of information, just a simple high and low channel. So many traders like to use trendlines along with a number of other indicators which will allow them to better analyse the markets and to work out what may be happening next.
The answer to our question is yes, you can use trendlines alone to trade, but you will be provided with very limited information. Using only trendlines will work with a few basic strategies, but if you want to use a more advanced strategy then you will need to use more than just trend lines to do your analysis.