Introduction
The ascending top is a technical chart pattern, where each peak in price is higher than the previous peak in price was. The ascending tops are such a predictable pattern because of its amount and time price action required to complete the formation of the pattern, which increases the reliability of the pattern. Ascending tops is a bullish chart pattern. Trading is all about the matter of probability. If you see the price action continuously printing the new highs and higher lows in an uptrend, then expect the Ascending top pattern on price chart.
3 Tips for How to Trade the Ascending Tops Chart Pattern.
TIP 1 HOW TO ENTER THE TRADE.
First of all, find out the trending conditions and look for two minimum ascending tops and two higher lows. Once the price action prints the second top, wait for the price action to reach the major support level, here you can use the other technical tools to identify the trading signals. Don’t use some of the difficult tools to identify the trade, instead choose the simple technical tools. Some traders here like to use the Gann Square or, Gartley patterns or Elliott waves by using these tools you are making it hard for you to trade the market. So here look for the simple tools such as trend lines support and resistance levels.
TIP 2 HOW TO PLACE YOUR STOP LOSS ORDERS.
The problem with the traders is they never choose to believe that trading is the game of probabilities and always trade the market without the stop loss. No matter how good the setup is, no matter how reliable the trading opportunity is, always go with the stop loss. For this pattern, the best place to put the stop loss is below the higher low created after the second top.
TIP 3 WHEN TO BOOK A PROFIT.
The problem with the traders is that they exit their trade very early because of fear or panic, or the voice inside keeps telling them their trade is not going to perform. So by having a lot of self, negative talks traders end up making little money in the market. It doesn’t matter how good your technical analysis skills are if, at the end of the day, you end up making little or no money in the market. No one call you Pro Analyzer or a Trader, you are a wannabe.
So how long do we stay in a trade?
There is one simple rule you can use, and that is to stay in a trade anticipating a price move at least the same size as the prior impulsive move was.
Trading Example By Using the Ascending Tops.
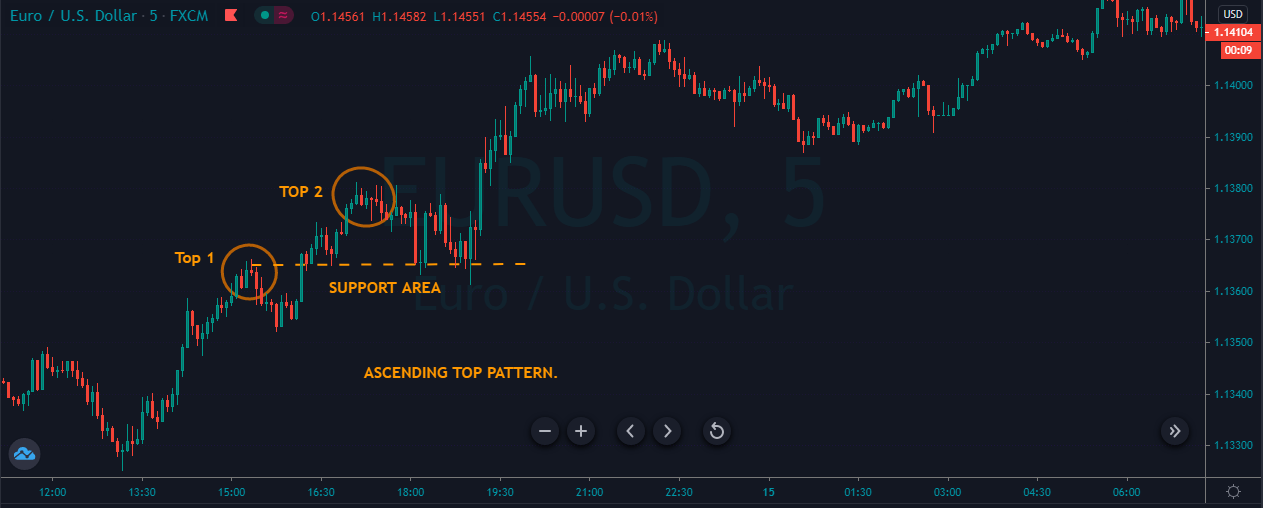
The image below represents the ascending top pattern in the EURUSD forex chart.
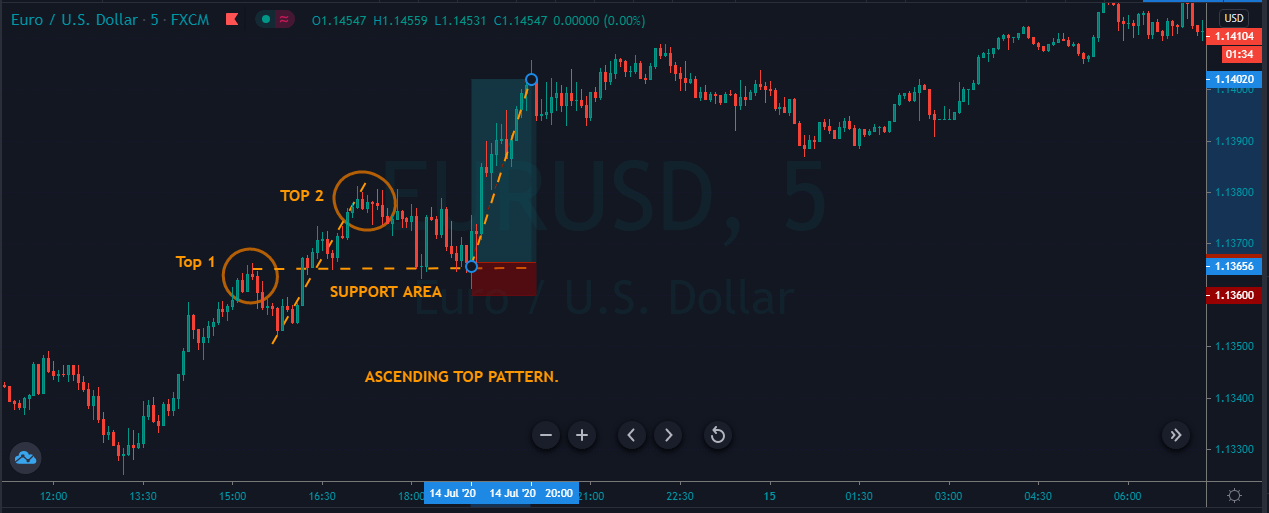
As you can in the image below, it represents our entry, exit, and stops loss in this forex pair. The EURUSD was in an overall uptrend, so in a trending market, we expected the ascending top pattern. When the price action printed the first top, we choose to wait for the second top, and when the second top printed, the price action immediately goes down for a correction to the most recent support area. The price action held at the support area for the couple of candles, which is a sign to go long. As we explain above, the stops below the support were good enough and the two dotted lines on a price chart indicating the size of the impulsive leg, so we choose to close our trade based on the size of the previous impulsive move.
ANOTHER EXAMPLE.
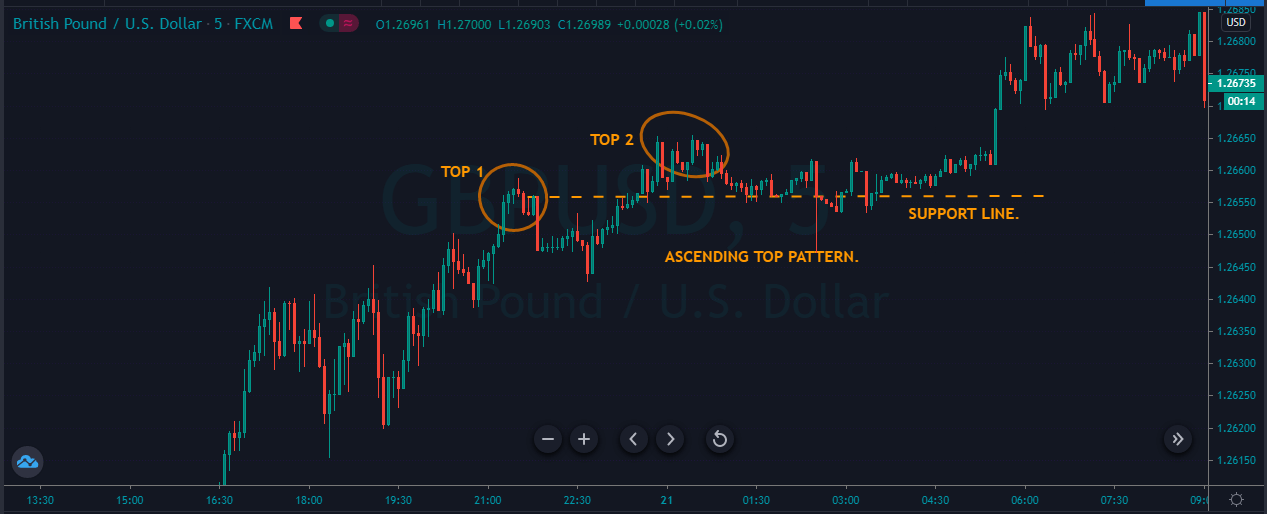
The image below represents the ascending top pattern in the GBPUSD forex pair.
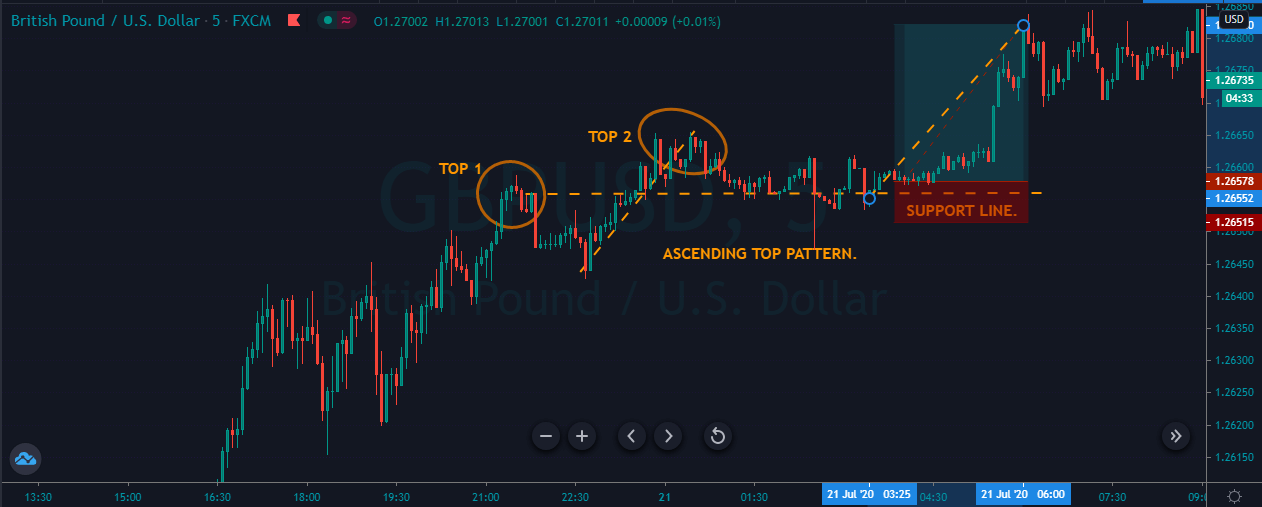
As you can see, the image below represents the strong uptrend in the GBPUSD forex pair, so when the price action printed the first and second top, it pulled back to the most recent support area. The sellers during the pullback phase weren’t strong enough, so we didn’t expect any breakout of the most recent support area, instead of when buyers respond strongly from the support area, we choose to go long in this one. The take profit was similar to the previous move, and the stop was just below our entry.
Conclusion.
In both of the above examples, have you noticed that the buying trend in both of the examples was super strong. This is the one essential component or the foundation of the ascending top pattern. You will always going to witness this pattern in the strong trending market in any underlying asset. Try not to trade it in the channel conditions or ranges because we choose to go for the smaller stops in trending conditions. If you put the smaller stops in ranging or in the channel market, you will end up losing in your trades because of the higher volatility. By following the below-mentioned steps, you can confirm the ascending top pattern on the price chart.
- In an uptrend, find the two tops where the second one is higher than the first top.
- Wait for the correction after the second top.
- The correction must be choppy if the down movies aggressive then stay away from the market.
- After you confirm the pattern wait for the price action to test the support area.
- Here you can look for any bullish candle pattern to enhance the probability of the setup.
- Take buy entry.
- Put the stops below the support area.
- Take profit must be the same the size of the previous impulsive move.
- If you desired the deeper target, then simply hold your position, and after the third top, expect the price to move the same as the size of the previous leg.
- In some cases, you will get the deeper targets, and in some, you don’t. To have bigger gains, choose the setup very carefully, the super-strong trending market is always appreciated to trade ascending top pattern.