Description
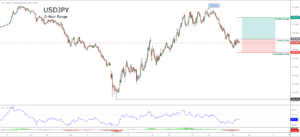
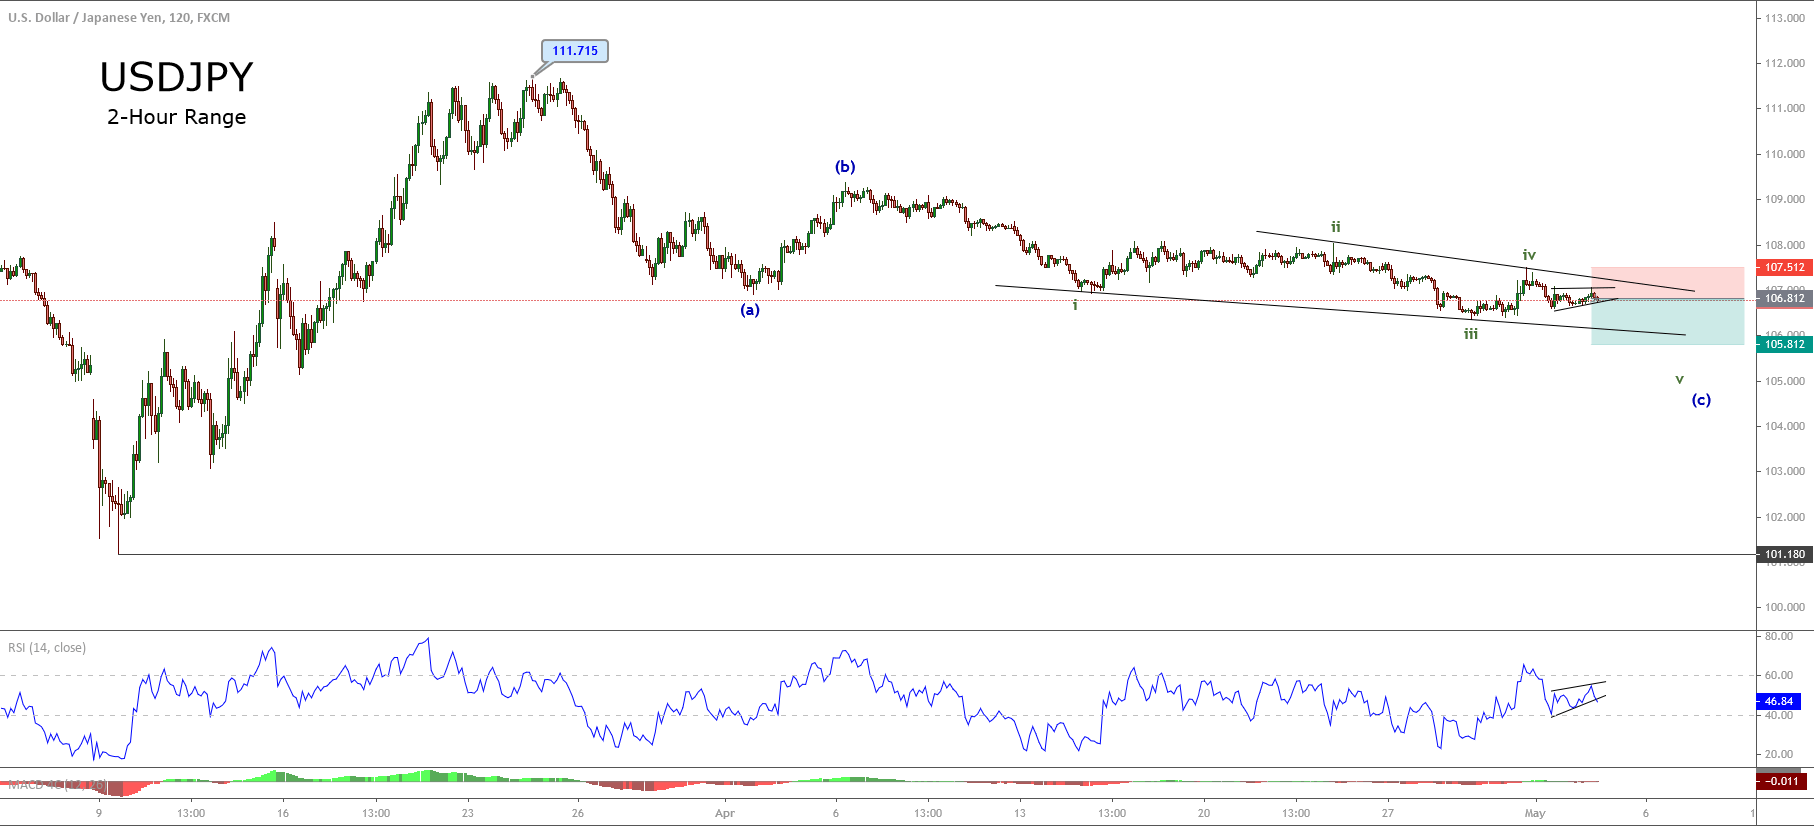
The USDJPY pair, in its 2-hour chart, exposes an incomplete bearish Elliott wave formation as an ending diagonal pattern, which suggests the possibility of further declines for the coming trading sessions.
Currently, USDJPY develops a bearish corrective sequence that began on March 24th, when the price topped at 111.715.
The internal structure of the three-wave sequence shows an incomplete ending diagonal pattern in the wave (c) of Minuette degree labeled in blue, from where the price should develop its fifth wave of Subminuette degree in green.
The intraday chart shows a consolidation structure in progress, which could provide an opportunity to place us on the sell-side. Our potential profit target locates at 105.812, which coincides with the lower line of the downward diagonal.
Our bearish scenario will be invalid if the price breaks and closes above 107.512, or surpass the upper line of the diagonal pattern.
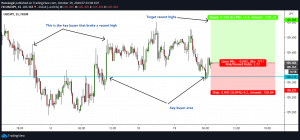
Chart
Trading Plan Summary
- Entry Level: 106.812
- Protective Stop: 107.512
- Profit Target: 105.
- Risk/Reward Ratio: 1.43
- Position Size: 0.01 lot per $1,000 in account.