Exchange-Traded Funds, or better known as ETFs, are investment instruments that are traded in a centralized market. In this educational article, we will see how we can use them to create negotiating opportunities.
Exploring Markets and Diversification
In financial markets, there are virtually unlimited possibilities for investment. Decisions such as what to buy? What to sell? As well as the geographical region, level of risk, liquidity of the market or assets, expected profitability, among other aspects, are factors that an investor can face when planning his future investment.
Use of Intermarket Spreads
In simple words, a spread is a strategy on which the investor buys one market and sells another market simultaneously. For example, in the currency market, an investor could buy a contract of €100,000 and simultaneously sell a 100,000 euro on pounds sterling. In other words, this trade is equivalent to go long in the EUR/GBP spread.
Creating a Spread with ETFs
We can create different spreads according to the market in which we are interested in investing. To this end, the decision criteria will be those ETFs with higher liquidity. The following tables represent ETFs that are associated with commodities, particularly Gold and Silver.
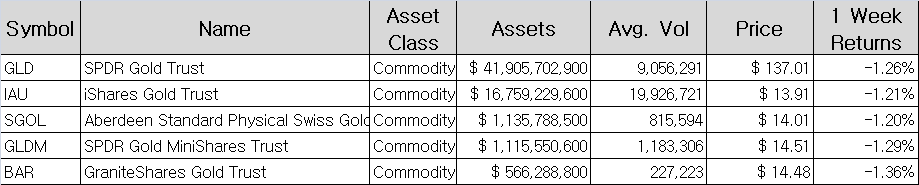 Table 1 – ETFs Based on Gold
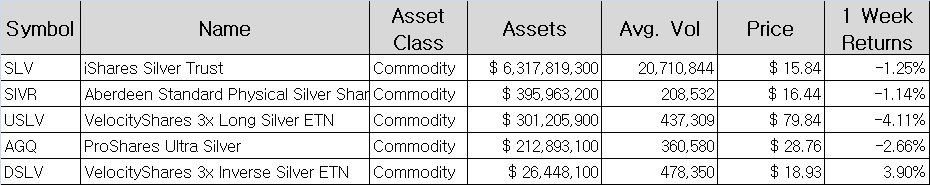 Table 2 – ETFs Based on Silver
From tables 1 and 2, we see that ETFs GLD and SLV record the largest size in each group. Consequently, they will be used for the construction of the GLD/SLV spread.
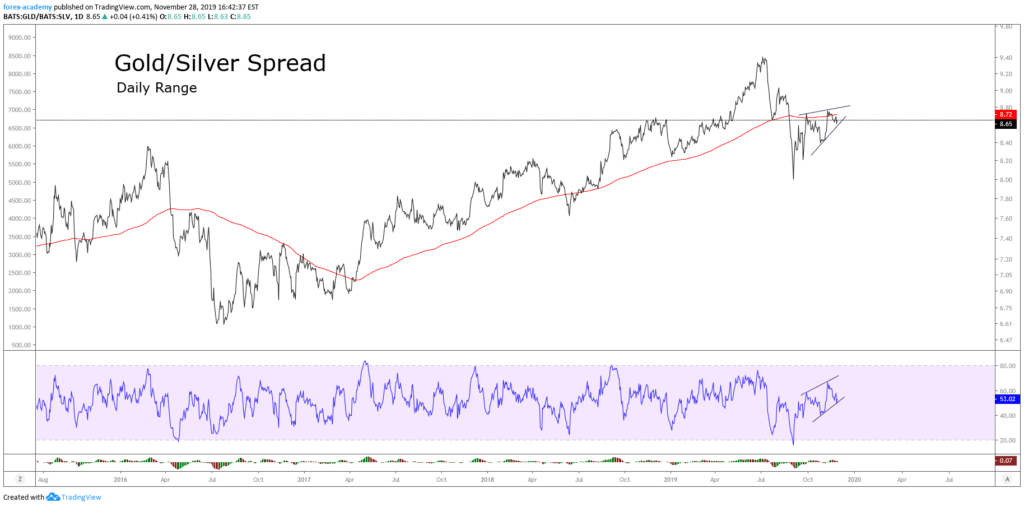
The GLD/SLV spread in its daily chart shows both precious metals developing a corrective structure as a B wave. Therefore, the Gold/Silver spread could see a new low. In other words, we expect a decline in GLD and an upside in SLV.
The following example shows the spread between SPY and QQQ in its daily chart. The ETF SPY is characterized by replicating the S&P 500 index, while QQQ replicates the NASDAQ 100 index.
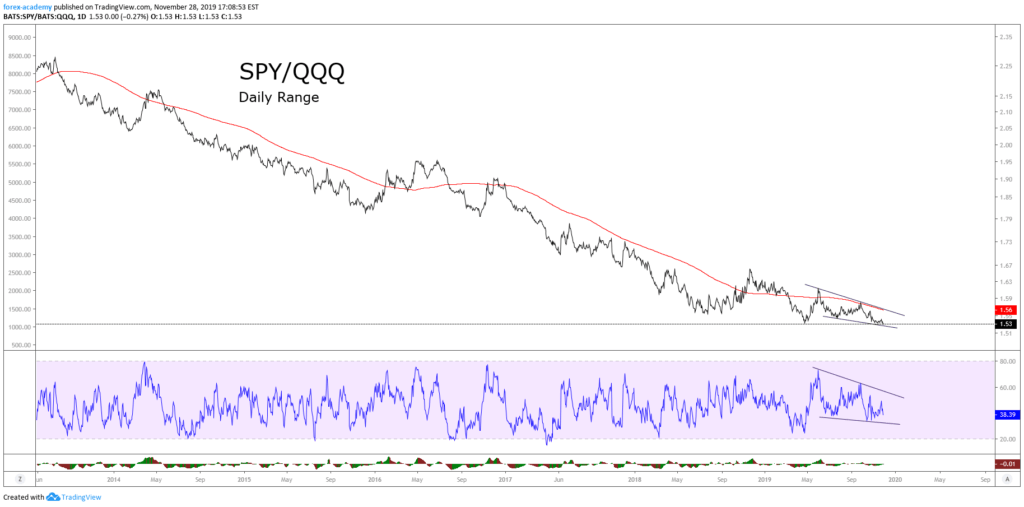
In the spread graph SPY/QQQ, we detect that the price is developing an Ending Diagonal structure in a bearish cycle. Also, although QQQ continues to push downwards in front of the SPY, it should be noted that this pattern is an exhaustion formation. Thus, it is likely that these markets reverse soon. In this case, the positioning strategy would be a long position in SPY and another short position in QQQ.
Conclusion
After the analysis made here, you may see that everything traded, including pairs, can be considered as spread bets between an asset the underlying payment method. It is just that, considering the relative stability of fiat money it makes more sense to use the term spread when exchanging two volatile assets, as one of the main objectives of spread bets is to tame the overall market volatility since the investor is selling and buying volatility at the same time.
According to what here is exposed, the creation of spreads can help explore the strength/ weakness situation between markets. Likewise, the exercise could help to make decisions on which assets to choose. It should be emphasized that before entering a market, the spread’s price action must confirm the movement that is predicted.
Finally, this type of analysis can be extended to the futures market between futures contracts with different or similar expirations. This kind of analysis can also be applied in the stocks market, bonds, etc.