Fibonacci analysis: A mathematical ground to construct support and resistance price levels.

One of the most complex aspects of trading certainly has to do with risk. How to measure and manage it regardless of any given set up or market environment or direction of the price (i.e., whether it is bullish or bearish). Potential profit and risk are thus correlated concepts; consequently, higher yields imply higher risks and vice versa. The main objective of any sound price analysis is then to maximize profit by keeping risk tightly under control; or, in practical terms, to preserve profit from running off in the long-run. However, the complete elimination of risk is nothing more than an illusion, what truly matters is to make it compatible with the preferred profit-generating setup, and it all starts with recognizing such risks and controlling them through the application of a wide range of tools. Despite the complexity of risk management, novices should not be discouraged; after all, even the most experienced traders still fail when applying their preferred tools, sometimes due to a know-it-all attitude, and because such tools are not comprehensive enough to account for all market conditions.
Fibonacci-based techniques are powerful enough to dedicate a complete set of articles; they will cover the conceptual basics, some easy-to-digest mathematical grounds, and of course, practical ways of applicability.
The Fibonacci sequence is an infinite sequence of natural numbers, which begins as follows –
0,1,1,2,3,5,8,13,21,34,55,89,144, 233, 377….
Starting with 0 and 1, the following numbers are the sum of their two predecessors. The golden ratio, on the other hand, is a universal law that explains that everything that grows and decays, evolves. Trading in financial markets is just one of the varied ways to apply the sequence. The golden ratio is a continuous geometric ratio resulting from a straight line between two number A and B. The straight line is divided into a segment longer than the other, and the total A + B segment has the same ratio to the more extended segment A as the long segment A has towards the shortest segment

The relationship would be written as follows: A + B: A: A: B. The golden ratio is an irrational number and the positive solution to this relationship is 1.61803398874989 … This relationship is found in some geometric figures and in nature, as for example in the shell of Nautilus, a species of mollusk.

This golden relationship is viewed as an aesthetic and even divine character for some people. When a Fibonacci number is divided by its predecessor, a ratio is created, and, as those numbers become larger this ratio will approach the golden ratio.
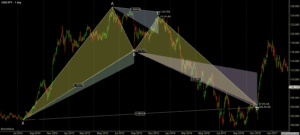
The power of Fibonacci when added as an extra tool of market analysis lies in the fundamental observation that price does not move in a linear fashion; instead, it progresses in oscillations that can match natural ratios therein described. Put it differently, Fibo ratios describe the way price naturally moves in either direction, so that every new “step” higher or lower (regard such moves as waves) generates price clusters known as pivots; such “barriers” if you will follow patterns where levels are “stationary” areas usually categorized as supports and resistance if price has a bearish (low) or bluish (high) bias if you will.
Through the Fibonacci analysis and Phi ratios, you can test the laws that follow the market and therefore if we follow these principles (instead of going against them), we will be able to anticipate future movements of the market in a more precise fashion. Here is precisely where Fibonacci becomes relevant, either to predict retracement of extension price levels.
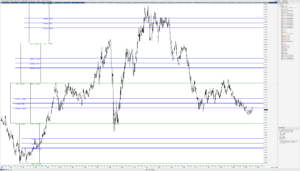
It comes as straightforward that Fibonacci belongs to what traders categorize as “technical analysis” as complementary to “fundamental analysis”. As for the retracement appliance of Fibo, the anticipated price levels are setbacks that refer to the possible support areas where buyers re-enter long positions if the dominant trend is bullish; or resistance levels where sellers re-enter short positions if the dominant trend is bearish. These levels are constructed by drawing ranges between the extreme points of the analyzed movement and the distance between the limits of the range there are subdivisions that will be vertical distances and the key percentages of this distance will be 38.2%, 50%, 61.8%, etc.
Why are we talking about retracements? Because in the technical analysis it is known that the prices of an asset move in “tendencies” (waves) either bullish or bearish, but that trend is not continuous; on the contrary, it has levels where the price stagnates due to such resistances or supports levels, simply because the market does not have completely vertical movements but oscillations within that trend.
Given the confirmation of a setback in the price of an asset, Fibonacci retracements will seek to calculate the magnitude of this movement. To achieve this, the Fibonacci tool available in the trading platforms is used and the percentages are applied which are obtained from the Fibonacci series on the magnitude of the previous trend. The percentage of 61.8% is known as the golden ratio and is the limit of the quotient that is obtained from the division of an element of the Fibonacci series with its previous number as the series tends to infinity. The percentage of 50 is equivalent to half the advance of the main trend and the percentage of 38.2 is the result of the subtraction of the unit and the percentage of 61.8%. The above can be seen reflected in the following graph, which shows how a regression would look depending on the Fibonacci percentage.

Needless to say, this article introduces the very basis of how Fibonacci ratios can be applied as means to anticipate price retracements (or extensions) in the simplest form; such a tool is nothing but a mathematical approach to the natural ways price develops in any given trend. Being able to draw support or resistance levels by connecting the highest and lowest levels of a certain wave is, however, the first step of the process of charting. More advanced applications refer to the construction of price clusters by, for example, relating different waves from a varied array of time-intervals. To put it differently, Fibonacci is the keystone of more complex methods of technical analysis, but that will be the subject of other articles.