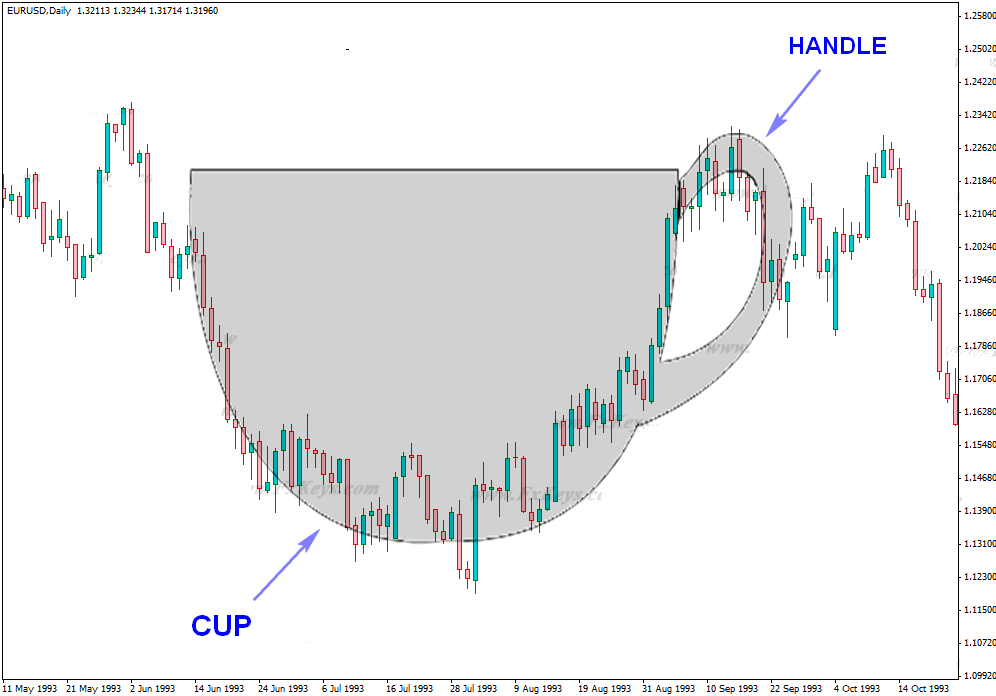
Cup and Handle is a classical reversal chart pattern, defined by William J. O’Neil in his 1988 book “How to Make Money in Stocks”. As its name implies, there are two parts to the Pattern: The Cup and Handle. A cup forms when the prices failed to print the brand new lower and the cup looks like a bowl or rounding bottom. After the completion of the cup, a trading range develops o the right side, which is a handle portion and the handle portion never drops into the lower half of the cup. The break of the handle portion is a signal of the buying trend if the handle portion is too deep or stronger than the buyers of the cup portion then avoid trading the Pattern.
TRIX INDICATOR
TRIX stands for Tripe Exponential Moving Average. Jack Hutson develops the indicator in the early 1980s, and as the indicator name suggests, it shows the rate of change in a triple exponentially smoothed moving average. TRIX is momentum as well as an oscillator used to which used to gauge the momentum as well as overbought and oversold signals. The positive values of the TRIX are an indication of an uptrend, whereas the negative values of the indicator are a sign of the downtrend. Extreme positive values indicate the excessive supply and the extreme negative values are an indication of the excessive demand in the market. Bullish and Bearish divergence of the indicator is also useful to determine the upcoming reversals. Centerline crossovers, Bullish and Bearish reversals, and divergence is a major signal used by traders to trade the market.
TRADING STRATEGIES
FIRST TRADE
The image below represents the Cup and Handle Pattern on the AUDCAD forex pair.
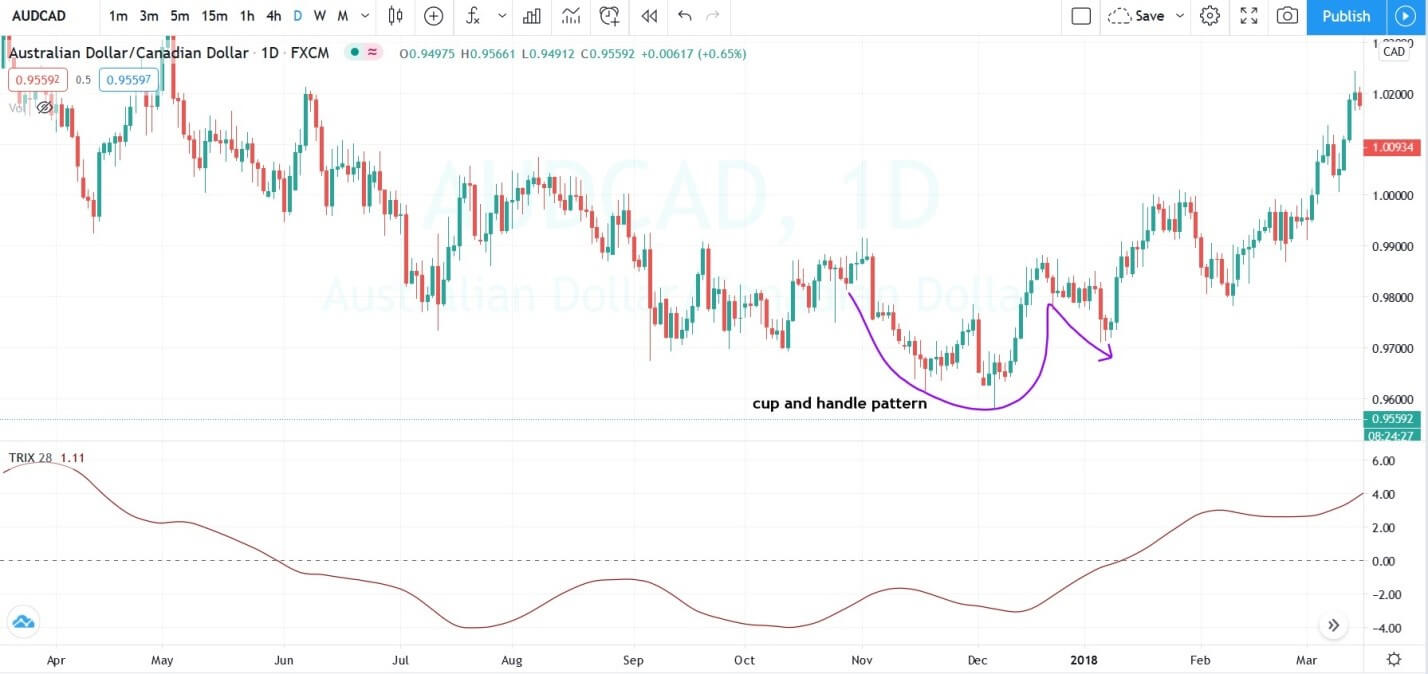
The image below represents the entry, exit, and stop-loss in the AUDCAD forex pair. As you can, the currency was in a downtrend, but at the same time, buyers were also equally strong, which means we are witnessing the end of the downtrend. If you find the cup and handle Pattern in the weak market, then simply it’s a way better sign where we can expect the high-risk reward ratio trades. In the below image when the market printed the cup portion, we wait for the handle portion, and when the TRIX indicator goes above the zero line, it means the buyer is back, and we took the buying entry. The red dotted line on the price chart was the support area in which we choose to take an entry; it’s even better if you found the extra clues to confirm the entry.

SECOND TRADE
The image below represents the cup and handle Pattern in the EURAUD forex pair.
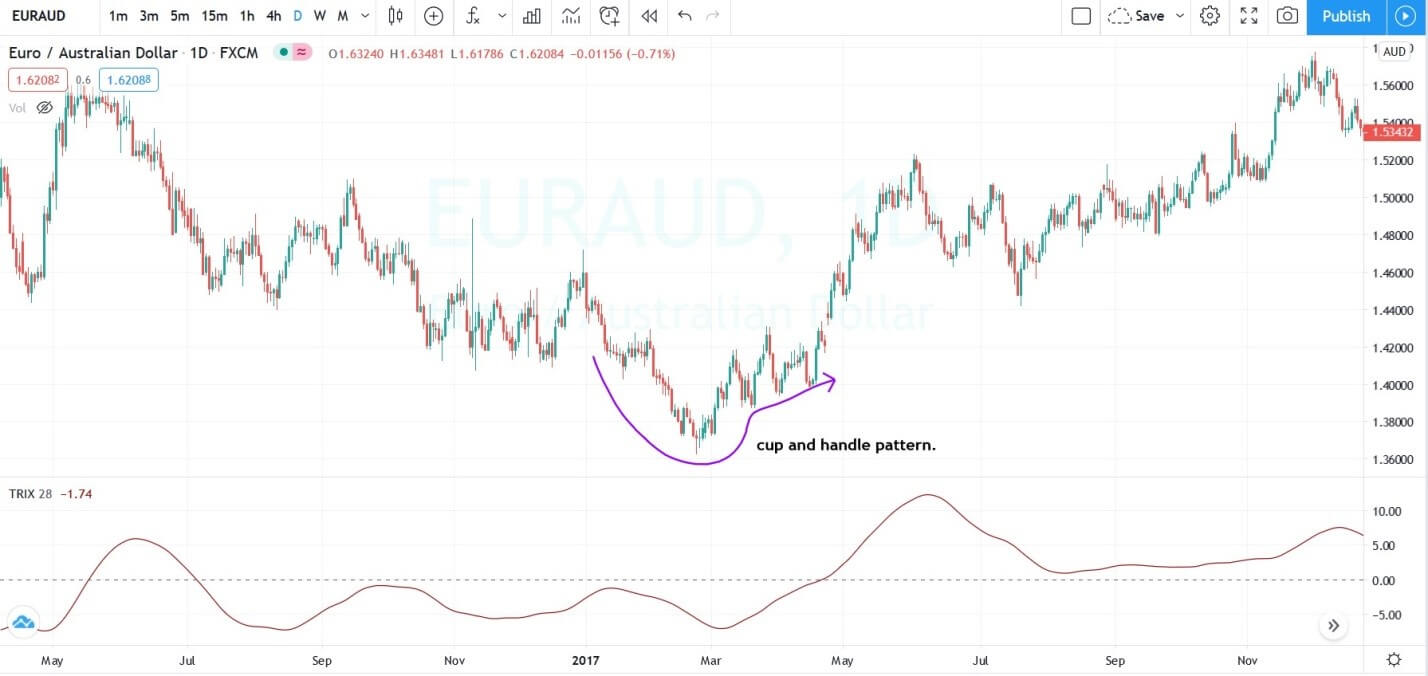
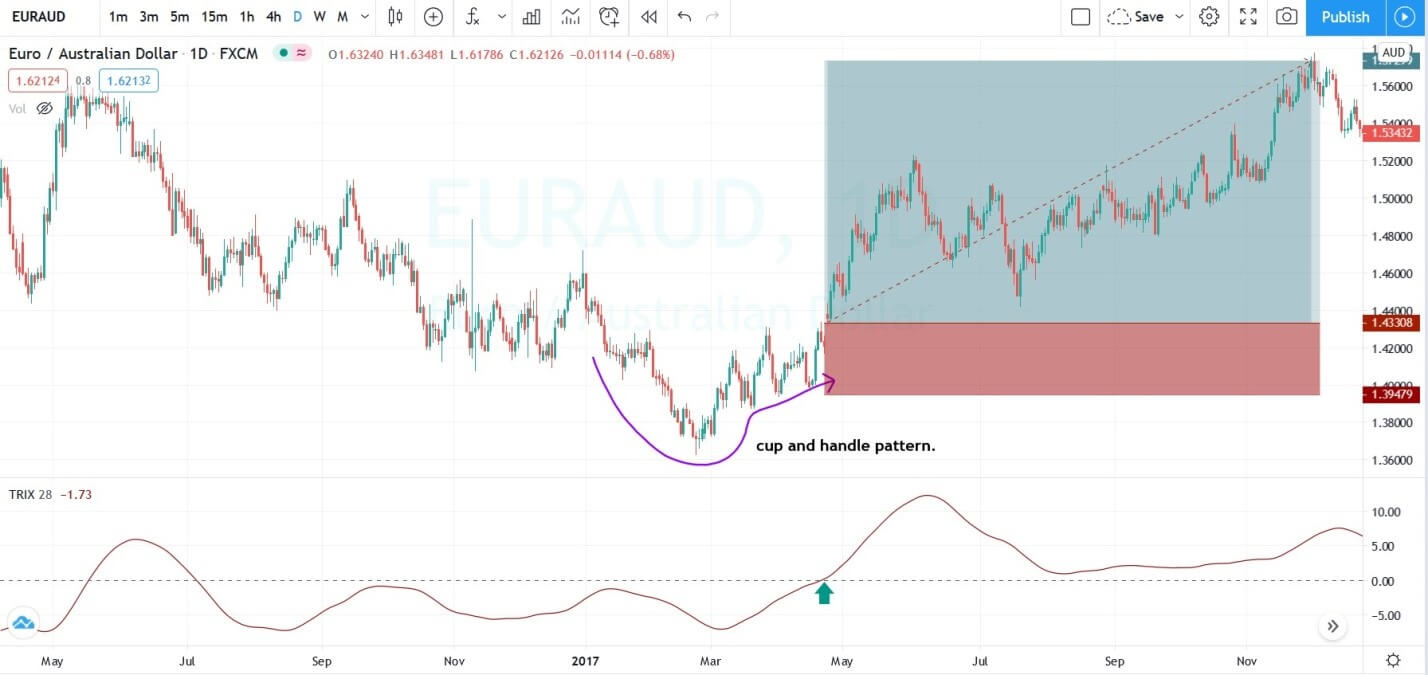
The image below represents the entry, exit, and stop-loss in the EURAUD forex pair. When the price action printed the cup phase of the Pattern, the handle phase took some time to complete its formation; this is because the overall selling trend on this daily chart was very strong. So when the prices approached the most recent higher low, sellers tried again to go down but when the TRIX goes above the zero line it was a sign of the reversal. Here we took the entry when the price action goes above the Pattern; this is because our indicator wasn’t in alignment with the Pattern. Once the indicator goes above the zero line, it means the buyer’s momentum is real and solid, and any buying entry is beneficial.
THIRD TRADE
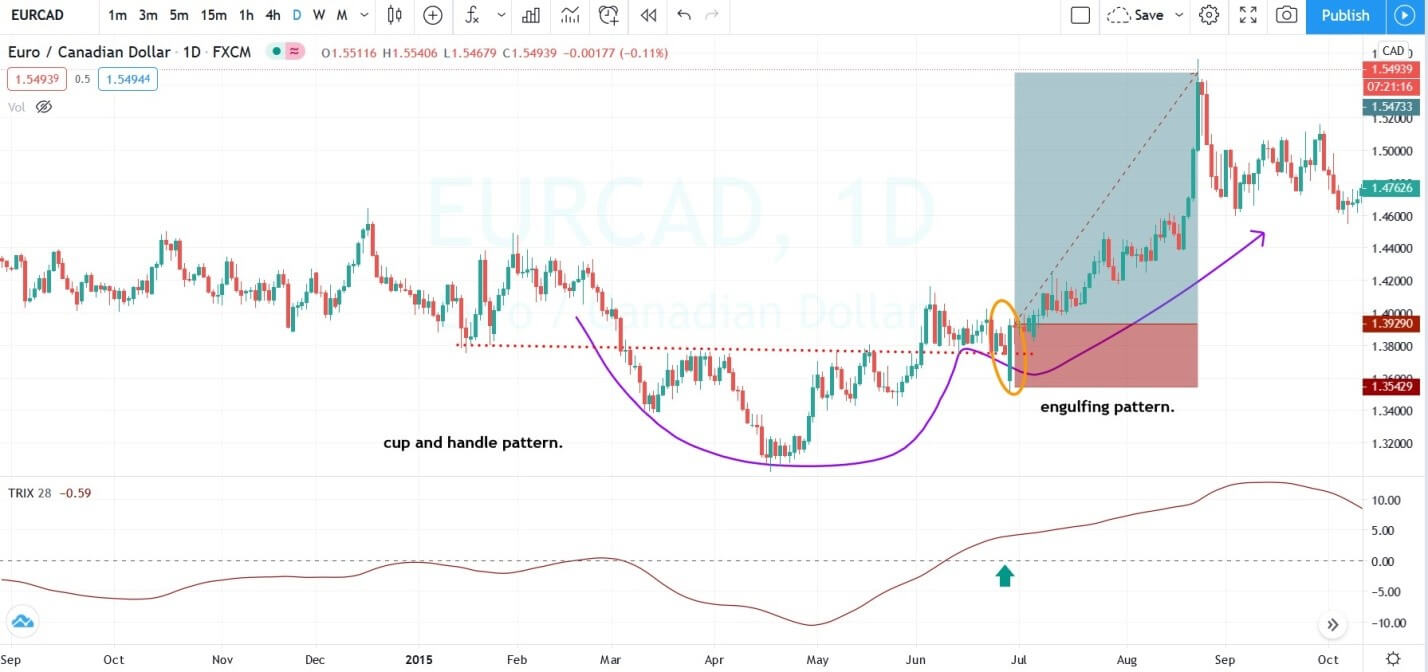
The image below represents the cup and handle in the EURCAD forex pair.
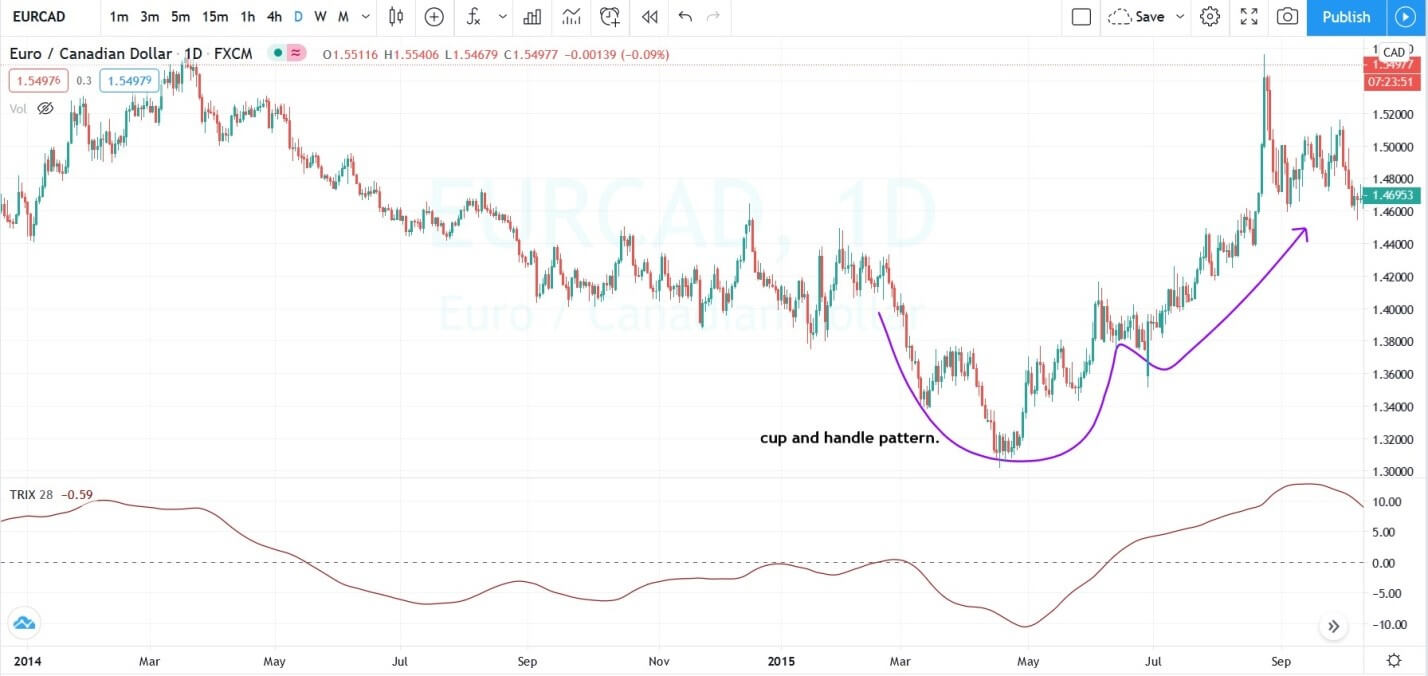
In this article the whole focus is the TRIX indicator to take an entry, the idea is when we witnessed the cup and handle pattern, and the TRIX indicator goes above the zero line it is a sign to go long. As you can see above in the two examples, this approach worked very well, but if you some found some other clues which showing you now its time to take any entry, use those clues to time the market. In the below image, the TRIX indicator goes above the zero line even before the formation of the handle pattern, which means the indicator is saying that the buying momentum is established. Still, without the proper formation of the Pattern, we decided not to take an entry.
Furthermore, during the formation of the handle portion, we witnessed the price action was respecting the support area also the formation of the bullish engulfing Pattern was a sign of aggressive buyers are back into the show. The cup and handle formation was completed, the TRIX indicator already indicated the buying momentum is established, the price was respecting the support area and the appearance of the bullish engulfing pattern everything was aligned in one direction indicating the buyers are all set to take off, we took the buying entry with the stops just below the engulfing Pattern.
When you find these extra clues which support your edge, always use them to time the market. The below trade was the perfect trade any trader ever got; it is like the sure-shot where even the Wall Street trader would like to go big. In the end, price action blasts to the north, and we witnessed the brand new higher high.
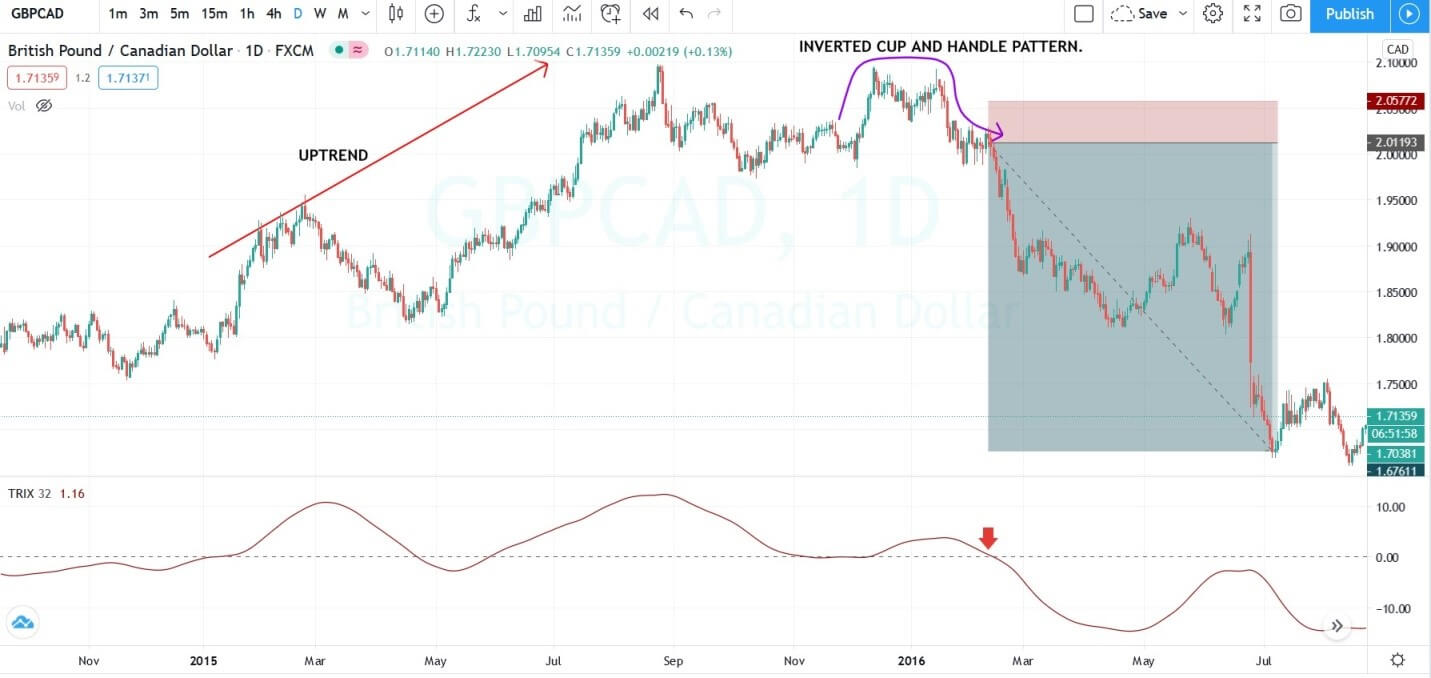
INVERTED CUP AND HANDLE PATTERN
The image below represents the inverted cup and handle Pattern in the GBPCAD forex pair.
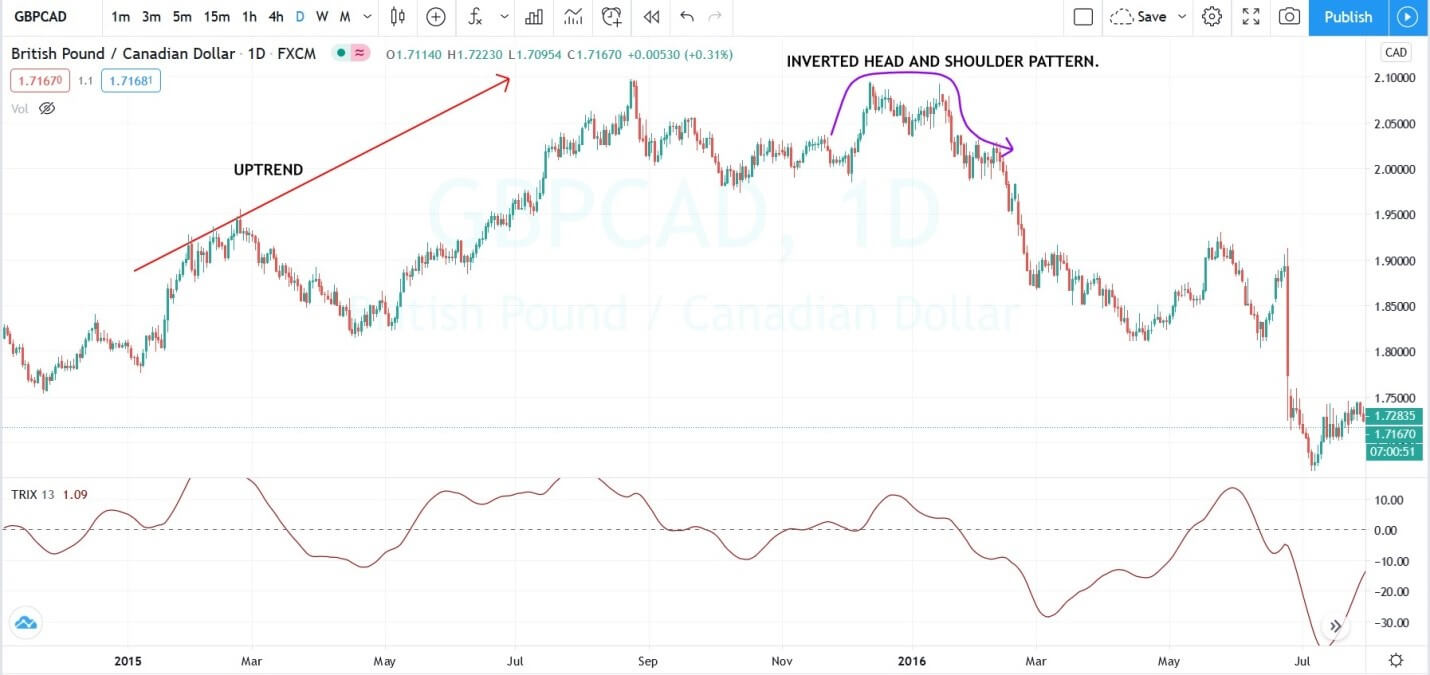
Conventional wisdom says to use the cup and handle pattern and ignore the inverted to trade the markets. Nowadays, most of the new traders rejecting old belief systems and trading new things in the market. In the image below, we showed the inverted cup and handle, there is nothing complicated in the market, or it’s not even hard to identify on the price chart. What you should do is to find out the uptrend and wait for the price action to challenge the most recent low and let the buyers at the higher low area fail to take the prices higher. When the price action approaches the most recent higher low, it means the cup portion is printed in the market, and the buyers failed to perform means the handle portion has appeared. The trade below is quite simple where we took the short entry after the indication from the TRIX indicator, this stop was just above the entry, and the aim was to look for the brand new lower low.
CONCLUSION
Trading is a lucrative business for those who knew how to play it, don’t just vaguely trade the markets, instead master the good trading strategy first then only trade the markets. In this article, we shared the technique to trade and time the cup and handle pattern. It is one of the most reliable patterns in the industry; you can find it on all the trading timeframes when the Pattern appears on the daily and weekly chart, it means for the next couple of years markets are going to be in a strong trend. You can use this Pattern to trade the reversals as well as with the trend also. On the lower timeframe look for the pullback and if the Pattern appears, use it to trade with the trend. The TRIX is a wonderful indicator that shows the momentum of the dominating party by pairing it with the Pattern one can easily recognize when the buyers are all set to explode to the north.