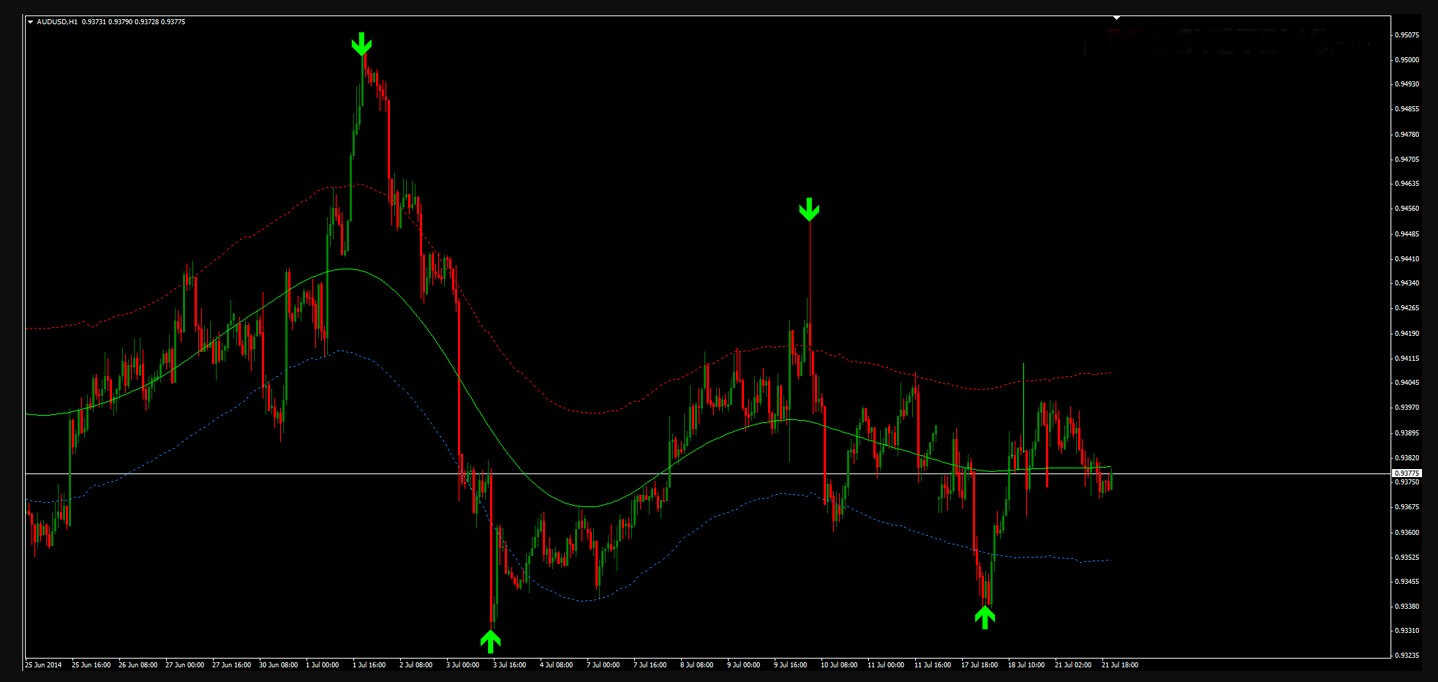
Arrow indicators are a set of tools for the “lazy” traders. On Forex charts, possible market entry points are indicated with arrows, green means the ability to open a long position, and red means a short position. The trader’s task is to be close to the platform and when the signal appears make the decision to follow it or not.
Advantages of Forex arrow trend indicators:
Arrow indicators are combined indicators that are based on several tools. They are usually based on basic classical indicators such as МА, RSI, MACD, Bollinger bands, stochastic, etc. A trader does not need to put on Forex always draws different lines and adjusts each indicator independently. Arrow indicators are already well combined and have been simplified adjustments. They are visually convenient and reduce the psychological and eye strain of a trader.
Disadvantages of arrow indicators:
Slips and repaints. Indicators are hardly applicable in scalping strategies. Problems with quotation provision, price noise, indicator lag, all these factors can cause the indicator signals to be redrawn, so an open position will not be profitable. The indicators are best to be used in the medium and long term trading on the H1 timeframe. The key factors should be observed when applying the indicators.
Which is the best way to choose an optimal arrow trend indicator for Forex:
It is better to choose an indicator according to a particular strategy. There are no versatile arrows indicators. One gives you much more accurate signals when the negotiation is flat, another in trend trading, and the other in long-term trading. You should try it on the demo account with at least 100 operations (the number depends on the frequency of the signals). Efficiency should not be less than 70% of the signs of success.
The indicator must have an open-source software for a trader to understand its operating principle and make any corrections if necessary. Below I will give as an example two arrow indicator strategies that can be used even by novice traders. There are links for you to download the indicators for MT4 (you can find them on their own on the Internet). To install the template, go to the “File” menu, choose the “Data Catalog” section and move the template you downloaded to the folder called “Templates”, move the indicators to the “MQL4” – “Indicators” folder.
Trading Strategies on Forex Arrow Trend Indicators
1. Sidus
The combined indicator Sidus 2v shows the entry points by arrows: red for sale and green for purchase. The indicator is based on 2 very popular trading tools, classic RSI and EMA (exponential moving average). Sidus gives signs of purchase when the fast ЕМА is above EMA slow, RSI is above level 50. And on the contrary, the short position should be opened when RSI is less than 50 and the fast movement is below a slow one.
I recommend not trading in this strategy at the time of publishing news, choose the no lower timeframe of H1, H4 is better, apply the strategy for the currency pair EUR/USD. Optimal indicator adjustment: the rapid EMA period is 14, slow 21, the RSI period is 14.
Opening of a long position:
-When Sidus paints a green arrow we open a long position on the next sail.
We place stop-loss fixed at 20 points.
-When profit reaches 15 points, we move the stop loss to the opening point of the transaction (breakeven) and close 50% of the transaction. The remaining position must be secured by trailing stop at a distance of 15 points.
-To use a trailing stop, you need to have a VPS server, because when the connection is lost, the trailing stop does not work.
-The selling position is opened under the same conditions when a red arrow appears.
2. Point of entry
The Forex Dots arrow trend indicator points to a successful position to a trader, not with arrows, but with points, however, the essence does not change. Signals are always formed at the beginning of a price change cosine and use for calculations the current values of MA (moving averages). The advantage of the tools is extensive use: М15 timeframe (flexible enough conditions for strategies with different time periods), currency pairs are all volatile pairs (from the euro and dollar to the Swiss franc).
The Dots parameters are:
- Length (indicator range) – 10
- AppliedPrice (price type to use in calculations) – 0
- Filter – 0
- Deviation (vertical displacement of indicator) – 0
- Shift (horizontal shift of indicator) – 0
Under different market conditions, indicator parameters can be changed as long as they have been previously tested on a demo or cents account.
Opening of a long position:
-The indicator paints a green dot that is above the minimum value of the rising sail. The distance between the minimum and the point is estimated visually (the less, the better). We open the position on the next sail.
-Stop-loss is set to the minimum value of the previous candle or to the green sign level (up to 10 points).
-We placed the trailing stop at a distance of 5 points and with it we left the market.
-The sale transaction opens the same way, but under opposite conditions: the indicator paints a red dot above the maximum of the falling candle.
If on the Forex chart the distance between the maximum sail and a red dot visually seems too large compared to previous periods, I do not recommend opening the position. For example, in the previous examples the distance was about 2 points, but in the image below the distance is about 20 points.
The advantage of this indicator is that you can build numerous strategies in markets with different volatility. But if volatility is not a feature of the market or has a fundamental reason, the position cannot be opened. The indicator is versatile and proves to be 70% effective (i.e., the number of transactions closed by stop loss is negligible).

