This indicator is an old veteran. Ichimoku Kinko Hyo was created in the 1930s in Japan. Spot forex came to life more than half a century later – in 1996. So why do people still use it? Today we will give you a clear but detailed description of this indicator and offer strategies you can apply immediately.
The structure of the indicator
There are five key terms to remember (bolded):
- Moving average crossover
When moving averages (MAs) cross, your system is telling you to enter the trade.
Tenkan-sen (fast MA)
Kijun-sen (slow MA)
Do not be surprised if these MAs do not move as smoothly as other ones you are used to using.
- Cloud (Kumo)
These two lines make the cloud:
Senkou span A
Senkou span B
The lines are not relevant on their own. The cloud they form is.
The purpose of the cloud is to say if we can trade at all.
Chikou span
Chikou span is a bit mystic, serves as an additional trade filter and few traders tend to use it.
How to Use the Cloud
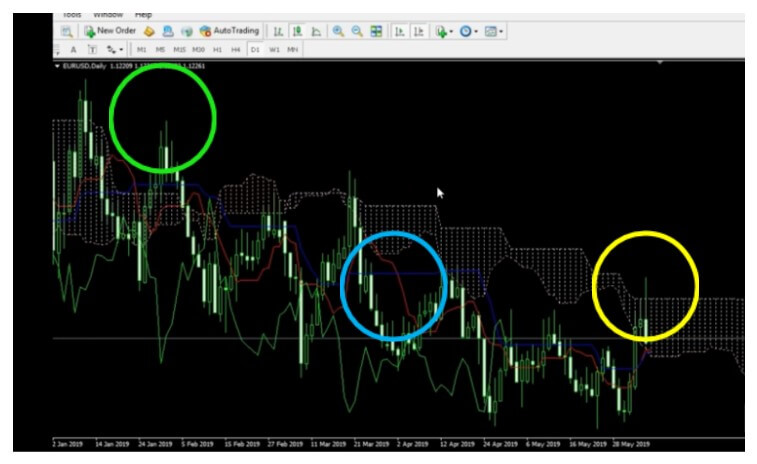
If the price sits above the cloud (green circle), this is a signal to enter long trades; when the price is below (blue circle), however, you should only take short ones.
Ichimoku is great for beginners because it clearly shows the points where they should not enter the trade. Also, it will only suggest entry points for trades that are aligned with the overall trend.
When the price is in the cloud (yellow circle), this is a sign that we need more clarity and should probably wait a bit longer. However, if you are not a beginner, you can also take long/short trades at half risk.
In this example above, the price is quite below the cloud, so we can only take short trades. As the chart reveals a decisive downward trend, we must go along. If you ever get a long signal in these types of situations, do not take that trade.
Therefore, only enter the trades that move in accordance with the overall trend.
How to Use the MAs
First, color-code your lines.
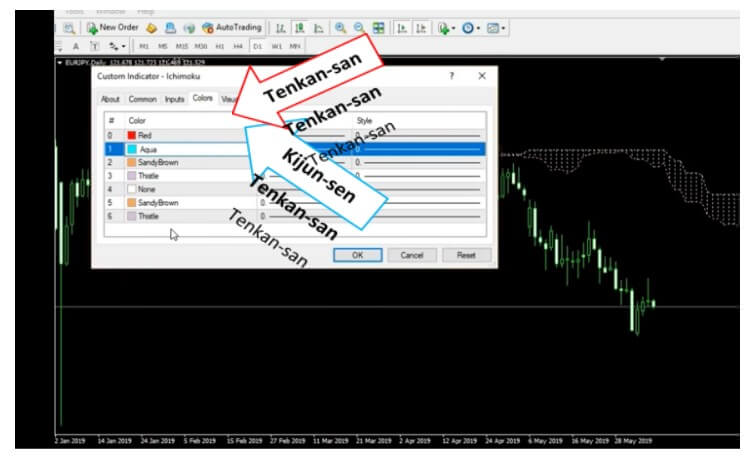
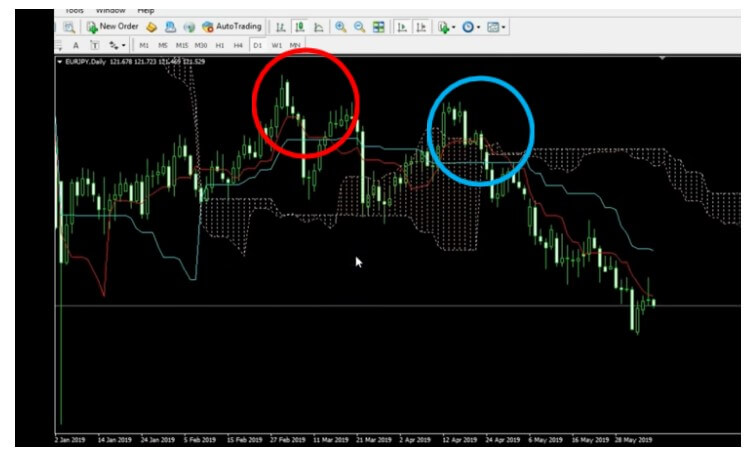
The places where the two lines cross offer an opportunity to enter a trade. This means that not every cross is going to be good for us.
For example, the yellow circle highlights the point where the Tenkan (the baseline) crossed down, but the price was over the cloud. We should not take such trades.
Out of the many chances to enter new trades, the true signal came later (blue circle). Both the cross and the price are below the cloud.
The basic rules for entry state that you should go long when the price is over the cloud and the Tenkan crosses the Kijun upward. When the Tenkan moves over the Kijun downward and the price is below the cloud, you should go short.
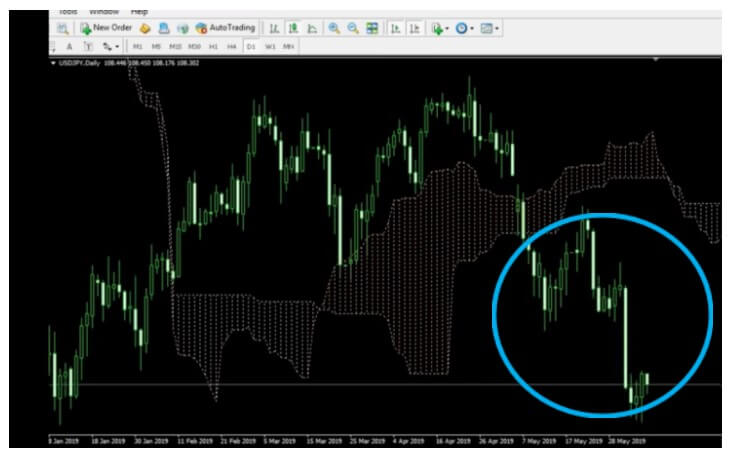
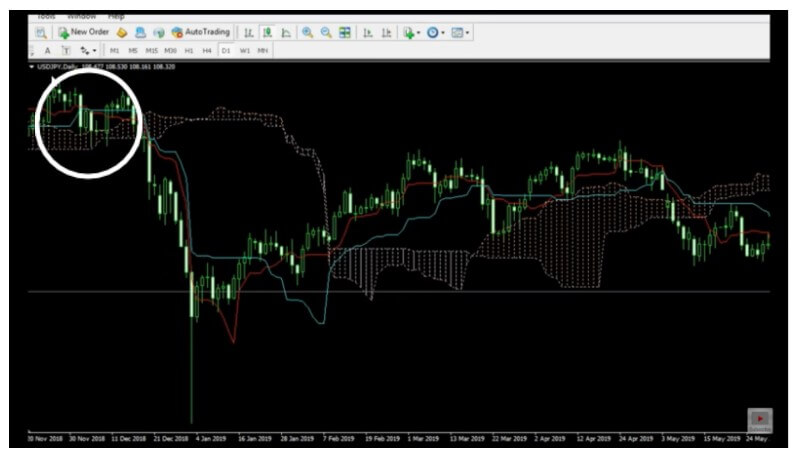
The following example will show us when to exit the trade.
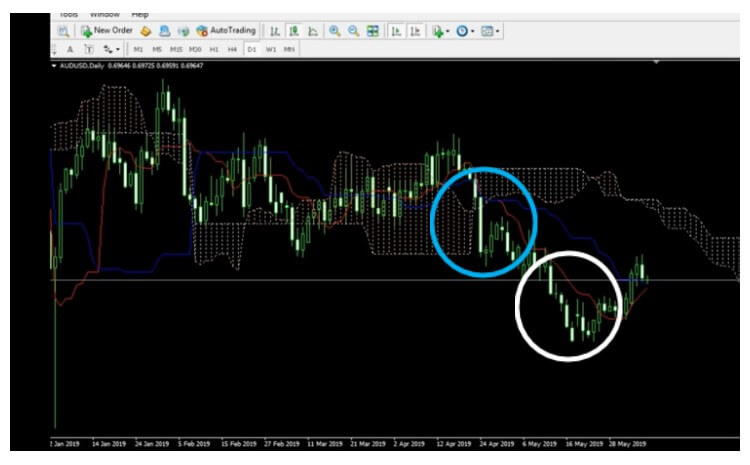
The blue circle shows the area in the chart where we would take a short trade. The white circle shows the point where we would exit.
We will stay in winning trades until the price crosses and closes the other way across the Tenkan line.
How to Use Chikou Span
The Chikou span starts 26 candles behind the current price.
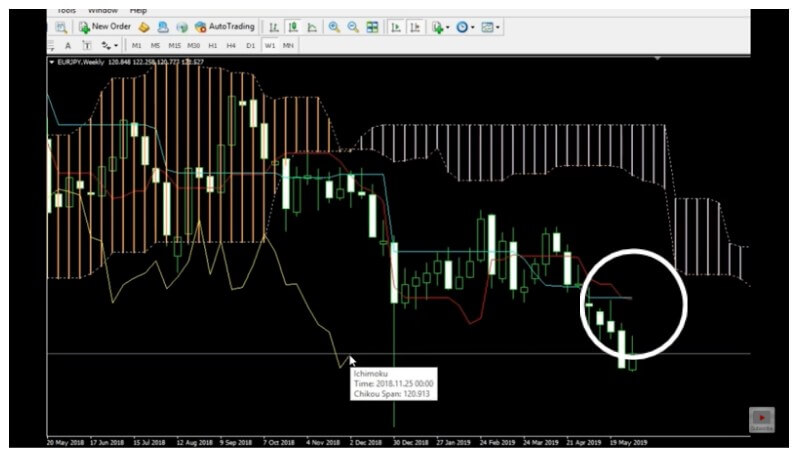
As we wait for the new candle to form where the white circle is, we still aren’t sure whether the red line will cross the blue one. Chikou span can help us bring more security to the table.
Since the price and the two lines crossing are below the cloud, so should the Chikou span be. Otherwise, we cannot take this trade. Chikou span can be found in other areas of the chart (e.g. in the cloud or above it), so we would not take this trade either in that case.
So, if you want to take long trades, the Chikou span has to be above the cloud, whereas to go long, it would have to be below. Still, these are the basic rules and there are other ways in which you can use this indicator.
Advanced strategies
- Cloud Predictor
The cloud will give two colors – the positive and the negative one, which tells us if the price is going to stay positive or negative for a while. If the cloud changes color, flipping from positive to negative or vice versa, this is a prediction that a price is likely to change direction.
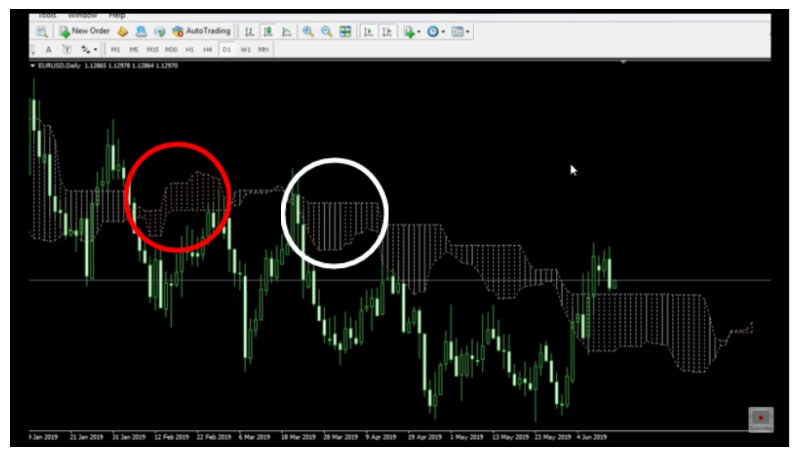
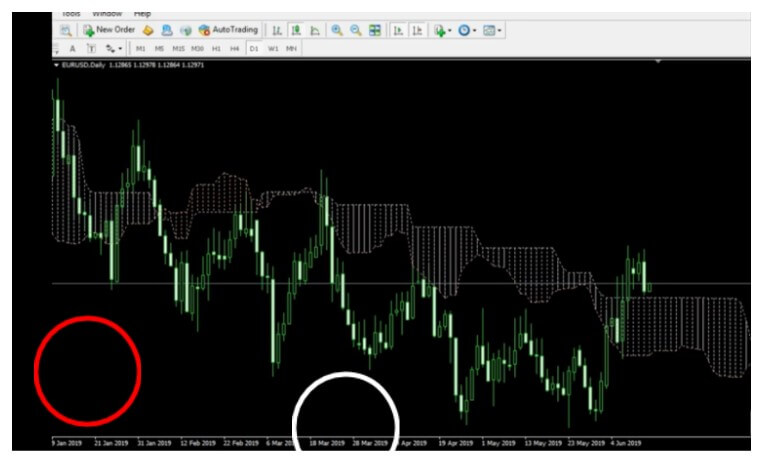
The example above shows how the cloud flipped several times, but the degree of success varied.
The red circle highlights the area of the chart where the cloud turned positive, yet the price still kept going down. The white circle reveals how the cloud predicted well that the price would remain negative, but it still cannot compensate for the possible losses from earlier.
It appears that Ichimoku is not very good at predicting the future, especially since we are dealing with trends that depend on a number of different factors (e.g. big banks and news events).
- Cloud Breakout
Traders wait for the lines to break out similar to the support and resistance strategy.
The candle closed below several times at the beginning of the chart (red circle) only to go back up, so traders need to understand the cloud breakout will fail at times. The white circle depicts a crisp cloud break.
Limitations
Apart from the previously mentioned challenges, Ichimoku can sometimes get in the way of taking really good trades. For example, in the chart below, we can see a really good trend that could have brought us amazing results, but we couldn’t take a short trade because the price was above the cloud (white circle).
Ichimoku & Other Indicators
Professional traders love to combine the Ichimoku indicator with other tools.
- Ichimoku & RSI
This combination is believed to help traders take full advantage of the underlying trend and identify market reversals.
RSI divergence allows us to see the tops and the bottoms in the market and, with the Ichimoku cloud, we will discover potential entry points as well.
Traders will detect RSI divergence in the chart when the price action goes against the Ichimoku, which indicates that a reversal is about to take place.
- Ichimoku Cloud & Moving Average (250)
This strategy is specifically designed for higher time frames, unlike the ones described before.
If the moving average line is above the price action, we are in a downtrend. Similarly, if the moving average line is below the price, the market is in an uptrend.
In this combination, should the MA be placed below the price, we should also wait for the Tenkan and Kijun lines to cross below the price to go long. Likewise, we are going to look for the Ichimoku lines to cross above the price if the MA is located above the price as well.
Conclusion
Ichimoku Kinko Hyo is an amazing tool for beginners, especially because it teaches them about discipline. Traders should really take the time to learn and set some ground rules they will never change in the middle of an ongoing trade.
Still, we must acknowledge the fact that everyone uses the Ichimoku indicator differently. While we did define the basic approach in the first half of this article, the applications can be quite diverse too.
It is also extremely important to include money management and define stop losses, risk, and take-profit points to prevent losses from killing your account.
Any divergence from the fundamental use of this indicator should stem from experience and careful analysis as well.
Finally, professional traders believe that Ichimoku Kinko Hyo has been surpassed by other indicators, suggesting to expand the toolbox through testing for a more professional approach.